
Adding sodium hydroxide to acidified glycine successively removes its two titratable protons. Two broad buffer solution regions appear around the two pKa values, separated by a steep pH rise near the isoelectric point. This is useful evidence for two separated acid-base chemistry steps even though the changing chemical species are invisible. In the approximation that added hydroxide only changes glycine protonation, is the added base amount of substance per initial amount of substance of glycine. Then , and correspond to , and ; endpoints are not exactly pure chemical species. [ref]
Organic Chemistry by John McMurry. §26.2, Figure 26.2: calculated two-leg titration and half-equivalent interpretation
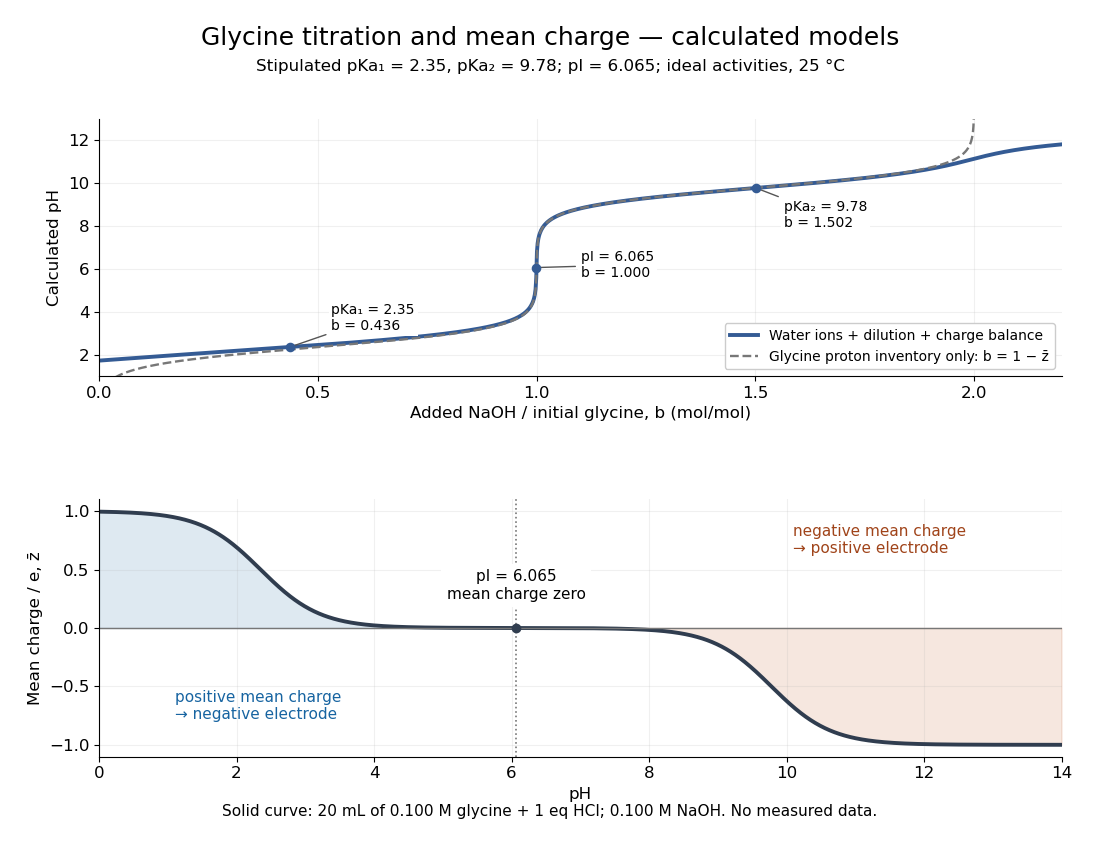

For the solid-curve model, start with of glycine in and exactly of fully dissociated hydrochloric acid; this fixes the chloride inventory, but does not force every glycine molecule to remain . Let the sodium hydroxide concentration be and . Assume volume is additive and no other ions are present; stipulate for self-ionization of water at a temperature of . ThenBalancing all positive and negative electric charges requiresSolving this equation gives the solid curve. It remains finite at and beyond , where ignoring free hydronium and hydroxide would fail. At the first pKa, the full model gives , rather than : appreciable free hydronium makes that half-equivalent shortcut inaccurate. At the second pKa, . Known acid inventory, dilution, and thermodynamic activity assumptions are therefore part of any quantitative interpretation, not optional corrections inferred from the curve's shape.
New to topics? Read the docs here!