The three principal aqueous glycine forms differ by loss of one proton at each step:Call these glycine forms , and , respectively: a cation, a zwitterion and an anion, with net electric charges , and , where is the elementary charge. specifically denotes the zwitterion, not an uncharged amino/carboxyl drawing. The first dissociation removes the carboxyl proton; the second removes a proton from the positively charged nitrogen. The chemical equilibrium changes are reversible, not three permanently separate kinds of glycine. [ref]
Organic Chemistry by John McMurry. §26.1, aqueous zwitterion protonation/deprotonation; §26.2, two successive amino-acid dissociations
For all calculations and both diagrams here, explicitly stipulate the pKa values and . These are illustrative model inputs, not measurements from the glycine titration experiment or a claim of universal constants. Actual acid dissociation constants depend on temperature and on the convention used for thermodynamic activity; apparent concentration-based values also depend on ionic strength. For comparison, the inspected textbook tabulates and for glycine, which would give a different isoelectric point. [ref]
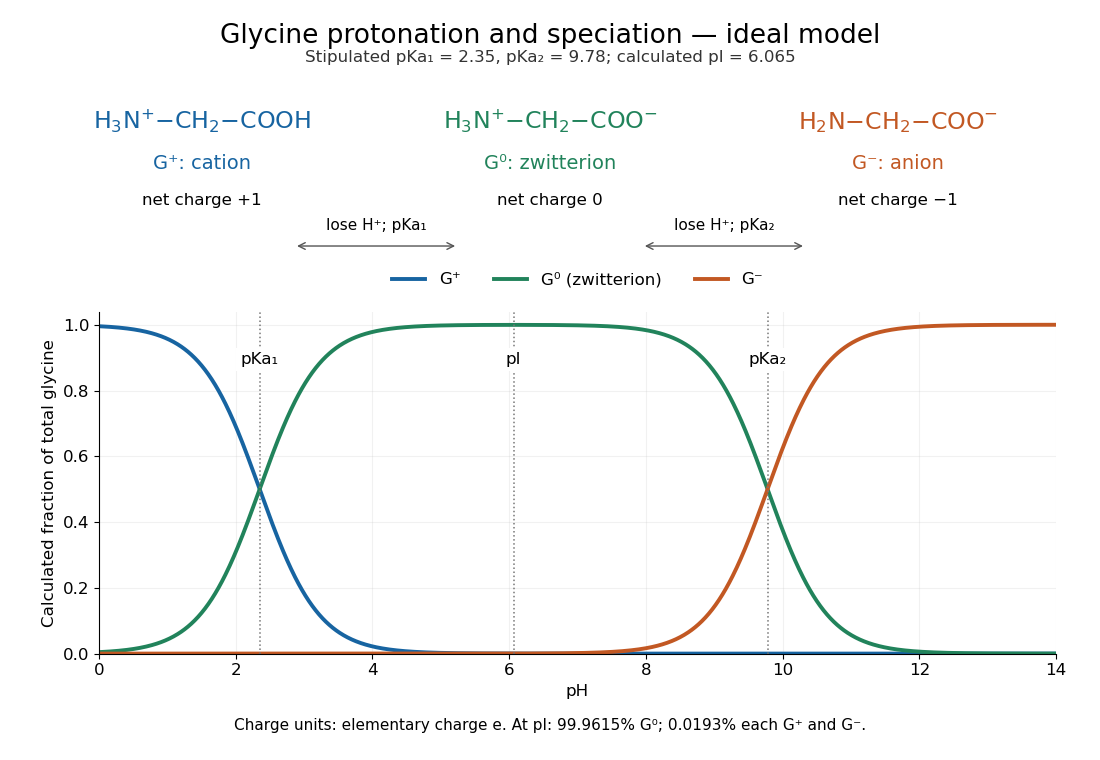

In an ideal aqueous chemical solution, set , with , and approximate activity coefficients by one. Put and for the stipulated dimensionless acid dissociation constants. The Henderson-Hasselbalch equation gives the adjacent-state ratiosWith analytical concentration , normalization gives the three fractions and mean electric charge in units of the elementary charge:All three fractions are nonnegative and sum to one. At pH , the model gives about zwitterion, cation and anion; . Predominantly zwitterionic therefore need not mean exactly at the isoelectric point.
Setting requires . Taking the logarithm yieldsAt this model isoelectric point, and : about of each charged form remains. At either pKa, the relevant adjacent fractions are equal, but the third fraction is not mathematically zero. This three-state model neglects the minor uncharged form ; macroscopic pKa values alone do not determine its fraction separately from the zwitterion.
Adding sodium hydroxide to acidified glycine successively removes its two titratable protons. Two broad buffer solution regions appear around the two pKa values, separated by a steep pH rise near the isoelectric point. This is useful evidence for two separated acid-base chemistry steps even though the changing chemical species are invisible. In the approximation that added hydroxide only changes glycine protonation, is the added base amount of substance per initial amount of substance of glycine. Then , and correspond to , and ; endpoints are not exactly pure chemical species. [ref]
Organic Chemistry by John McMurry. §26.2, Figure 26.2: calculated two-leg titration and half-equivalent interpretation
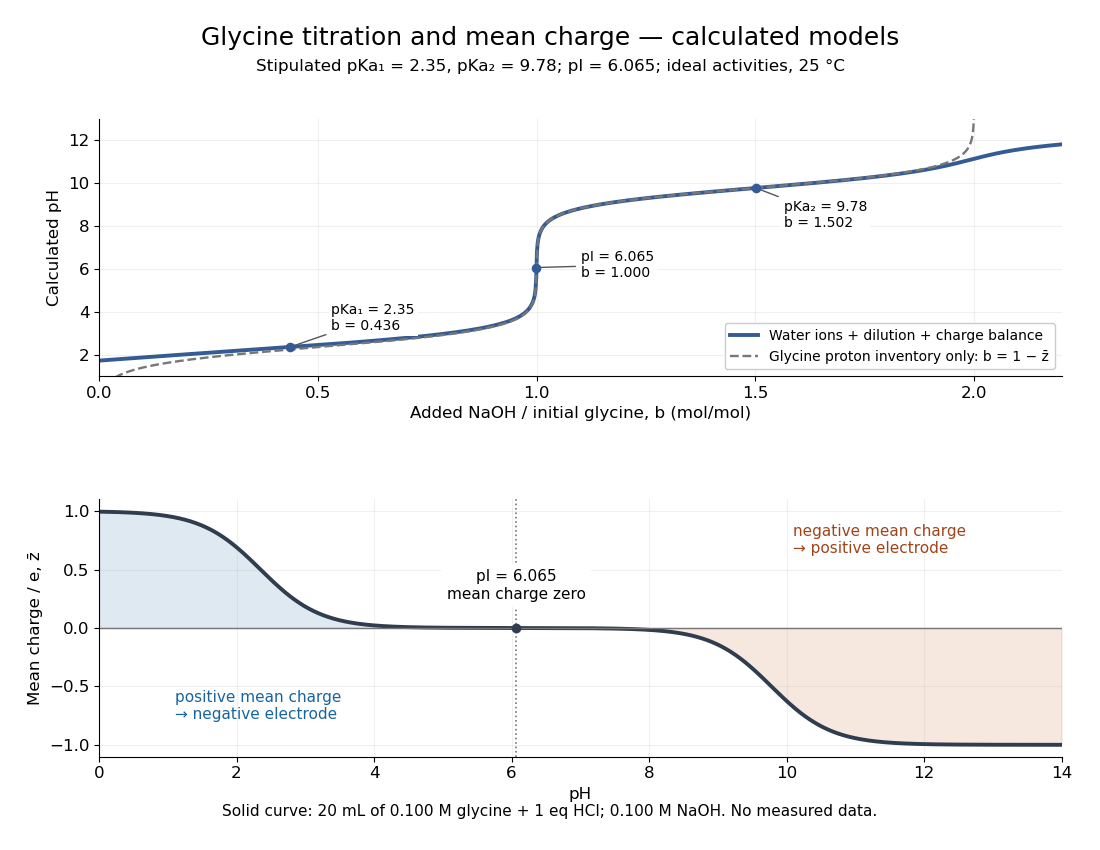

For the solid-curve model, start with of glycine in and exactly of fully dissociated hydrochloric acid; this fixes the chloride inventory, but does not force every glycine molecule to remain . Let the sodium hydroxide concentration be and . Assume volume is additive and no other ions are present; stipulate for self-ionization of water at a temperature of . ThenBalancing all positive and negative electric charges requiresSolving this equation gives the solid curve. It remains finite at and beyond , where ignoring free hydronium and hydroxide would fail. At the first pKa, the full model gives , rather than : appreciable free hydronium makes that half-equivalent shortcut inaccurate. At the second pKa, . Known acid inventory, dilution, and thermodynamic activity assumptions are therefore part of any quantitative interpretation, not optional corrections inferred from the curve's shape.
The Amrita Virtual Lab procedure uses glycine, hydrochloric acid and sodium hydroxide, two burettes, a pH meter, beaker and stirrer. A pipette transfers of glycine into a beaker. Calibrate the meter with standard buffer solutions at pH , and , then record the starting pH. Add hydrochloric acid in increments, recording pH after each addition until . Rinse the electrode in distilled water, take a separate fresh portion, and add sodium hydroxide in increments until pH . Its observed readout is paired added volume and pH, plotted as an acid-base titration curve; it does not measure each glycine form directly. [ref]
These are two titrations from the starting glycine chemical solution, rather than the single acidified-sample protocol assumed by the solid curve in glycine titration. Retain each portion's initial volume and the signed added acid/base amount of substance; do not concatenate raw burette readings and assume the result begins at . For this procedure's of glycine, each addition supplies of acid or base, a increment relative to the glycine inventory. This calculated resolution is not a reported measurement.
Useful additional controls are a fresh repeat portion, independently checked acid/base concentrations, a water blank, and a calibration-check buffer solution after the run. Stir without striking the glass electrode, keep its sensing region immersed and wait for stable readings; record temperature and background salts. Reduce addition size near a steep pH change. These are suggested controls for testing the model, beyond the published steps. A water blank can reveal contamination but must not be subtracted directly from pH, which is a logarithm.
The standards at pH , and do not bracket either endpoint of this protocol. Extreme readings therefore require independently checked instrument performance, and alkaline samples are sensitive to atmospheric carbon dioxide uptake. Electrode drift, incomplete mixing, volume error, dilution and changing ionic strength can shift apparent pKa values. A titration constrains the acid/base model; it cannot establish chirality or separate every microscopic protonation form. The two original diagrams show calculated predictions to compare with measured points, not reconstructed experimental data.
Articles by others on the same topic
There are currently no matching articles.