A lung contains branching airways and an extensive thin surface for gas exchange with blood. In humans, the right lung usually has three lobes and the left two. Airway transport, alveolar exchange and vascular flow are interacting functions rather than interchangeable measures of lung performance.[ref]
Lung compliance measures how much lung volume changes for a change in distending pressure. For a static pressure-volume relation, the local value isThe relevant pressure is transpulmonary pressure, not alveolar pressure or airway-opening pressure alone. The pleural pressure reference separates the lung's elastic behaviour from that of the surrounding chest wall.
OpenStax connects lung expansion to pressure changes, elastic recoil and pulmonary surfactant, which modifies surface-tension effects.[ref]
Anatomy and Physiology 2e by J. Gordon Betts and others. §22.3, The Process of Breathing: pressure relationships, surface tension and compliance
A compliant lung needs a smaller pressure increment for the same small volume increment, but that statement alone does not describe recoil, airway patency or overall respiratory function.A finite pressure-volume ratio is a secant slope, while is a local slope. In an original nonlinear example, set and when volume is measured in litres and pressure in centimetres of water. Local compliance is . It falls from at to at L. Across that entire one-litre interval, however, the secant compliance is in the same units. These are constructed values, not clinical reference ranges.
Static versus dynamic lung compliance distinguishes elastic behaviour from measurements during airflow. A simplified lumped dynamic model adds an airway resistance term proportional to volume-flow rate: pressure depends on both and . A pressure ratio obtained while air is moving can therefore differ from the static elastic slope. Inflation history and hysteresis also require the direction and volume interval to be specified.
In a 1959 primary study, researchers used an intra-esophageal balloon connected to a differential pressure transducer, with a mouthpiece pressure connection, to obtain pressure differences relevant to lung mechanics.[ref]
Airway Resistance and Lung Compliance by Ole Storstein and others. Methods, intra-esophageal balloon and Sanborn differential pressure transducer; Yale Journal of Biology and Medicine 31, 387–396
Such a surrogate pressure measurement has its own positioning and calibration assumptions. Spirometry supplies volume information; volume measurement alone does not establish lung compliance.Report the pressure references, volume range, flow conditions and measurement history alongside a compliance value. A single number is a property of the specified experiment and state, not an invariant description of every breath.
Static versus dynamic lung compliance distinguishes an equilibrated elastic pressure-volume relation from a breathing-cycle measurement. Lung compliance uses transpulmonary pressure, the difference between alveolar pressure and pleural pressure. A static local value is after flow and relevant transients have subsided; a finite interval instead gives over a stated pressure range.
The timing convention for dynamic measurements must be explicit. Conventional dynamic lung compliance uses volume and transpulmonary-pressure changes between the zero-flow endpoints of a breath. It is not automatically the same quantity as a ratio using peak airway pressure. The respiratory-function treatise distinguishes these definitions.[ref]
Pulmonary Function Testing by Warren M. Gold and Laura L. Koth. Static and Dynamic Compliance: dynamic lung measurements use zero-flow endpoints of a tidal breath
An original one-compartment model isolates flow contamination. Relative to a chosen baseline, let mouth-to-pleural driving pressure satisfyWith stipulated , , L and , the pressure is cm water. Dividing volume by that pressure gives 0.10 rather than the actual elastic compliance 0.20. Setting flow to zero removes the resistive term in this ideal model. This is a demonstration of a flow-contaminated pressure ratio, not a redefinition of the zero-flow dynamic measurement.
Even zero flow at the mouth need not establish full internal equilibration. Unequal filling times in apparent lung compliance can be illustrated with two independent elastic compartments receiving the same imposed pressure step. If their time constants are , thenFor in compliance units and s, s, the effective response after 0.5 s is about 0.114, whereas its long-time limit is 0.20. The shorter observation captures less filling of the slow compartment. These are constructed passive model values, not clinical reference ranges.
A primary 2022 pilot study compared four static and dynamic calculation methods during passive mechanical ventilation. Its methods distinguish plateau pressure, pressure at zero flow, constant-flow slopes and expiration-derived estimates.[ref]
Static and Dynamic Measurements of Compliance and Driving Pressure: A Pilot Study by Pierre Tawfik and others. Figure 1 and Introduction, Methods A–D; Materials and Methods, passive ventilation
Those airway-pressure measurements describe the respiratory system, including the chest wall. Separating lung mechanics requires an additional internal pressure reference, such as the esophageal-balloon approach used in the 1959 experiment.[ref]Airway Resistance and Lung Compliance by Ole Storstein and others. Methods, intra-esophageal balloon and differential pressure recording
Unequal filling times in apparent lung compliance occur when different communicating lung regions have different resistance-compliance time constants. An observation made before all regions equilibrate can measure less volume response than the equilibrium elastic relation predicts. This provides a concrete mechanism for an observation-time dependence of apparent compliance without changing the underlying component compliances.
Consider an original passive model with parallel compartments exposed to one imposed pressure step . In compartment , let added volume be , airway resistance and elastic lung compliance . The equation and initially unfilled solution areThe apparent finite-time response per unit pressure is thereforeFor positive component values it rises toward . This is a pressure-step response, not a definition that replaces every breathing-cycle compliance convention.
Take , s and s. At s, the fast region has filled about 91.8% of its eventual increment, while the slow region has filled only 22.1%. The summed apparent compliance is about 0.114, compared with the equilibrium value 0.20 in the same units. After 2 s it is about 0.163. If both time constants were 0.2 s, the 0.5-s value would instead be about 0.184, despite the same equilibrium compliance.
Early and late observations constrain different combinations. The initial volume slope is , whereas the final volume change is . A sum of exponentials also need not have one fixed decay time: a single fitted time constant depends on the fitted interval.
A primary pilot study comparing static and dynamic respiratory-system measurements discusses expiration-based estimates and the possibility of multiple time constants.[ref]
Static and Dynamic Measurements of Compliance and Driving Pressure: A Pilot Study by Pierre Tawfik and others. Introduction, Method D; Study Procedures, two measured expiratory time constants
The constructed compartment example explains why measurement duration and model form belong with the reported value. Distinguishing lung-only from total respiratory-system mechanics still requires the appropriate internal pressure reference.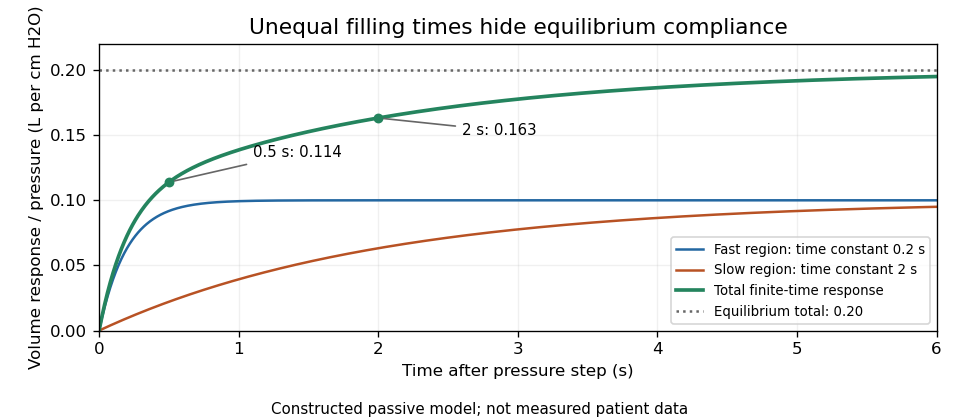
Original two-compartment pressure-step model: unequal time constants produce an observation-time dependence of apparent lung compliance
. Details. 
Observation-time dependence of apparent compliance is the change in an inferred volume-per-pressure response when the measurement is made at different stages of filling or relaxation. For an original single passive compartment exposed to a pressure step,The equilibrium compliance is , but a finite-time observation is smaller whenever and are positive and finite. A short observation can therefore confound stiffness with slow filling.
Two observation times identify the parameters only within the assumed model. Taking measurements at and and defining givesFor stipulated and , this model gives and s. The parameter values follow from the model as well as the data.
A second original example exposes finite-time ambiguity between stiffness and slow filling. Suppose the real response is the sum of two compartments, each with compliance 0.10, but time constants 0.2 and 2 s. Then and . Fitting the single-compartment formulas to just those two values gives s and equilibrium compliance about 0.146, although the actual equilibrium sum is 0.20. Two exact measurements can fit the wrong model exactly.
Even one perfect finite-time value supplies no finite upper bound on equilibrium compliance without further restrictions. For an observed at time , every choice can reproduce it withIncreasing compliance while increasing the filling time can preserve the measured response. Additional times, an independently bounded time scale or a validated compartment model add information.
The primary pilot study's discussion of non-uniexponential deflation and multiple time constants illustrates the experimental importance of this distinction.[ref]
Static and Dynamic Measurements of Compliance and Driving Pressure: A Pilot Study by Pierre Tawfik and others. Study Procedures and Discussion of method D
The constructed calculations here are pressure-step examples, not patient measurements or a replacement for the study's actual compliance definitions.Finite-time ambiguity between stiffness and slow filling means that a small volume response at one time can come from a stiff compartment or from a more compliant compartment that has not finished filling. In a passive single-compartment pressure-step model,One observation supplies one equation for equilibrium lung compliance and time constant . It does not generally identify both.
An original family makes the ambiguity exact. For an observed , choose any and setEvery choice reproduces the observation. At s and stipulated , equilibrium compliances 0.12, 0.20 and 1.00 correspond to time constants about 0.558, 1.443 and 9.491 s. Their agreement at one time does not imply agreement about equilibrium volume response.
Later measurements distinguish these particular models. At , the predicted response isThe three examples predict approximately 0.1167, 0.1500 and 0.1900 in compliance units. Those differences motivate observing more than one stage of the transient. They do not prove that a one-compartment model is adequate for an actual lung.
Early-time resistance dominance of a filling response explains the limiting behavior. Expanding the exponential for givesThe leading response depends on resistance rather than equilibrium compliance. As grows in the indistinguishable family, and tends to . Much larger equilibrium compliance can therefore be hidden behind similar early filling.
The primary respiratory pilot study discusses estimates based on expiratory time constants and why deflation need not be uniexponential.[ref]
Static and Dynamic Measurements of Compliance and Driving Pressure: A Pilot Study by Pierre Tawfik and others. Introduction, Method D; Study Procedures; Discussion of multiple time constants
An experiment should constrain its pressure step, observation duration and model class. A fitted finite-time response is not automatically an identified equilibrium material property.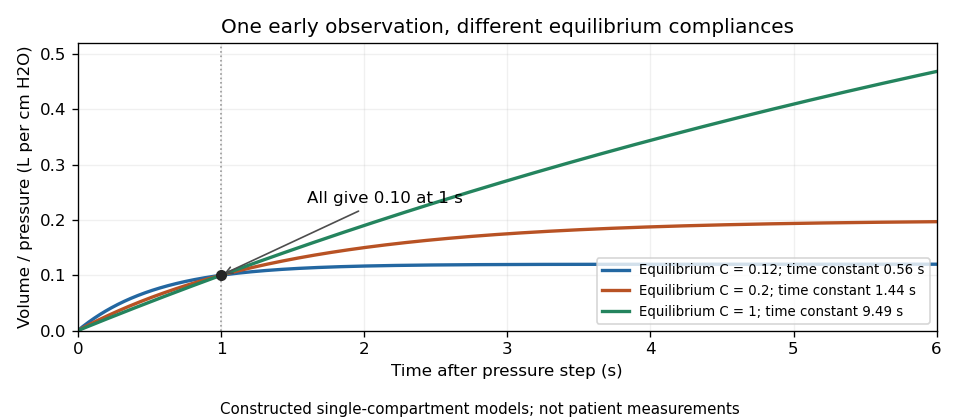
Original passive models sharing one early response while predicting different equilibrium lung compliances and time constants
. Details. 
Early-time resistance dominance of a filling response means that the initial volume admitted by a pressure step is governed mainly by airway resistance, even when the eventual volume depends strongly on lung compliance. For a passive compartment with constant airway resistance , lung compliance , imposed pressure increment and initial added volume zero,Initially the elastic recoil increment is zero, so the initial volumetric flow rate is . The initial slope identifies within this model, not .
A Taylor series makes the separation explicit:Information about lung compliance first enters the curvature. Recovering that curvature from noisy early measurements can be much harder than measuring the initial slope. The dimensionless ratio controls the approximation: the exact response divided by the resistance-only prediction is .
For an original calculation, take , and compare with . Both predict initial volumetric flow rate 1 L/s. At 0.05 s their admitted volumes are approximately 0.04877 and 0.04975 L, although their equilibrium added volumes are 1 and 5 L. An apparently precise short filling trace can therefore provide little discrimination between very different equilibrium lung compliances.
This is an ideal pressure-step calculation. A finite instrument response, an unknown driving pressure, nonlinear airway resistance or multiple compartments changes what can be inferred. A primary ventilation study explicitly measured multiple expiratory time constants because deflation need not follow one exponential.[ref]
Static and Dynamic Measurements of Compliance and Driving Pressure: A Pilot Study by Pierre Tawfik and others. Materials and Methods, Study Procedures: two expiratory time constants rather than an assumption of uniexponential deflation
An early filling slope and an equilibrium lung compliance answer different experimental questions.The pulmonary interstitium is the supporting tissue framework between and around the epithelial and vascular structures of the lung. Its thickness and composition affect mechanics and gas-transfer distance. It is distinct from the air-filled alveolar lumen.
Pulmonary surfactant is a lipid-and-protein material at the air-liquid interface of alveoli. It reduces surface tension and helps stabilize inflation. Production by type II alveolar cells links lung development and cellular secretion to the mechanical cost of breathing.
A bronchus is a conducting airway branching from the trachea toward the lung. Larger bronchi have cartilaginous support and subdivide into smaller branches. Their conducting role differs from gas exchange across the alveolar surface.
A bronchiole is a small airway beyond the cartilaginous bronchi. Its wall contains smooth muscle but lacks the cartilage of larger conducting branches. Changes in its radius can strongly affect airflow, connecting local muscle tone to pulmonary ventilation.
An alveolus is a small pulmonary air space whose thin wall participates in gas exchange with adjacent capillaries. Type I alveolar cells provide much of the exchange surface, while type II alveolar cells supply surfactant and other functions. Effective exchange requires both air access and blood flow.
The alveolar-capillary barrier is the thin tissue interface separating alveolar gas from blood in pulmonary capillaries. Gas transfer crosses the alveolar epithelium, intervening basement membrane material and the capillary endothelium. This arrangement places a short tissue diffusion path between a large ventilated surface and circulating blood; it does not mean that air and blood occupy the same compartment.[ref]
Anatomy and Physiology 2e by J. Gordon Betts and others. Section 22.1, Alveoli and the respiratory membrane; Section 22.4, Gas Exchange
Electron microscopy made the layers experimentally distinguishable. In a 1956 study, H. E. Karrer examined three electron micrographs of mouse lung and reported a basement membrane of variable apparent width between endothelium and alveolar epithelium. The paper explicitly recognized oblique sectioning as a possible cause of some apparent thickening.[ref]
The Ultrastructure of Mouse Lung: Some Remarks Regarding the Fine Structure of the Alveolar Basement Membrane by H. E. Karrer. Primary abstract, Journal of Biophysical and Biochemical Cytology 2(4 Suppl), 287–292
A micrograph establishes spatial structure in a prepared specimen; apparent width in one section is not automatically the shortest physiological diffusion distance.A planar steady-state diffusion model illustrates the functional consequence. Let layer have thickness , diffusion coefficient and gas solubility coefficient , with concentration at gas partial pressure . Equal molar flux through successive layers and Fick's first law givewhere is exchange area. These are diffusion resistances of serial alveolar barrier layers: the same flux crosses each layer, while its partial-pressure drops add.
In an original normalized example, suppose one layer contributes one quarter of the initial total diffusion resistance. Quadrupling only its thickness makes total resistance of its original value, reducing transfer to at the same partial pressure difference and area. If exchange area also halves, total transfer becomes of the original. The layer carrying most of the added resistance can matter more than a simple average thickness.
The model assumes steady transport, uniform parallel layers and specified gas solubilities. Actual gas exchange also depends on ventilation, blood delivery and reactions within blood. A structural image alone does not measure all of those processes or establish the cause of a measured gas-transfer deficit.
Diffusion resistances of serial alveolar barrier layers describe how successive tissue layers share the total gas partial pressure drop while carrying the same steady molar flux. The alveolar-capillary barrier contains alveolar epithelium, intervening basement membrane material and capillary endothelium. The distinction between a layer's thickness and its resistance matters because gas solubility and diffusion coefficient also enter.
For a planar layer , let dissolved concentration be , thickness and diffusion coefficient . With equilibrium partitioning at interfaces and no chemical consumption within a layer, Fick's first law givesThus and total molar transfer through common area is . These are area-specific resistances; the resistance for total transfer is . Mixing those two conventions loses a factor of area.
An original normalized calculation sets , , and end-to-end partial pressure difference 40 in compatible units. The flux is 10, and layer drops are 10, 20 and 10. Doubling only the middle layer's thickness raises total resistance from 4 to 6 and lowers flux to . The middle layer now carries two thirds of the total drop. One total transfer measurement cannot separately identify all three layer resistances.
Spatial heterogeneity introduces a different averaging rule. Suppose two equal-area patches have total area-specific resistances 1 and 4 under the same imposed partial pressure difference. Parallel patch fluxes add, giving conductance per total area and effective resistance 1.6. Taking the arithmetic average resistance 2.5 would predict the wrong transfer. This is parallel-path averaging of alveolar diffusion resistance.
The tissue layers themselves have an observational basis: H. E. Karrer's electron-microscope study described variation in the apparent width of the intervening basement membrane, including possible sectioning effects.[ref]
The Ultrastructure of Mouse Lung: Some Remarks Regarding the Fine Structure of the Alveolar Basement Membrane by H. E. Karrer. Abstract: three electron micrographs and variable apparent width
A measured image thickness does not independently establish every , patch area or blood-side reaction rate. The derivation is a steady transport model, not a complete clinical gas-transfer test.An alveolar septum is the tissue partition between adjacent alveoli. It contains epithelial surfaces, supporting extracellular matrix and capillaries, bringing air and blood into close proximity. Its thinness aids gas transfer while its supporting structure maintains the exchange architecture.
Articles by others on the same topic
There are currently no matching articles.