Movement of air into and out of the lungs. Changes in breathing can influence cardiac timing and can accompany emotion or nonemotional physical demands. Breathing must therefore be measured or controlled when interpreting appropriate psychophysiology recordings.
Exhalation is the outward movement of gas from the lungs through the airways. During ordinary quiet breathing, relaxation after inhalation allows elastic recoil to reduce lung volume. Forceful expiration can additionally involve active muscles.[ref]
How the Lungs Work: What Breathing Does for the Body by the National Heart, Lung, and Blood Institute. Breathing out
The term identifies a flow phase, rather than one universal muscle-activation pattern.For an ideal passive compartment, let be the excess volume above equilibrium with the outlet pressure. With airway resistance and respiratory-system compliance ,An original example uses cm HO·s/L, L/cm HO and L. The time constant is 0.60 s, leaving about 0.221 L excess volume after one time constant. After three time constants, only about 0.030 L remains. These are model calculations, not recommended expiration times.
The flow-driving pressure difference is between alveolar pressure and the pressure at the open airway. Pleural pressure affects the distension and geometry of the lung and airway but is not interchangeable with either of those endpoint pressures. Active expiration can also narrow intrathoracic airways, so greater effort need not produce proportionally greater flow.[ref]
Pulmonary Function Testing by Warren M. Gold and Laura L. Koth. Figure 25-1 and Mechanical Properties of the Respiratory System
The linear decay model is therefore useful for isolating resistance, compliance and available time, while measured flow can reflect changing airway geometry, active effort or multiple compartments. Completing one expiratory interval is a mechanical event; removing a given amount of carbon dioxide additionally depends on the composition and origin of the expired gas.
Anatomical dead space is the volume of the conducting airways that transports gas without providing the pulmonary alveolus surface for gas exchange. It includes passages such as the trachea and bronchi. It is one component of respiratory dead space, distinct from alveolar dead space associated with ineffective exchange in ventilated alveolar regions.[ref]
Pulmonary Function Testing by Warren M. Gold and Laura L. Koth. Single-Breath Nitrogen Test; The Bohr Equation for Respiratory Dead Space
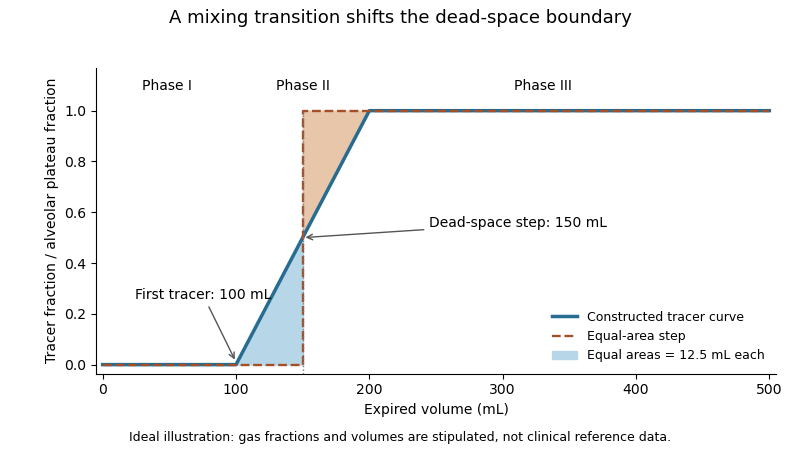
A single-breath tracer experiment makes the conducting volume observable. Following an oxygen inspiration, expired gas initially contains little nitrogen, then passes through a transition as airway and alveolar gas mix, and finally approaches an alveolar plateau. Recording gas fraction against expired volume distinguishes those phases.[ref]
Pulmonary Function Testing by Warren M. Gold and Laura L. Koth. Single-Breath Nitrogen Test, phases I–III
A 1954 primary study explicitly compared single-breath measurements using different gases.[ref]An original idealized calculation uses expired volume and a normalized tracer fraction that rises from zero to an alveolar value of one. Replacing a gradual transition with an equal-area step givesSuppose L, over the first 0.10 L, rises linearly to one over the next 0.10 L, and remains one for the last 0.30 L. The integral is L, giving L. Simply taking the first detectable tracer at 0.10 L would discard the mixing transition.
This is an operational estimate from a gas-transport record, not a direct anatomical scan. Mixing, the selected reference plateau and apparatus volume affect the interpretation. Identifying that measurement convention prevents a tracer-defined boundary from being mistaken for a sharp physical partition in every breath.
Inhalation is the inward movement of respiratory gas into the lungs. During ordinary spontaneous breathing, contraction of the respiratory diaphragm and contribution from external intercostal muscles expand the thoracic space; the resulting pressure relationships permit inward flow.[ref]
How the Lungs Work: What Breathing Does for the Body by the National Heart, Lung, and Blood Institute. Breathing in and breathing out
Positive-pressure ventilation can instead assist inward flow by raising pressure at the airway opening.The flow-driving difference is between airway-opening pressure and alveolar pressure. In a simple resistive model,where is airway resistance. For constructed gauge pressures and cm HO, with cm HO·s/L, inward flow is 0.5 L/s. These are illustrative pressures, not a measurement or a prescribed breathing pattern.
Transpulmonary pressure answers a separate question:with the pleural pressure. If the same example has cm HO, the distending difference is 5 cm HO. At a later no-flow instant, can equal atmospheric pressure while remains negative. The expanded lung can then have positive transpulmonary pressure without continued inward airflow.
It is consequently misleading to use any single negative intrathoracic pressure as a synonym for inspiration. Pleural pressure, alveolar pressure, the applied airway pressure and volumetric flow rate refer to different parts of the mechanical system. Inhalation names the flow phase; the relevant pressure differences explain how it is produced.
Respiratory dead space describes ventilated gas volume that does not contribute to the gas exchange represented by the chosen measurement. Anatomical dead space concerns conducting airways; alveolar dead space concerns ventilation of alveolar regions with ineffective exchange relative to their perfusion. The definition and estimator must be stated before the number is interpreted.[ref]
Pulmonary Function Testing by Warren M. Gold and Laura L. Koth. The Bohr Equation for Respiratory Dead Space; Physiologic Dead Space
A two-compartment carbon dioxide balance illustrates the gas-exchange estimate. Suppose inspired gas contains negligible carbon dioxide, a dead-space fraction contributes none, and the remaining expired volume carries representative alveolar fraction . For mixed expired fraction ,Stipulated and give a dead-space fraction 0.30. With tidal volume 0.50 L, the corresponding effective dead-space volume is 0.15 L. This is a dilution-model result, not proof that a conducting tube of exactly that physical volume exists.
The alveolar quantity in the equation is important. Replacing it with an arterial carbon-dioxide measurement adds physiological assumptions and can reflect more than conducting-airway volume. The technical account distinguishes the alveolar balance from its arterial substitution.[ref]
Pulmonary Function Testing by Warren M. Gold and Laura L. Koth. Physiologic Dead Space, assumptions underlying substitution of arterial for alveolar carbon dioxide
An original comparison makes the distinction concrete. Two modeled systems each have anatomical dead space 0.15 L. In one, all remaining inspired gas reaches effectively exchanging regions. In the other, an additional 0.10 L per breath goes to a ventilated region that does not exchange with perfusing blood. Their effective dead-space volumes are 0.15 and 0.25 L despite the same conducting geometry.
The label therefore belongs to a specified physical or physiological model. A measured dead-space fraction, a geometrical airway volume and an estimate of wasted ventilation are related observations, rather than automatically interchangeable measurements.
Alveolar dead space is the part of ventilated alveolar gas that does not provide the effective blood–gas exchange represented by a given dead-space estimate. An alveolus can receive gas but have little or no perfusion; it then differs from a conducting airway contributing to anatomical dead space.[ref]
Pulmonary Function Testing by Warren M. Gold and Laura L. Koth. Physiologic Dead Space
A regional ventilation measurement alone does not establish regional exchange.A constructed two-region model makes the distinction quantitative. Let tidal volume be 0.50 L and conducting-airway dead space 0.15 L. Of the remaining 0.35 L, suppose 0.28 L participates in the modeled exchange and 0.07 L comes from a ventilated, nonperfused region. Alveolar dead space is then 0.07 L, while total effective respiratory dead space is L.
The denominator changes the fraction. The nonexchanging fraction of the modeled alveolar contribution is , whereas total dead space as a fraction of tidal volume is . Neither percentage can replace the other without changing what is being compared.
If exchanging gas has carbon dioxide fraction 0.05 and the other two compartments contribute negligible carbon dioxide, mixed expired fraction isThe two-compartment dilution expression then gives , consistent with the total dead-space fraction. This is a deliberately idealized construction; real regions can have graded ventilation-to-perfusion relationships rather than a binary exchanging/nonexchanging classification.
A whole-lung gas-balance estimate consequently does not identify the anatomical location of every ineffective contribution. The primary technical chapter distinguishes conducting space from gas-exchange-based wasted ventilation and discusses the assumptions behind arterial carbon-dioxide substitution.[ref]
Pulmonary Function Testing by Warren M. Gold and Laura L. Koth. The Bohr Equation for Respiratory Dead Space; Physiologic Dead Space
Alveolar dead space makes that compartment distinction explicit.Minute ventilation, , is the total volume of respiratory gas moved per unit time, conventionally expressed in litres per minute. When breath volumes are represented by mean tidal volume and respiratory rate over the same interval,It measures gross ventilation, distinct from the portion renewing gas in effectively exchanging alveolar regions.[ref]
An original record contains three complete expirations of 0.4, 0.6 and 0.5 L over 15 s. Their total is 1.5 L, giving L/min. The rate is 12 breaths/min and the mean tidal volume is 0.5 L, producing the same answer. Variable breath depth is therefore compatible with this identity if both summaries use the same record.
With a fixed effective respiratory dead space per breath, the corresponding model for alveolar ventilation isFor the constructed record and L, the effective volume is L per 15 s, or 4.2 L/min. The remaining 1.8 L/min belongs to the modeled dead-space turnover. This subtraction assumes each included breath exceeds the modeled dead-space volume.
A pneumotachograph can supply signed volumetric flow rate for integration. Integrating only the expiratory phase yields expired volume; integrating a full balanced breath with its sign intact yields approximately zero net volume. A ventilation report must consequently identify the phase, interval and gas-volume conditions rather than interpreting every integral as the same quantity. Gross minute ventilation alone does not establish oxygen uptake, carbon-dioxide removal or their distribution among lung regions.
Mechanical ventilation assists or replaces the movement of gas into and out of the lungs using a machine. A ventilator can deliver that assistance through a mask or a breathing tube.[ref] This supports pulmonary ventilation; it does not replace every function of the lungs, circulation or gas exchange.
In positive-pressure ventilation, pressure applied at the airway opening helps drive inhalation. The resulting tidal volume depends on both that pressure history and respiratory mechanics. For a passive single-compartment model, a useful equation isHere is volume above the selected end-expiratory reference, is respiratory-system compliance, is airway resistance, and represents the baseline positive end-expiratory pressure. The model neglects active respiratory muscle pressure and changes in these coefficients.
For constructed L/cm HO, cm HO·s/L, L, L/s and cm HO, the predicted airway pressure is cm HO. At zero flow with the same volume, the resistive term vanishes and the model gives 15 cm HO. Thus an airway-pressure peak contains different information from a no-flow pressure measurement. These numbers illustrate the equation, not patient settings.
The importance of testing ventilation strategies was demonstrated by a 2000 randomized trial in acute respiratory distress syndrome and acute lung injury. It compared lower and traditional tidal volume strategies indexed to predicted body weight, with different plateau-pressure limits. In 861 participants, reported mortality was 31.0% versus 39.8%.[ref]
Ventilation with lower tidal volumes as compared with traditional tidal volumes for acute lung injury and the acute respiratory distress syndrome by the Acute Respiratory Distress Syndrome Network. Abstract, Methods and Results
The experiment compared complete specified protocols in a defined population; it does not establish one universal setting from tidal volume alone. Physical models explain how pressure and flow interact, while controlled clinical evidence tests consequences that those models cannot supply by themselves.Negative-pressure ventilation assists inhalation by reducing the pressure outside the chest relative to that at the airway opening. A chamber encloses the torso while the mouth and nose communicate with gas outside the chamber. Lower external pressure allows chest expansion and makes alveolar pressure transiently lower than the airway opening, drawing gas into the lungs.
The original 1929 apparatus report by Philip Drinker and Louis A. Shaw describes a sheet-metal tank, a sealing neck collar and the head supported outside the tank. Alternating tank pressure moved the chest while the head remained exposed to atmospheric pressure.[ref]
An apparatus for the prolonged administration of artificial respiration: I. A design for adults and children by Philip Drinker and Louis A. Shaw. Pages 230–231, Figures 1–2
This is a concrete distinction between applying a pressure change to the body surface and applying it through an airway interface.An original static example uses transpulmonary pressure . With an open airway and no flow, suppose alveolar pressure is zero on an atmospheric gauge. Changing pleural pressure from to cm HO raises from 6 to 10 cm HO. For stipulated lung compliance L/cm HO, the linear model predictsDuring the actual filling transient, pressure differences also overcome airway resistance. The static calculation does not predict the instantaneous flow waveform.
Tank pressure is a boundary condition, not a direct measurement of pleural pressure. Chest-wall mechanics and body geometry affect pressure transmission. Consequently, an equal numerical pressure at a positive-pressure airway interface and a negative-pressure body chamber need not produce identical volume changes or circulatory effects. The useful unifying quantity for lung distension is the pressure difference across the lung, together with its mechanical response.
A ventilator is a machine that assists or replaces pulmonary ventilation by supplying a controlled gas-delivery path to the lungs. The interface can be a mask or a breathing tube; the machine and interface together support mechanical ventilation.[ref] Gas delivery, oxygen concentration and respiratory mechanics remain distinct parts of that support.
A useful engineering description separates the commanded quantity from the measured response. A machine can regulate an applied pressure or a flow history while monitoring pressure and gas volume. Its displayed or reconstructed quantities depend on sensors, timing and the selected model. The manufacturer's treatment of plateau airway pressure, for example, distinguishes a hold measurement from computed monitoring estimates and states conditions under which they are available.[ref]
Measured values for Ppeak and Pplateau by Hamilton Medical. Principles of measuring plateau pressures; Monitoring parameter Pplateau
An original circuit example shows why upstream delivered volume need not equal the volume entering the patient. In a simplified volume balance,If a stipulated source supplies 0.50 L, ventilator circuit compliance stores 0.04 L during pressurization, and 0.06 L escapes through a leak, only 0.40 L reaches the modeled patient compartment. This is an illustrative uncompensated circuit, not a description of every ventilator's displayed tidal volume.
The stored term can be approximated as . A stipulated compliance of 2 mL/cm HO with a 20 cm HO pressure rise gives the stated 40 mL. Measuring volume at another location, or compensating for known circuit properties, changes what is being reported.
A ventilator consequently supplies an experimentally testable physical system: gas path, actuation, sensors and control logic. A pressure or volume setting alone is not a complete observation of alveolar gas renewal, especially when flow, leakage or circuit storage changes.
Ventilator circuit compliance, , quantifies gas volume temporarily stored in the breathing circuit as its pressure rises. Storage includes expansion of tubing and compression of gas already in the circuit. With a stated volume-reference convention, a local linear approximation isIt describes the delivery apparatus, rather than the respiratory-system compliance of the patient.
The ideal gas law explains why even rigid tubing can contribute. For a rigid circuit of volume at fixed temperature, . Expressing the extra gas as volume at the initial absolute pressure givesFor an original illustration, let L and cm HO. The gas-storage contribution is 2 mL/cm HO. If tubing expansion adds 0.5 mL/cm HO, a 20 cm HO rise stores about 50 mL in this linear model. Absolute pressure belongs in the gas-law denominator; the 20 cm HO pressure increment is not that denominator.
Under the same gas-reference convention, integrated source flow must supply both patient volume and the change in circuit storage, plus any leaked volume. A remote flow sensor therefore need not measure only tidal volume. A sensor near the airway opening moves the measurement boundary past much of the circuit storage. The manufacturer's technical account explicitly motivates proximal measurement by this distinction.[ref]
Flow sensors for mechanical ventilators by Hamilton Medical. Proximal flow and pressure measurement; Clinical evidence
Correcting storage is still a model-based operation. A single compliance coefficient does not identify an unknown leak, changing tubing properties or every dynamic pressure difference. The technical source's reproduced experimental abstracts show why circuit correction did not eliminate every discrepancy between ventilator-side and airway-side measurements. Those observations motivate checking the measurement location and gas conditions rather than equating a displayed source volume with gas entering the lung.
Positive-pressure ventilation assists inhalation by raising pressure at the airway opening, driving gas into the lungs when that pressure exceeds alveolar pressure. It differs mechanically from spontaneous expansion of the thorax or negative-pressure ventilation, which lowers pressure around the lungs to produce the relevant distending difference. A ventilator's mask or tube supplies the applied airway connection.[ref]
The direction of flow still depends on a pressure difference, not on whether either pressure is above atmospheric. For a simple resistive path,with positive directed inward and the airway resistance. In an original example, pressures 10 and 8 cm HO and cm HO·s/L give inward flow 0.5 L/s. Pressures 8 and 10 cm HO give outward flow 0.5 L/s. Both pairs are positive relative to atmosphere.
This explains why positive end-expiratory pressure can coexist with exhalation. The applied pressure can remain above atmospheric while elastic recoil produces a still higher alveolar pressure and drives gas outward. At equal opening and alveolar pressures, the same ideal resistive model gives zero flow.
The resulting tidal volume also depends on respiratory-system compliance, airway resistance, duration and any active respiratory muscle effort. The no-flow interval used to interpret plateau airway pressure removes one resistive contribution only under the required measurement conditions.[ref] Positive pressure is therefore a mode of applying mechanical assistance, not a guarantee of a particular inward flow, volume or gas-exchange result.
Helium dilution measurement of lung volume estimates communicating lung-gas volume by mixing it with a known apparatus volume containing helium. The gas concentration changes as the tracer distributes through the connected space. Connection at the quiet end-expiratory level makes the result an estimate associated with functional residual capacity.[ref]
Standardisation of the measurement of lung volumes, 2023 update by Nirav R. Bhakta and others. Measurement of FRC using helium dilution, Introduction and theory
In an ideal closed system with equal pressure and temperature, let be the known apparatus volume and its initial helium fraction. If the lung initially contains negligible helium and equilibration gives fraction , conservation givesStipulated L, and give L. If that unknown space includes 0.2 L of external mouthpiece volume, the represented lung volume is 3.4 L. Instrument space and lung space must therefore be distinguished before naming the reported volume.
Equilibration also matters quantitatively. Stopping at an apparent fraction 0.05 instead of the modeled final 0.04 would give 2.4 L, an underestimate of 1.2 L in the uncorrected model. The sensitivity isAt the stated values, a small positive fraction error 0.001 changes the estimate by approximately L. Correct concentration measurement and the stopping definition are thus parts of the volume measurement.
The technical apparatus includes a mixing circuit, helium analysis, carbon dioxide absorption and replacement of consumed oxygen.[ref]
Standardisation of the measurement of lung volumes, 2023 update by Nirav R. Bhakta and others. Equipment; Figures 6–8
These features keep other gas changes from masquerading as tracer dilution. Leaks, incomplete mixing and gas not communicating with the circuit violate different assumptions. Body plethysmography asks a complementary question about compressible thoracic gas volume; the two methods need not sample identical gas compartments.Nitrogen washout is a lung-gas measurement method that follows removal of resident nitrogen while the inspired gas contains little or no nitrogen. Gas analysis and expired volume are combined over multiple breaths to estimate the communicating gas volume.[ref]
Standardisation of the measurement of lung volumes, 2023 update by Nirav R. Bhakta and others. Measurement of FRC using MBW, Introduction and theory; Figure 5
It differs from adding helium and waiting for equilibration in helium dilution measurement of lung volume.A conservation argument supplies the basic calculation. In an ideal compartment with unchanged gas volume , initial and final nitrogen fractions and , and net nitrogen volume removed,For stipulated L, and , L. This is a simplified bookkeeping model with gas volumes compared at consistent conditions. Real equipment space and physiological gas exchange need their defined treatment.
The removed tracer is a volume-weighted quantity. For a nitrogen fraction and positive expiratory volumetric flow rate , an interval contributes , with any inspired tracer subtracted for net removal. Two constructed expired parcels of 1 L at fraction 0.4 and 3 L at fraction 0.1 contain 0.7 L nitrogen in total. Multiplying their unweighted mean fraction 0.25 by total volume 4 L would instead give 1.0 L. Correct synchronization of gas and flow signals is therefore fundamental.
A long tail need not imply one uniformly slow compartment. In an original two-compartment model,the late signal is increasingly dominated by the slow component even if its initial amount was small. A finite stopping interval can consequently miss slowly communicating material. The washout curve, its integral and the functional residual capacity estimate describe different aspects of the same transport measurement.
Body plethysmography uses pressure and volume changes in an enclosing chamber to measure respiratory mechanics and compressible thoracic gas volume. For lung-volume measurement, a brief closed-airway effort relates gas compression inside the lungs to the chamber signal. The gas volume belongs to the instant of occlusion; it is not automatically residual lung volume.[ref]
Standardisation of the measurement of lung volumes, 2023 update by Nirav R. Bhakta and others. Measurement of FRC using body plethysmography, Introduction and theory
In the original 1956 experiment, Arthur B. DuBois and colleagues used an airtight chamber of approximately 600 L, a mouthpiece shutter, capacitance pressure transducers and a cathode-ray oscillograph. One signal represented mouth pressure and the other chamber pressure, converted to volume change through instrument calibration.[ref]
A rapid plethysmographic method for measuring thoracic gas volume by Arthur B. DuBois and others. Pages 322–324, Method and Figure 1
An open communication between mouth and alveolar gas during the closed-airway effort is essential to interpreting the mouth signal.For an ideal isothermal gas amount, Boyle's law givesWith stipulated effective absolute gas pressure kPa, compression L and increase kPa, the exact expression gives 3.006 L. Neglecting the product of small changes gives the first-order result L. Here is the inferred lung-gas change, not an unconverted box-pressure reading.
If the measurement starts at quiet end-expiration, the interpreted lung-volume reference is functional residual capacity; linked inspiratory capacity and vital capacity maneuvers then provide other capacities. The thermal behavior of gas, instrument response and mouth-to-alveolar pressure equilibration remain physical assumptions to assess. A precise algebraic fit cannot repair a pressure signal that represents a different compartment.
Unlike tracer dilution, compression can probe gas that is not freely reached by the tracer during the test. This explains why body plethysmography and nitrogen washout can give different results without being duplicate names for the same observable.[ref]
Thoracic gas volume, , is the compressible intrathoracic gas volume assessed by body plethysmography at the instant of airway occlusion. It is not the volume of the entire thorax, which also contains tissues and fluid, and it does not identify a respiratory phase by itself.[ref]
Standardisation of the measurement of lung volumes, 2023 update by Nirav R. Bhakta and others. Measurement of FRC using body plethysmography, Introduction and theory
The phase matters when assigning a named capacity. In a constructed record, suppose the plethysmographic gas estimate is 3.2 L at an occlusion 0.4 L above the preceding quiet end-expiratory volume. If the measured increment and gas conditions are consistent, the corresponding functional residual capacity is L. Calling the unadjusted 3.2 L an FRC measurement would change the reference state without changing the observation.
The original experiment linked gas volume to pressure and inferred volume changes through Boyle's law.[ref]
A rapid plethysmographic method for measuring thoracic gas volume by Arthur B. DuBois and others. Pages 322–324, Method and derivation
In the small-change model,Thus a pressure-amplitude error can mimic extra gas volume. For an original illustration, let the actual gas volume be 2.8 L but the mouth signal represent only of the relevant alveolar pressure change. With all other terms unchanged, the inferred volume is L.A second model can instead contain 2.8 L readily communicating with a tracer plus 0.4 L of compressible gas not reached during the tracer test. It can yield the same apparent 3.2 versus 2.8 L comparison. The numerical difference alone does not prove which model applies.
This is why comparison with helium dilution measurement of lung volume or nitrogen washout needs both compartment definitions and measurement assumptions. The technical standard describes the different accessible gas pools and potential pressure-equilibration errors.[ref]
Standardisation of the measurement of lung volumes, 2023 update by Nirav R. Bhakta and others. Measurement of FRC, method comparison; Table 1
Thoracic gas volume is a specific physical measurement, not a direct label for trapped gas or a substitute for every lung-volume definition.Inspiratory capacity, IC, is the maximum volume that can be inhaled from the end of a quiet expiration to maximal inspiration. Its lower reference is functional residual capacity, and its upper reference is total lung capacity:The last expression combines tidal volume with inspiratory reserve volume.[ref]
Standardisation of the measurement of lung volumes, 2023 update by Nirav R. Bhakta and others. Definitions and subdivisions of lung volume; Figure 1
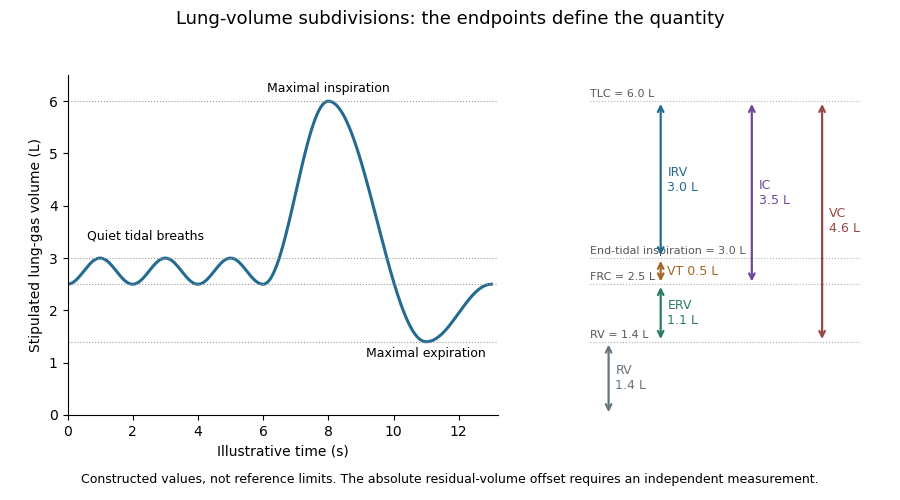
For stipulated total lung capacity 6.0 L and functional residual capacity 2.5 L, IC is 3.5 L. If tidal volume is 0.5 L, the corresponding inspiratory reserve volume is 3.0 L. The two descriptions use the same maximum inspiratory endpoint but different starting points.
The starting point is essential when interpreting a change. In an original comparison, keep total lung capacity at 6.0 L while moving the quiet end-expiratory level from 2.5 to 3.2 L. IC falls from 3.5 to 2.8 L, although the maximum inspiratory volume has not changed. Thus a lower inspiratory capacity need not imply a lower total lung capacity; an independently specified baseline is required to distinguish the possibilities.
Inhalation through a volume-measuring apparatus can determine an inspiratory increment without directly measuring the gas already present in the lungs. A stable starting level and complete endpoint connect that increment to the defined capacity. The technical standard therefore links capacity maneuvers with an identified FRC-level measurement.[ref]
Standardisation of the measurement of lung volumes, 2023 update by Nirav R. Bhakta and others. Measurement of FRC and linked capacity maneuvers
The values in the example illustrate endpoint bookkeeping rather than reference limits for a particular person.Vital capacity, VC, is the volume change between maximal inspiration and maximal expiration. It is the exchangeable difference between total lung capacity and residual lung volume:The sum uses inspiratory reserve volume, tidal volume and expiratory reserve volume.[ref]
Standardisation of the measurement of lung volumes, 2023 update by Nirav R. Bhakta and others. Definitions and subdivisions of lung volume; Figure 1
A constructed volume record with maximum 6.0 L and minimum 1.4 L gives VC 4.6 L. Subdivisions 3.0 L, 0.5 L and 1.1 L give the same result. Those increments partition the full excursion; none includes the 1.4 L that remains after maximal expiration.
Forced vital capacity names a specific forceful expiratory maneuver. The broader vital capacity can also be measured during a relaxed expiration or inspiration. The maneuver and completeness of its endpoints matter when comparing measurements.[ref]
Standardisation of the measurement of lung volumes, 2023 update by Nirav R. Bhakta and others. Definitions and subdivisions of lung volume, inspiratory VC, expiratory VC and FVC
[ref]Standardization of Spirometry 2019 Update by Brian L. Graham and others. FVC Maneuver; end-of-forced-expiration considerations
A spirometry trace records volume change, so the same VC can arise at different absolute lung-gas levels. A second stipulated record spanning 7.0 to 2.4 L also gives 4.6 L. Adding a common offset to every point leaves VC unchanged. This is why a precise vital capacity measurement alone cannot determine residual lung volume or total lung capacity.
The distinction is useful experimentally: a large recorded excursion establishes how much gas was exchanged in that maneuver, while an independent absolute-volume measurement establishes how much gas occupied the lungs at its endpoints.
Tidal volume, , is the volume of gas inhaled or exhaled during one respiratory cycle. It is a per-breath increment, distinct from the gas remaining at functional residual capacity or the maximum total lung capacity.[ref]
Standardisation of the measurement of lung volumes, 2023 update by Nirav R. Bhakta and others. Definitions and subdivisions of lung volume; Figure 1
A flow measurement becomes a volume by integration. If is positive during inspiration, thenA stipulated triangular inspiratory flow pulse lasting 1 s with peak 1 L/s has area L. Integrating a signed flow over an entire balanced breath instead gives approximately zero, because expiration cancels inspiration; that signed net transfer is not tidal volume.
Multiplying by respiratory rate gives minute ventilation, . Two constructed patterns, 0.5 L at 12 breaths/min and 0.25 L at 24 breaths/min, both move 6 L/min. They need not deliver the same gas exchange. In an ideal fixed-respiratory dead space model,where is the per-breath volume not participating in the modeled exchange. For stipulated L, the two patterns give alveolar ventilation 4.2 and 2.4 L/min. This comparison assumes each breath exceeds the modeled dead-space volume; it is an accounting example, not an individual breathing prescription.
A spirometry or flow trace therefore needs an identified interval and sign convention before its integral is interpreted. The illustration places a quiet tidal volume within a full lung-volume excursion: it shows increments on a constructed absolute scale rather than claiming that ordinary spirometry directly observes the residual offset.
Inspiratory reserve volume, IRV, is the additional gas that can be inhaled after the end of an ordinary tidal inspiration, up to maximal inspiration. It is the portion of inspiratory capacity beyond tidal volume:The starting point is end-inspiration, rather than the quiet end-expiratory level used for inspiratory capacity.[ref]
Standardisation of the measurement of lung volumes, 2023 update by Nirav R. Bhakta and others. Definitions and subdivisions of lung volume; Figure 1
For a stipulated total lung capacity of 6.0 L, functional residual capacity 2.5 L and tidal volume 0.5 L, end-tidal inspiration reaches 3.0 L and leaves IRV 3.0 L. The full 3.5 L inspiratory capacity includes both the ordinary 0.5 L breath and this additional excursion.
A deeper ordinary breath changes the subdivision even if the absolute endpoints remain fixed. Holding functional residual capacity at 2.5 L and total lung capacity at 6.0 L while increasing tidal volume to 1.0 L reduces IRV to 2.5 L. Thus a change in inspiratory reserve volume need not imply that maximum inspiratory volume changed.
The name describes an available volume increment, not a separate anatomical compartment sealed off from tidal gas. In the ideal volume ledger, boundaries between subdivisions are reference states on the same gas-volume coordinate. A useful measurement consequently states the ordinary breathing level and the maximum endpoint, rather than interpreting IRV independently of the preceding breath.
Expiratory reserve volume, ERV, is the additional gas that can be exhaled after the end of a quiet expiration, down to maximal expiration. It lies between functional residual capacity and residual lung volume:It is distinct from the ordinary tidal volume and does not include the gas left after the maneuver.[ref]
Standardisation of the measurement of lung volumes, 2023 update by Nirav R. Bhakta and others. Definitions and subdivisions of lung volume; Figure 1
For stipulated FRC 2.5 L and residual lung volume 1.4 L, ERV is 1.1 L. Beginning instead at the end of a 0.5 L tidal inspiration permits a 1.6 L expiration down to that same residual endpoint. That larger excursion includes tidal volume as well as expiratory reserve volume, so its starting point changes its name and interpretation.
A shift in the ordinary end-expiratory level also changes ERV without necessarily changing residual lung volume. If that lower endpoint stays at 1.4 L while FRC changes from 2.5 to 2.0 L, ERV changes from 1.1 to 0.6 L. This is an original comparison of reference levels, not a claim about a particular disease or posture.
The identity is useful for combining measurements. A measured FRC supplies an absolute gas-volume reference; a linked expiratory maneuver supplies the increment needed to calculate residual lung volume. The technical standard requires consistent linked maneuvers for this calculation.[ref]
Standardisation of the measurement of lung volumes, 2023 update by Nirav R. Bhakta and others. Measurement of FRC and calculation of RV
An incomplete expiration changes the observed excursion, so a reported ERV should remain attached to its maneuver and endpoints.Functional residual capacity, FRC, is the volume of gas remaining in the lungs at the end of a passive expiration during quiet breathing. It includes both expiratory reserve volume and residual lung volume:It is an end-expiratory reference level, not the gas expelled in one breath.[ref]
Standardisation of the measurement of lung volumes, 2023 update by Nirav R. Bhakta and others. Definitions and subdivisions of lung volume; Figure 1
An original volume ledger uses residual lung volume 1.2 L and expiratory reserve volume 1.0 L, giving FRC 2.2 L. A subsequent tidal volume of 0.5 L raises the represented lung-gas volume to 2.7 L. These stipulated numbers illustrate the relationships; they are not reference limits for an individual.
Helium dilution lung volume measurement supplies an independent gas-volume scale. In a simplified closed, well-mixed system, a known apparatus volume initially contains helium at fraction , while the connected lung gas initially contains none. Conservation of the tracer givesFor constructed L, and equilibrated , L. This is a model with equal pressure and temperature and no leaks or interfering gas-volume changes. It measures the volume communicating with the tracer; inaccessible gas cannot be recovered by dilution alone. The technical standard distinguishes that limitation from body plethysmography.[ref]
Standardisation of the measurement of lung volumes, 2023 update by Nirav R. Bhakta and others. Measurement of FRC, comparison of gas-dilution and plethysmographic compartments
The phase of connection matters: connecting at a different lung volume changes the volume being estimated. Defining functional residual capacity therefore requires both an anatomical gas-volume estimate and an identified end-expiratory state.
Total lung capacity, TLC, is the volume of gas in the lungs after maximal inspiration. It combines residual lung volume with vital capacity, or equivalently functional residual capacity with inspiratory capacity:The equivalent subdivision is , using expiratory reserve volume, tidal volume and inspiratory reserve volume.[ref]
Standardisation of the measurement of lung volumes, 2023 update by Nirav R. Bhakta and others. Definitions and subdivisions of lung volume; Figure 1
A constructed example assigns 1.2 L to residual lung volume, 1.0 L to expiratory reserve volume, 0.5 L to tidal volume and 3.3 L to inspiratory reserve volume. Their sum gives TLC 6.0 L. The vital capacity is 4.8 L, functional residual capacity is 2.2 L, and inspiratory capacity is 3.8 L. Each identity gives the same total because the compartments share consistent endpoints.
A spirometry trace alone measures changes at the mouth; it does not establish the volume remaining after complete expiration. Adding an arbitrary constant to the entire gas-volume trace leaves every observed inhaled and exhaled increment unchanged. An independent estimate of residual lung volume or functional residual capacity is therefore needed to fix that offset. The measurement standard obtains capacities by combining an FRC measurement with linked volume maneuvers.[ref]
Standardisation of the measurement of lung volumes, 2023 update by Nirav R. Bhakta and others. Background and purpose; Measurement of FRC
This distinction also explains why vital capacity and total lung capacity are not interchangeable descriptors. Two hypothetical systems can both have a 4 L vital capacity, while having residual lung volume 1 and 2 L respectively. Their total capacities are then 5 and 6 L. The arithmetic separates the amount that can be exchanged during the maneuver from the amount present at full inspiration.
Residual lung volume, RV, is the gas remaining in the lungs after maximal expiration. It is smaller than the quiet end-expiratory functional residual capacity by the expiratory reserve volume:Thus residual gas is not the tidal volume or a direct measurement of gas exchanged in one breath.[ref]
Standardisation of the measurement of lung volumes, 2023 update by Nirav R. Bhakta and others. Definitions and subdivisions of lung volume; Figure 1
For stipulated FRC 2.5 L and expiratory reserve volume 1.1 L, RV is 1.4 L. Since spirometry records changes rather than an absolute lung-gas baseline, exhaling into a spirometer cannot by itself identify the gas still inside.
The 1956 experiment by Arthur B. DuBois and colleagues made that hidden volume accessible through body plethysmography. Their apparatus combined an airtight chamber, a mouthpiece shutter, capacitance pressure transducers and an oscillograph. Respiratory efforts against the closed shutter related mouth-pressure changes to changes in chamber volume.[ref]
A rapid plethysmographic method for measuring thoracic gas volume by Arthur B. DuBois and others. Pages 322–324, Method, Figure 1 and equations 1–7
The physical idea follows Boyle's law. For a fixed gas amount at approximately fixed temperature, writeTo first order in the small changes,An original ideal calculation uses effective gas pressure 100 kPa, pressure increase 0.2 kPa and volume decrease 4 mL, giving mL. This estimates the gas volume at the instant of airway closure. If closure occurs at quiet end-expiration, the result corresponds to an FRC-level measurement; expiratory reserve volume must still be subtracted to obtain residual lung volume. Pressure equilibration, thermal assumptions and correct volume conventions are part of the physical measurement, not consequences of the algebra alone.
A one-compartment carbon-dioxide balance couples metabolic production with pressure-dependent ventilatory removal. A positive-part response models a nonnegative threshold-linear respiratory drive, and a transport/response delay can destabilize negative feedback. With , , the scaled law is , where and . Its positive equilibrium is ; is only its first-order small- approximation.
For and a positive steady state, linearization gives , where and . Splitting the characteristic equation of a delay differential equation at an imaginary root yields and the displayed first critical delay. The root crosses into the unstable half-plane with real derivative . If , the period near onset is approximately . For a Hill equation response, identifies whether delayed gain can exceed instantaneous damping.
A longer circulation time increases the delay between gas exchange and its sensed feedback. The American Thoracic Society's documented case relates a change in breathing pattern during one night to a longer estimated circulation time; the simple scalar model isolates a possible feedback mechanism rather than representing every determinant of that observation.[ref]
https://www.thoracic.org/professionals/clinical-resources/sleep/sleep-fragments/circulation-time-and-sleep-disordered-breathing.php. American Thoracic Society, Circulation Time and Sleep-Disordered Breathing: case discussion and circulation-time/volume/cardiac-output relation
Suspension of breathing. In nineteenth-century accounts it can include the developing asphyxial condition; its meaning must be established from context rather than automatically identified with a modern sleep-disorder diagnosis.
Alveolar ventilation is the effective rate of fresh gas reaching exchanging alveolar regions. In a simple uniform-breath model, , where is breathing frequency, tidal volume and dead-space volume per breath.
For an invented example, millilitres per minute differs from , even though both patterns move millilitres per minute in total. Equal total pulmonary ventilation therefore need not imply equal alveolar gas renewal.
Hyperventilation is ventilation in excess of the level required to remove the carbon dioxide being produced, tending to reduce arterial carbon-dioxide partial pressure. It is not defined merely by a high respiratory rate: breath depth, dead space and metabolic production also matter.
Artificial respiration supports gas movement when spontaneous ventilation is absent or inadequate. The term concerns a physiological function, while particular devices and clinical methods differ. Moving gas is distinct from restoring blood circulation, so ventilation alone cannot substitute for every component of oxygen transport.
A lung-inflation reflex carried through vagus nerve sensory pathways that inhibits inspiration. It was described in 1868 by Ewald Hering and Josef Breuer, after the 1867 examination.
An airway is a passage conducting respiratory gas. The larynx, trachea, bronchi and bronchioles are examples in human anatomy. Resistance and patency depend on geometry and wall properties, while gas exchange chiefly occurs in more distal specialized surfaces.
A tube placed in the trachea to provide an airway or a connection to respiratory recording apparatus.
Respiratory mechanics relates the movements of the thorax and respiratory diaphragm to pressure changes and airflow.
Peak airway pressure, , is the largest measured airway pressure over the specified breath or inspiratory interval. Its meaning includes the measurement location, reference pressure and temporal response. At the airway opening during positive-pressure inflation, the peak can include the pressure needed for flow through resistance as well as the pressure distending the respiratory system.[ref]
For a passive single-compartment model with constant airway resistance and respiratory-system compliance ,Here is volume above the end-expiratory state and is inspiratory flow. If constant flow persists to the end of inspiration, the largest volume and the resistive pressure occur together, givingWith varying flow, the peak is instead the maximum of the time-dependent sum; separate maxima cannot automatically be added.
An original example takes total end-expiratory pressure 5 cm HO, tidal volume 0.50 L, L/cm HO and L/s. For cm HO·s/L, peak pressure is cm HO. Doubling resistance raises the calculated peak to 25 cm HO while the equilibrated plateau airway pressure stays 15 cm HO. A larger peak can therefore occur without a larger static distending increment.
An end-inspiratory hold removes ongoing airway flow under appropriate conditions and helps separate these contributions. Active respiratory effort, leaks, nonlinear resistance or delayed redistribution complicate that separation. Peak pressure alone neither partitions lung and chest-wall loading nor establishes a unique cause of a pressure change.
Respiratory driving pressure, , is the difference between plateau airway pressure and total end-expiratory pressure when measured under suitable passive conditions:The total baseline includes intrinsic positive end-expiratory pressure when present; substituting only the externally imposed baseline can overestimate this tidal pressure difference.[ref]
For the linear static model, respiratory-system compliance is . An original calculation with tidal volume 0.45 L, plateau pressure 23 cm HO and total baseline 8 cm HO gives cm HO and L/cm HO. If the external baseline alone were 5 cm HO, incorrectly subtracting it would give 18 cm HO and a different apparent compliance.
This pressure difference loads both the lung and chest wall. At static endpoints, transpulmonary pressure gives the partitionThus a stipulated airway increment of 12 cm HO corresponds to a lung increment of 4 when the pleural increment is 8, but to a lung increment of 10 when the pleural increment is 2. Equal airway driving pressures do not establish equal lung distension without information about the chest-wall contribution.
The measurement method matters as much as the subtraction. A dynamic estimate during flow can include resistance; an end-inspiratory hold and an end-expiratory occlusion address different endpoints. The primary pilot study explicitly compared static and dynamic ways of obtaining whole-respiratory-system compliance and driving pressure.[ref]
Static and Dynamic Measurements of Compliance and Driving Pressure: A Pilot Study by Pierre Tawfik and others. Introduction, Figure 1 and Study Procedures
These distinctions explain the quantity's mechanical meaning without turning an illustrative number into an individual ventilation recommendation.Positive end-expiratory pressure, PEEP, is airway pressure maintained above atmospheric pressure at the end of exhalation. It specifies an end-expiratory pressure reference, not a tidal volume or a pressure rise measured from the beginning to the end of inspiration. A set external pressure and the total pressure assessed during an appropriate end-expiratory hold need not be identical.[ref]
How to measure driving pressure by Hamilton Medical. Measurement on Hamilton Medical ventilators; End-expiratory hold
One reason is incomplete emptying. In an original passive single-compartment model, let be excess volume above equilibrium with the prescribed outlet pressure. With airway resistance and respiratory-system compliance ,The remaining elastic pressure above the outlet is . Stipulated cm HO·s/L and L/cm HO give a time constant of 1 s. Starting with 0.50 L excess volume, after 0.5 s the model retains about 0.303 L, corresponding to 6.07 cm HO above the outlet pressure. These are constructed mechanics, not ventilator settings for a person.
If the prescribed outlet reference is 5 cm HO, the modeled retained elastic pressure raises the equilibrated total to about 11.07 cm HO. This illustrates intrinsic positive end-expiratory pressure: a pressure contribution that cannot be identified from the external setting alone. The result assumes a communicating passive compartment; active effort, leakage and heterogeneous time constants require further interpretation.
Respiratory driving pressure compares plateau airway pressure with total PEEP, rather than silently subtracting an external setting that may omit retained pressure. The manufacturer's primary measurement account states that distinction and the required passive, leak-free conditions.[ref]
How to measure driving pressure by Hamilton Medical. Driving-pressure definition and measurement conditions
Naming the pressure reference is therefore part of defining the reported mechanical quantity.An end-expiratory hold is an interruption of airflow at the end of exhalation during which airway pressure is observed while the respiratory system is occluded. In an appropriate passive, leak-free measurement it can assess total positive end-expiratory pressure, including intrinsic positive end-expiratory pressure. The set external pressure alone need not equal this measured total.[ref]
How to measure driving pressure by Hamilton Medical. End-expiratory hold and measurement conditions
The mechanical reason is easiest to see in one communicating compartment. With airway resistance , let relate airflow to the difference between alveolar pressure and measured airway pressure. Once flow vanishes and pressure has equilibrated through the communicating airway, this model gives . Zero flow removes the resistive pressure drop; it does not mean that either pressure is zero.
For stipulated pressures, an external setting of and an equilibrated total of differ by . If plateau airway pressure is , respiratory driving pressure is , whereas subtracting the external setting would give 18. These constructed values illustrate reference selection, not patient settings.
Occlusion changes the boundary condition rather than directly opening every lung region to the sensor. A compartment isolated by airway closure cannot be assumed to equilibrate with the measured opening. Active muscular effort, a leak or a pressure trace that has not settled also defeats the simple passive-compartment inference. The observed airway-pressure plateau and the inferred regional alveolar pressure must therefore remain distinct.
Intrinsic positive end-expiratory pressure is the residual alveolar pressure above the externally imposed end-expiratory pressure, associated with incomplete lung emptying. In a communicating passive compartment,The manufacturer's technical account makes this distinction and explains why a fitted whole-breath estimate can differ from the pressure obtained during an end-expiratory hold.[ref]
Measurement of AutoPEEP and total PEEP by Hamilton Medical. Opening definition; Measuring AutoPEEP; Calculations
An original repeated-breath model isolates the timing mechanism. Let be excess volume above equilibrium with the outlet just before inspiration, and let each inspiration add tidal volume . During exhalation, assume a passive linear compartment with time constant . After expiratory time ,The steady excess volume satisfies , henceFor stipulated L, respiratory-system compliance L/cm HO, s and s, , L and intrinsic pressure is about 4.66 cm HO. Giving this same ideal compartment two seconds to empty yields about 0.063 L and 1.25 cm HO. These are consequences of a model, not patient-specific timing instructions.
A nonzero external baseline does not by itself imply incomplete emptying. Conversely, setting an external baseline to zero does not prove that alveolar pressure has returned to zero. Measurements require attention to communication between regions, leakage and active muscle pressure; a single airway value need not reveal every trapped regional pressure. The recurrence explains why resistance, compliance and available time matter together rather than assigning the phenomenon to one pressure setting alone.
Plateau airway pressure, , is the airway pressure assessed during an end-inspiratory interval with no flow and sufficiently stable conditions. An end-inspiratory hold can allow the airway and communicating alveolar gas pressures to equilibrate when the respiratory system is passive and the circuit is not leaking.[ref]
Measured values for Ppeak and Pplateau by Hamilton Medical. Definition of airway pressures; Principles of measuring plateau pressures
[ref]The distinction from peak airway pressure follows a simple single-compartment model:During the modeled hold, , leavingHere is respiratory-system compliance, is airway resistance, and total positive end-expiratory pressure supplies the starting reference. The measured difference is the corresponding respiratory driving pressure.
In an original example, total PEEP 8 cm HO, tidal volume 0.40 L and compliance 0.04 L/cm HO give cm HO. If flow immediately beforehand is 0.5 L/s and resistance is 12 cm HO·s/L, the model's airway pressure during that flow is 24 cm HO. The 6 cm HO difference is the modeled resistive contribution, not an extra static distending pressure.
A plateau does not directly measure pleural pressure or isolate the lung from the chest wall. For the same stipulated alveolar pressure 18 cm HO, pleural pressures of 12 and 2 cm HO imply transpulmonary pressures of 6 and 16 cm HO. The airway value alone cannot distinguish those states.
Finally, a stable displayed number is not automatically the same operation as an actual hold. The manufacturer distinguishes measured holds, rapid occlusion and calculated monitoring estimates.[ref]
Measured values for Ppeak and Pplateau by Hamilton Medical. Principles of measuring plateau pressures; Monitoring parameter Pplateau
Reporting the method and its conditions connects plateau airway pressure to the mechanical question it can answer.An end-inspiratory hold is a pause after inflation during which the airway is occluded and external flow is interrupted. Under passive, leak-free conditions, the resulting pressure trace helps distinguish flow-related airway resistance from the pressure remaining at approximately fixed lung volume. A stable endpoint provides a plateau airway pressure for interpreting respiratory-system compliance.[ref]
How to measure driving pressure by Hamilton Medical. End-inspiratory hold; passive and leak-free measurement conditions
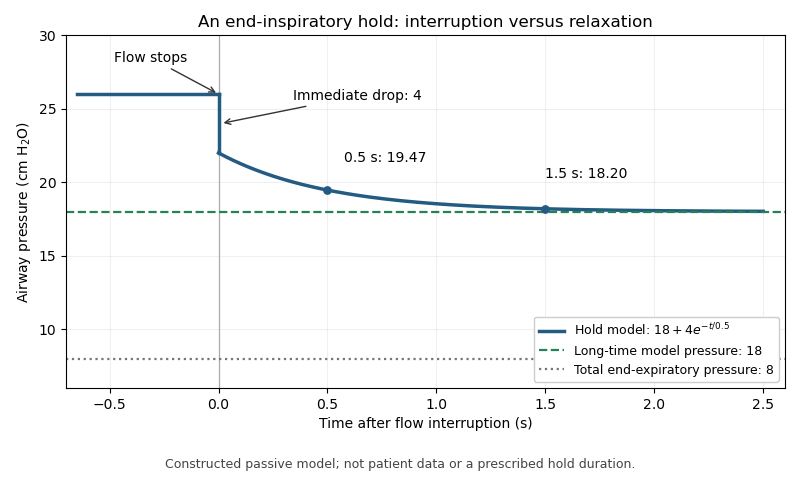
Stopping flow does not imply that every compartment instantaneously reaches a common pressure. Stress relaxation, redistribution between lung regions and the apparatus response can produce a continuing pressure change after the rapid resistive drop. The measured value should therefore identify the observation interval, rather than treating the first post-interruption sample as universally equilibrated.
For an original illustrative trace, suppose flowing peak pressure is 26 cm HO and stopping flow immediately removes 4 cm HO. Let the subsequent relaxation beThe initial hold value is 22 cm HO, about 19.47 remains after 0.5 s, and about 18.20 after 1.5 s. The model's long-time value is 18. The change from 26 to 22 and the later change from 22 toward 18 represent different mechanisms in this constructed example.
With total end-expiratory pressure 8 cm HO, using the initial hold value gives a nominal respiratory driving pressure of 14, whereas using the asymptotic value gives 10 cm HO. The difference demonstrates the importance of time and model assumptions; it does not prescribe a hold duration. Continued muscle activity, leakage or airway closure can invalidate the simple static interpretation. The experimental pilot study compares static and dynamic measurement methods rather than assuming all displayed pressure estimates are interchangeable.[ref]
Static and Dynamic Measurements of Compliance and Driving Pressure: A Pilot Study by Pierre Tawfik and others. Figure 1 and Study Procedures


An esophageal balloon is a thin-walled pressure-sensing balloon placed in the oesophagus and connected to a pressure-measurement system. Its mechanical purpose is to couple surrounding pressure to the gas inside it. An esophageal balloon catheter supplies the pneumatic connection; esophageal pressure measurement concerns the interpretation of the resulting signal as evidence about pleural pressure.
A useful idealization separates the contributions:where balloon tension, tissue reaction and an instrumental offset can affect the reading. This additive model is bookkeeping, not a universal constitutive law for the tissue or balloon. A pressure change can be transmitted well even when the baseline has an offset.
The primary physiological study by Francesco Mojoli and collaborators changed balloon filling and compared pressure transmission with baseline contributions from the esophageal wall. Its observations demonstrate that favorable transmission of pressure swings does not by itself remove the esophageal balloon filling artifact.[ref]
In vivo calibration of esophageal pressure in the mechanically ventilated patient makes measurements reliable by Francesco Mojoli and others. Abstract and Results: filling, transmitted changes and wall-pressure contribution
For a constructed example, suppose surrounding pressure changes from 6 to while a fixed added pressure is . The balloon reads 8 and 12: it reproduces the change exactly but overestimates both absolute values by two. Consequently, agreement of a change measurement is a different validation claim from agreement of absolute pressure. Neither the balloon's name nor its presence inside the chest makes those claims automatic.
Esophageal pressure measurement records pressure in the oesophagus, commonly with an esophageal balloon, to obtain information about respiratory mechanics and pleural pressure. The measured signal is a local surrogate. It is not a direct map of pressure everywhere in the pleural cavity.
A primary validation experiment by Ahmet Baydur and collaborators compared changes in esophageal and mouth pressure during end-expiratory airway occlusion and spontaneous efforts. Ten subjects were studied in different postures; some discrepancies changed when the balloon was repositioned.[ref]
A Simple Method for Assessing the Validity of the Esophageal Balloon Technique by Ahmet Baydur and others. Abstract: subjects, posture, occlusion and repositioning
The esophageal balloon occlusion test therefore evaluates pressure-change transmission under specified conditions, rather than proving all absolute-pressure values correct.In an ideal local model, write . If and remain fixed during an effort, thenwhen mouth and pleural pressure changes coincide under the test's assumptions. A ratio near one supports transmission gain near one, but leaves unidentified. Even perfect change agreement cannot determine that constant baseline offset.
The consequence matters when calculating transpulmonary pressure . For an illustrative alveolar pressure of 15 and true local pleural pressure of , the difference is eight. Substituting an esophageal reading of nine with an uncorrected offset of two gives six instead. The arithmetic identifies an error mechanism; it does not supply a clinical correction or assume that all pleural regions have pressure seven.
Instrument calibration, balloon coupling, body position and the physiological assumptions of the comparison address separate sources of error. Reporting the waveform without those conditions can conceal which inference was actually tested.
An esophageal balloon catheter is the tube-and-balloon instrument used to transmit a pressure signal from a balloon in the oesophagus to a pressure sensor. The esophageal balloon is the coupling element; the catheter also introduces a gas-filled line, connections and an external measurement chain. Those components can affect both baseline pressure and dynamic response.
The physiological filling study by Francesco Mojoli and collaborators shows why treating the assembly as an ideal pressure wire is inadequate: changing balloon filling altered pressure-change transmission and wall-related baseline pressure.[ref]
In vivo calibration of esophageal pressure in the mechanically ventilated patient makes measurements reliable by Francesco Mojoli and others. Abstract, Methods and Results
This establishes a measurement dependence, not one universal filling volume for every catheter and surrounding pressure.A minimal model of pneumatic response lag of an esophageal catheter iswhere is a varying source pressure and the sensor output. For a step from to , the response isWith a stipulated , 63.2 percent of the step appears after 0.10 s and 95.0 percent after 0.30 s. These are model calculations, not specifications of a clinical device.
This dynamic error differs from a fixed offset: waiting longer removes the modeled step-response lag but not a baseline bias. A comparison against a known pressure waveform can test the instrument's response, while an esophageal balloon occlusion test addresses transmission in the measurement setting. Neither validation alone proves that esophageal pressure equals regional pleural pressure throughout the lung.
The esophageal balloon occlusion test checks how well changes measured by an esophageal balloon catheter track changes in pleural pressure. During an inspiratory effort against an occluded airway at end-expiration, the comparison is between the pressure change in the balloon and that at the mouth. The original study by Ahmet Baydur and colleagues tested ten subjects in sitting, supine and lateral positions. Repositioning the balloon could improve agreement when a supine measurement initially differed.[ref]
A Simple Method for Assessing the Validity of the Esophageal Balloon Technique by Ahmet Baydur and others. Abstract, end-expiratory occlusion protocol and positional findings
The mechanical rationale is a change comparison. With no external flow and approximately fixed lung volume, the change in transpulmonary pressure is small in the simple static model. Consequently,for a balloon that transmits pleural changes appropriately. The reasoning assumes communicating airways and a suitable measurement system; it does not establish equality merely because flow at one sensor is zero.
An original example uses simultaneous mouth-pressure changes cm HO and balloon changes cm HO. Their proportional response is 0.9. Repeating several efforts makes that relation more visible than interpreting one small pressure fluctuation in isolation.
Importantly, a successful change test does not determine the absolute offset. If a hypothetical sensor obeys , the ratio of changes assesses , while the constant cancels. A true pleural change from to recorded as 0 to has unit change ratio despite a 5 cm HO offset. Esophageal pressure measurement therefore needs a clear distinction between tracking respiratory swings and assigning an absolute pressure for a transpulmonary calculation. The test interrogates pressure transmission, not every possible source of measurement error.
Articles by others on the same topic
There are currently no matching articles.