An optical pulse pedestal is lower-level optical power extending around a pulse's dominant short peak. It can precede the peak, follow it or extend on both sides. A broad pedestal can carry substantial laser pulse energy while barely changing the peak's full width at half maximum. Optical pulse temporal contrast describes the relative power levels; integrated energy also depends on how long each contribution persists.
For an original power-profile model, choose a central rectangular contribution of height and duration , together with a pedestal of height and duration , centred at the same time. Let . The peak power is , while the pedestal lies below half of that value. The power FWHM is therefore still , butThese are stipulated additive power contributions, not a rule for adding coherent electric fields.
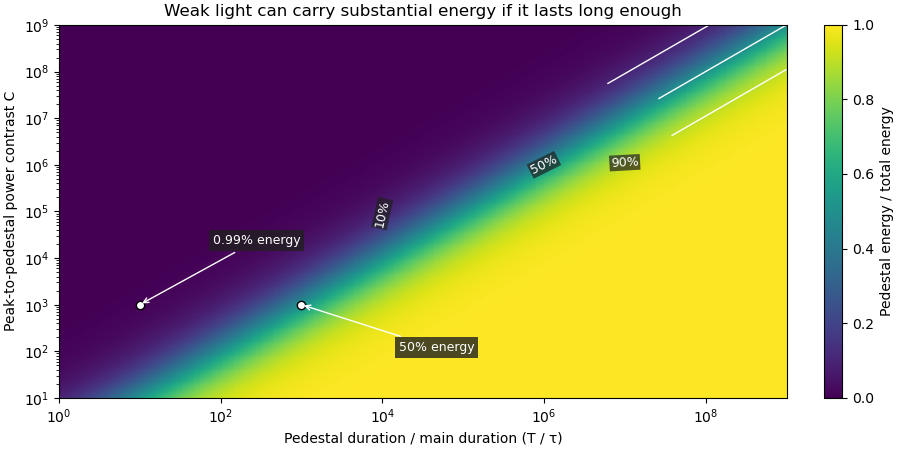
Set and . The pedestal then contains half the total energy even though its power is about a thousand times below the main peak. With and , each contribution carries . The peak-to-pedestal power ratio is exactly in this example. An inverse convention would quote a small pedestal-to-peak ratio instead; state which contrast definition is being used.
A measurement needs temporal range as well as dynamic range. A narrow scan can miss broad wings, while a readout that resolves only the peak can bury a pedestal in its own background. A commercial example is the Sequoia third-order cross-correlation instrument, whose manufacturer identifies temporal-contrast measurement as its purpose and separately specifies scan range and temporal resolution.[ref]
Sequoia temporal contrast measurement by Amplitude. PDF pp. 1–2, measurement purpose, third-order cross-correlator, scan and resolution specifications
The cited instrument description establishes the measurement approach; the numerical profile above is an independent model.A real optical pedestal must also be distinguished from detector baseline subtraction errors. Blocked-beam and reference measurements characterize the detector background, while a suitable optical measurement tests whether low-level light accompanies the pulse. A detection time gate that excludes a pedestal changes the admitted energy relative to a detector integrating the full waveform.
The pedestal energy fraction is the fraction of an optical pulse's laser pulse energy assigned to its optical pulse pedestal. Specify the decomposition and integration interval before quoting it. For a nonnegative additive radiant power model ,The assumptions imply by integration. A pedestal fit is a model of the measured radiant power; it is not automatically a unique physical separation into optical fields. Overlapping fields with optical coherence can have wave interference terms, so their separate field energies cannot generally be added as though those terms were absent.
The distinction from optical pulse temporal contrast is quantitative. Use the stipulated rectangular model of optical pulse pedestal: a main contribution has height and duration , while a centered pedestal has height and duration . For , the total peak is and the power full width at half maximum remains . Define peak-to-pedestal contrast . ThenHalf the laser pulse energy is in the modeled pedestal when . A large peak-to-pedestal ratio therefore does not by itself imply a small energy contribution.
For an original comparison, fix and the same in both traces. With , the pedestal fraction is ; with , it is . Thus the same contrast and power FWHM can coexist with about1% or50% pedestal energy. At fixed finite , increasing the pedestal duration can make approach one without changing that FWHM.

Optical energy outside a time gate is a related observable that avoids assigning a pedestal underneath the main peak. For a specified gate containing that peak,In the rectangular example with equal to the main interval, . At and , this is , while . The difference is pedestal power inside the gate, which the outside-gate measurement does not label separately.
The analysis must also specify its temporal coverage and detector baseline subtraction. Subtracting actual weak light as though it were detector background changes the inferred laser pulse energy. A short detection time gate omits outlying light instead. Neither operation is justified solely by knowing the peak-to-pedestal contrast. The Sequoia technical sheet illustrates why temporal coverage and resolving power are separate instrument properties: it lists scan range, scan resolution and optical temporal resolution independently.[ref]
Sequoia temporal contrast measurement by Amplitude. January2024 sheet, PDFp2, Specifications
Optical energy outside a time gate is the radiant energy excluded by a specified ideal temporal acceptance set . For a nonnegative radiant power profile of finite positive total energy,The time-integral definition is the radiometric one.[ref]
International Lighting Vocabulary by CIE. entry17-21-041, note1, radiant energy as the integral of radiant flux
This observable needs a gate boundary but no fitted separation into a main field and an optical pulse pedestal.For an original three-pulse example, let an optical prepulse, main pulse and optical postpulse carry , and respectively, with disjoint supports. A gate containing only the main pulse admits of , so . Widening that gate to include the postpulse reduces the fraction to . The optical waveform has not changed; the admitted observable has.
For a translated interval with continuous boundary values,Unequal power at the boundaries produces first-order sensitivity to a timing shift. Equal boundary values eliminate this derivative but need not eliminate higher-order loss; quadratic energy loss from centred Gaussian gate timing error gives an existing example.
The total-energy denominator must cover the excluded light too. If the acquisition window misses an unknown tail, pulse-energy interval from incomplete tail measurements supplies conditional bounds rather than an exactly known fraction. A detection time gate on an electrical detector trace also includes the detector impulse response and is not automatically an ideal gate on incoming optical power. A characterized optical response and a stated detector baseline subtraction are needed to compare the two.
Optical pulse temporal contrast compares a pulse's peak with weaker light at another time. For a radiant power trace with peak , explicitly choose either the peak-to-local ratio or its inverse . The first is at least one where the local power is positive; the second lies between zero and one. With a fixed transverse beam shape, the same ratio can be formed from light intensity. If the beam shape changes with time, specify the spatial sampling instead of identifying local intensity and total power.
A plateau at of the peak has and . Expressing this power ratio as optical contrast in decibels givesFor an amplitude ratio whose power ratio is , the same definition gives . Contrast also needs a delay or time range: an optical prepulse, an optical postpulse and a long optical pulse pedestal can have the same relative height but different positions and laser pulse energies. The pedestal energy fraction additionally requires integration over the contribution's duration.
A useful nonlinear measurement is third-order intensity autocorrelation. In an ideal instantaneous model, an input light intensity generates a second-harmonic gate proportional to . Sum-frequency generation with a delayed fundamental replica gives a recorded signal proportional toThe instrument measures this cross-correlation, rather than simply reading . Finite gate width, phase matching, spatial overlap and detector response enter the interpretation.
The1998/99 instrument of J. Collier and colleagues used second-harmonic generation, a Wollaston prism and an optical biprism to form crossing fundamental and harmonic beams. A second crystal generated the sum-frequency signal, imaged through optical filters onto a charge-coupled device. Position encoded delay. An inserted glass etalon produced a delayed replica near of the main signal, recorded on one side of the correlation peak. Figure4 combines window settings shifted with etalons.[ref]
A Single Shot 3rd Order Cross-Correlator for Pulse Contrast and Pulse Shape Measurements by J. Collier and others. Printedpp194–195, Description/Figure2 and Results/Figure4
An independent ideal calculation explains both the asymmetry and a possible third-order pulse correlation ghost. Let represent two identical-shape pulses with well-separated supports and correlation lobes, with the second weaker and delayed. Squaring introduces no overlap term. If , expansion givesThe delayed replica produces a lobe of relative order , while the opposite-delay ghost has order . For , the scales are about and respectively. These values are predictions of the stated ideal model. Assigning every small correlation feature directly to a separate input pulse would miss this distinction.
A nondetection below the measurement floor establishes a bound under a detection model, rather than demonstrating that no light exists there. Finite dynamic range, detector baseline subtraction, delay coverage and resolution should accompany a reported contrast trace. The Sequoia manufacturer likewise distinguishes optical temporal resolution from the scan step; making that step smaller does not alone narrow the optical response.[ref]
Sequoia temporal contrast measurement by Amplitude. January2024 sheet, PDFp2, Specifications
Optical contrast in decibels expresses a specified ratio logarithmically. For peak-to-local radiant power contrast ,The inverse convention gives . State the convention and the time of the weak feature. A peak-to-feature contrast means one million to one in power, not in field amplitude.
An original readout example uses a linear photodetector whose baseline-corrected output is proportional to optical power. A main reading of and weak-feature reading of imply and . Applying to those readings would incorrectly report : the electrical signal represents power, not optical wave amplitude.
If instead a measurement is proportional to an optical field amplitude , with the same impedance and spatial normalization for both fields, power is proportional to . ThenA field-amplitude ratio of and a power ratio of therefore express the same contrast. The correct multiplier follows the measurement model, not whether the readout unit happens to be volts.
Contrast does not specify pedestal energy fraction, optical prepulse duration or delay coverage. The Sequoia primary sheet specifies dynamic range, scan range and optical temporal resolution separately.[ref]
Sequoia temporal contrast measurement by Amplitude. January2024 technical sheet, PDFp2, Specifications
A signal beneath a known measurement floor supports a contrast bound within that window; subtracting an uncertain background does not establish unlimited contrast. Articles by others on the same topic
There are currently no matching articles.