The phase diagram must contain three coexistence curves meeting at the triple point: a solid-gas sublimation curve, a solid-liquid melting curve and a liquid-gas vaporization curve. The vaporization curve ends at a liquid-gas critical point; beyond it liquid and gas are continuously connected as a supercritical fluid.
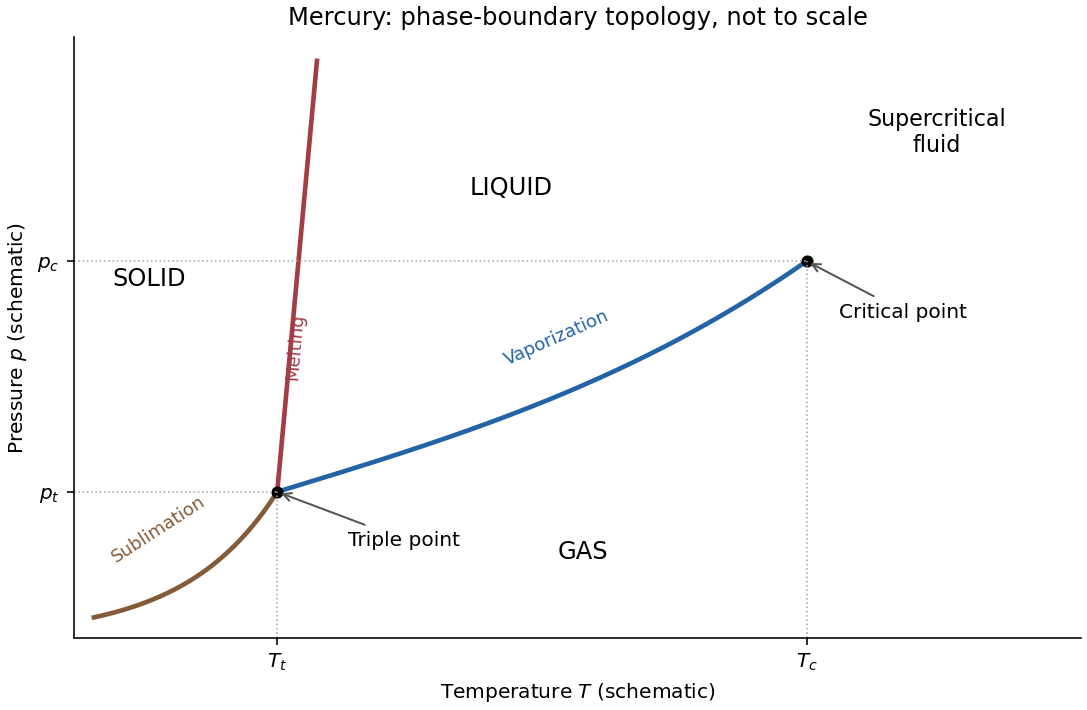

The imposed contraction on freezing means . Melting therefore has and . The Clapeyron equation then requiresThus raising the pressure raises the melting temperature. The liquid-gas and solid-gas slopes are also positive because the transformations into gas increase both entropy and volume. The liquid region lies between the positively sloping melting line and the vaporization curve, while gas occupies the low-pressure side. The figure is a qualitative solution sketch, not a reproduction or fit of the paper's vapor-pressure measurements; its axes are schematic.
Articles by others on the same topic
There are currently no matching articles.