A phase diagram partitions a space of thermodynamic variables into regions occupied by different equilibrium thermodynamic phases and records the phase coexistence curves between them. For a pure, one-component substance, a pressure–temperature phase diagram gives one point for each pair . In a single-thermodynamic phase region both controls can vary independently. On a two-thermodynamic phase phase coexistence curve, they obey one relation; at a triple point, both are fixed. These statements assume bulk thermodynamic equilibrium, fixed composition and no additional applied fields.[ref]
Gibbs Phase Rule (MIT 10.213 course material). Gibbs Phase Rule, single-, two- and three-phase counts and final pressure–temperature diagram paragraphs
At fixed temperature and pressure, the stable bulk thermodynamic phase minimizes Gibbs free energy for a fixed amount of substance. For a pure substance this is a comparison of chemical potentials on a common normalization. Two candidate thermodynamic phases coexist where and neither is exceeded in stability by a third thermodynamic phase. Differentiating their equality gives the Clapeyron equation. Thus a phase coexistence curve is a locus of equal stability, rather than a trajectory that every heated sample must follow.[ref]
The following original cartoon uses dimensionless positive coordinates and , with arbitrary reference scales . It represents no particular substance and contains no measured data. Stipulate a triple point at , a liquid-gas critical point at , and these drawing rules:They specify sublimation, liquid–gas phase coexistence and melting boundaries for the picture. They are not an equation of state, do not predict latent heat or mass density, and do not supply a quantitative critical theory. In particular, the melting slope is merely an illustrative choice.
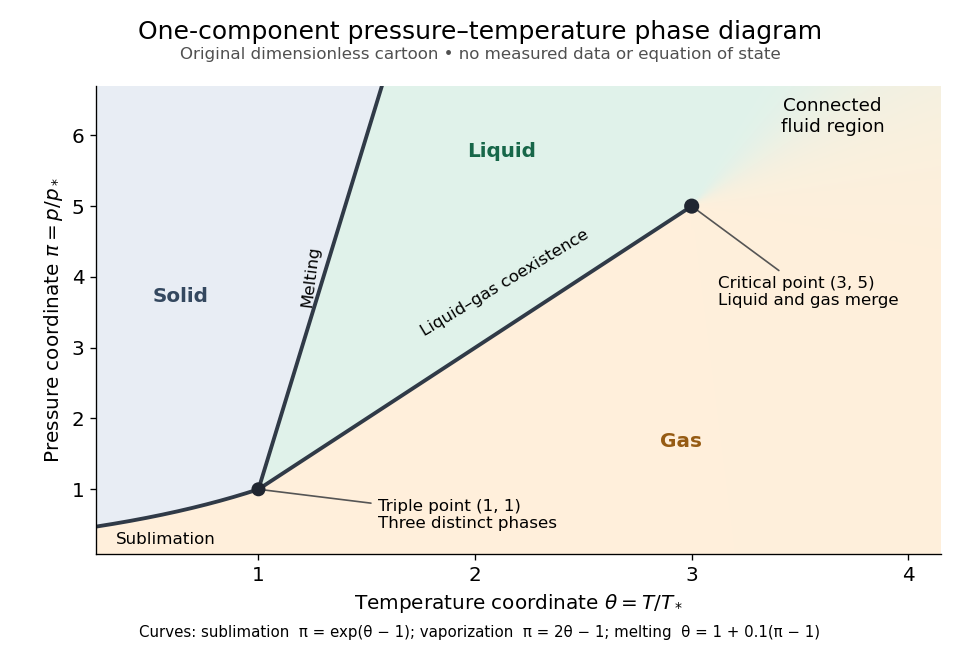
Generic dimensionless pressure–temperature phase diagram: curves, triple point and liquid-gas critical point
. Original cartoon with stipulated drawing rules. Three distinct bulk thermodynamic phases coexist at ; the liquid–gas boundary ends at . The fluid region beyond that endpoint is connected: no extra boundary is implied by the fading background. These coordinates are not water data. Details.For example, at fixed the melting boundary is at and the liquid–gas boundary is at . Heating from to therefore starts in liquid, crosses phase coexistence at , and ends in gas. In an equilibrium conversion at that crossing, added heat can change the phase fraction at fixed temperature through latent heat. The pressure–temperature point alone does not specify how much of each thermodynamic phase is present: for that one needs an additional amount or volume constraint.
Now connect exactly the same endpoints by raising from to at , moving to at , then lowering to . The first leg stays on the liquid side because ranges only from to and . The second leg lies above the entire liquid–gas boundary, whose largest drawn pressure coordinate is ; the third lies beyond its largest temperature coordinate, . No leg crosses a first-order phase transition boundary. The middle leg passes through a supercritical fluid region, with and , and the final leg returns to a gaslike state continuously.
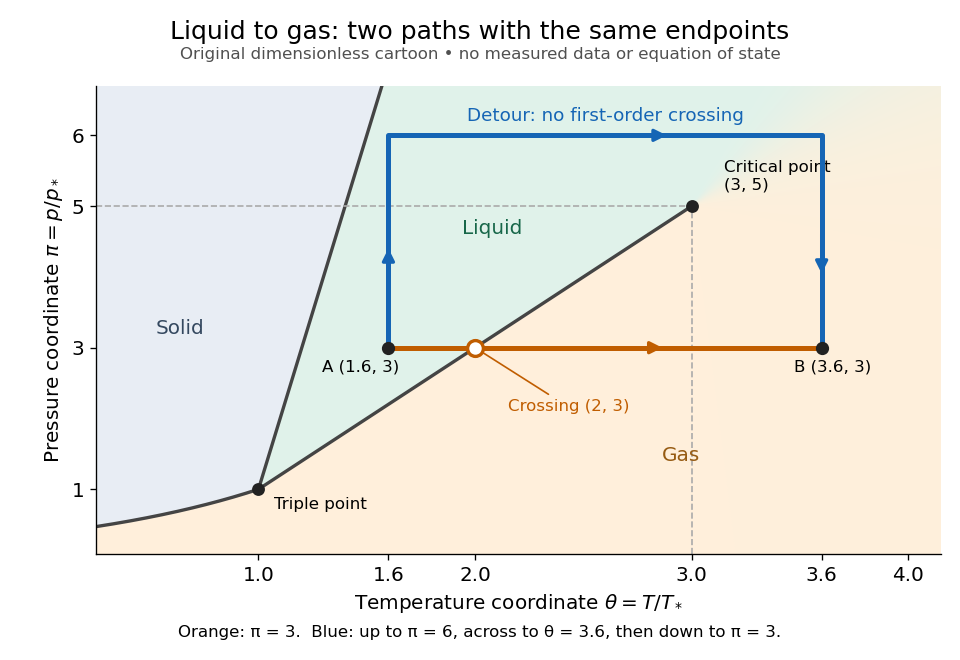
The same liquid and gas endpoints: crossing phase coexistence or going around the liquid-gas critical point
. Original dimensionless cartoon. The orange constant-pressure path crosses the liquid–gas boundary at . The blue path follows to to to and avoids every drawn phase coexistence curve. Dashed coordinate guides locate the critical endpoint without representing additional boundaries. Details.Avoiding a first-order phase transition does not mean that no heat or work is exchanged. Along the detour, mass density, enthalpy and heat capacity may change substantially but continuously. The liquid-gas critical point itself has singular behavior, so the detour goes around it rather than through it. This connected fluid region is the striking lesson of a phase diagram: a familiar change from liquid to gas need not involve boiling across a sharp boundary.
An equilibrium phase diagram also does not predict how rapidly a conversion occurs. Metastability and a barrier described by classical nucleation theory can delay the observed phase transition. Nor should a binary-composition phase diagram be read as the same picture: its coexistence regions and lever rule encode composition and phase fractions, and can occupy an area even though pure-substance two-thermodynamic phase coexistence occupies a curve in the pressure–temperature plane.
The phase rule counts independent intensive controls compatible with coexistence of distinct bulk thermodynamic phases made from independent components:Here counts thermodynamic phases, not pressure, and does not count phase fractions. For the nonreacting one-component case, and : a single thermodynamic phase occupies a region with , two-thermodynamic phase coexistence a curve with , and a triple point an isolated point with . Fixing pressure externally removes one adjustable control wherever that constraint is independent.[ref]
Gibbs Phase Rule (MIT 10.213 course material). Gibbs Phase Rule, displayed nonreacting rule and pure-substance table
For an elementary count without chemical reactions, take chemical species. Each thermodynamic phase has independent composition fractions, since they sum to one. Shared temperature and pressure add two controls, giving . Equality of each species' chemical potential between one reference thermodynamic phase and the other thermodynamic phases supplies constraints. Subtraction gives . This argument assumes the constraints are independent and treats interfaces as negligible; chemical reactions, external fields or critical mergers require appropriate qualifications.
The solidus bounds the entirely solid equilibrium region of a phase diagram. For a linear liquidus and a constant segregation coefficient , the corresponding solidus is . The concentration argument is the solid concentration, not the neighboring liquid concentration.
The lever rule finds phase fractions from a horizontal tie line on a phase diagram. For solid and liquid concentrations and bulk concentration , conservation gives . Thus is the liquid fraction, provided . For pure solid, .
A bicritical point is where two continuous transition lines and a first-order line meet, typically separating a disordered phase from two competing ordered phases.
The liquidus is the locus in a phase diagram above which the equilibrium state is entirely liquid. In a dilute binary solution it is often approximated locally by a linear relation such as .
Freezing-point depression is the lowering of a solvent's equilibrium freezing temperature by dissolved solute. In the linear dilute approximation, with .
An eutectic system has a composition and temperature at which a liquid is in equilibrium with two distinct solid phases. Cooling liquid of that composition through the eutectic temperature produces both solid phases together.
The eutectic composition is the liquid concentration at the eutectic temperature, where liquid and two solid phases coexist. It is a composition coordinate on a phase diagram, not the overall concentration of every sample in an eutectic system.
The eutectic temperature is the temperature of simultaneous liquid–two-solid phase coexistence in an eutectic system. In directional freezing of a solution away from the eutectic composition, a mushy layer can end at this temperature, where its remaining liquid solidifies.
Articles by others on the same topic

A phase diagram is a graphical representation that shows the phases of a substance (solid, liquid, gas) as a function of temperature and pressure. It illustrates the conditions under which distinct phases occur and coexist in thermodynamic equilibrium. Key features of a typical phase diagram include: 1. **Axes**: The horizontal axis usually represents temperature, while the vertical axis represents pressure. 2. **Phase Regions**: Different areas or regions on the diagram represent different states of matter.