The relation describes the slope of the phase coexistence curve of a pure substance in the pressure-temperature plane:Here is the common equilibrium pressure of the two phases, is their common absolute temperature in kelvins, and the derivative is taken along their coexistence curve. Choose a direction of transformation from phase 1 to phase 2. Then is the reversible latent heat for that transformation and is the corresponding volume change, using the same amount of substance for both quantities.
In the molar convention used below, has units and has units , so the right-hand side has units . For vaporization, both and are positive. The displayed general relation is also called the Clapeyron equation; the ideal-vapor approximation used in (c) gives its usual Clausius form.
At coexistence, the two phases of a pure substance have equal chemical potential, or equivalently equal molar Gibbs free energy:For either phase, . Move an infinitesimal distance along the coexistence curve, where the equality must remain true. Subtracting the two differentials givesA reversible transformation at this common temperature absorbs latent heat . ThusThe derivation assumes thermodynamic equilibrium between two bulk phases of a single pure substance, with the same temperature and pressure, and only ordinary pressure-volume work. Surface-curvature shifts, additional external-field work and composition changes are omitted. It applies to a first-order phase boundary where the latent heat and volume discontinuity are defined. No ideal-gas assumption and no constant- assumption are needed for this differential relation. At the critical endpoint both discontinuities vanish, so their ratio requires a limiting treatment rather than direct substitution of two zeros.
For liquid-vapor equilibrium, use molar quantities. At low vapor pressure the gas is dilute, approximately ideal, and has a much larger molar volume than the liquid. HenceSubstitution into the Clapeyron equation givesIf the molar latent heat varies sufficiently slowly to be treated as constant over the temperature interval, integration givesThe positive constant has pressure units and is an integration constant. It is not necessarily a real infinite-temperature pressure, since the approximations fail before that limit.
For mercury between and , the original plot places this range above the triple point and below the normal boiling and critical temperatures. Its vapor pressure is low relative to the critical pressure, making a dilute-gas description reasonable; the vapor's molar volume greatly exceeds that of the dense liquid. The interval is also far from the critical region where tends to zero, so a roughly constant latent heat is a useful first approximation. The approximations are not exact: Kirchhoff's law of thermochemistry gives, at fixed pressure, the temperature derivative of a transformation enthalpy as the difference between the two molar heat capacities, so a precise fit over a wide interval would allow to vary.
Taking a derivative of the logarithmic form gives a direct way to use the plot's base-ten vertical axis:Alternatively, use two nearby readings and eliminate the unknown :Reading the original PDF graph approximately gives at and at . These bracket the requested temperature and give an average latent heat near :Thus a suitable graph-based estimate isThe graph does not warrant several significant figures; a local tangent or different reasonable nearby readings give a comparable estimate. The factor is essential when using a base-ten logarithmic axis.
The phase diagram must contain three coexistence curves meeting at the triple point: a solid-gas sublimation curve, a solid-liquid melting curve and a liquid-gas vaporization curve. The vaporization curve ends at a liquid-gas critical point; beyond it liquid and gas are continuously connected as a supercritical fluid.
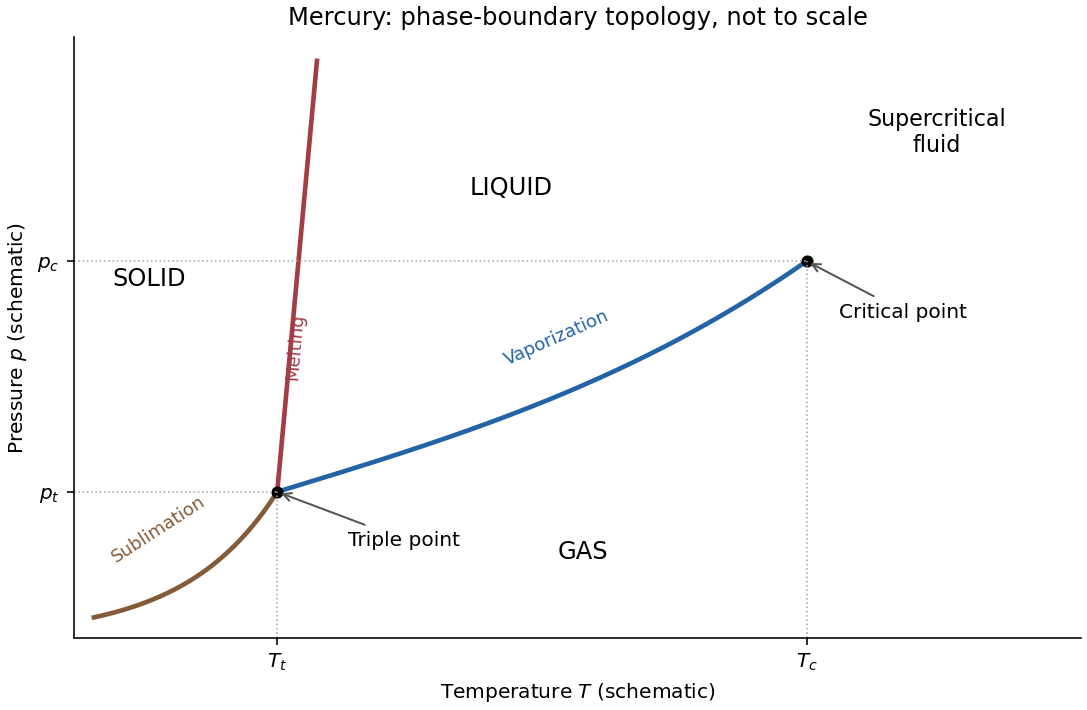

The imposed contraction on freezing means . Melting therefore has and . The Clapeyron equation then requiresThus raising the pressure raises the melting temperature. The liquid-gas and solid-gas slopes are also positive because the transformations into gas increase both entropy and volume. The liquid region lies between the positively sloping melting line and the vaporization curve, while gas occupies the low-pressure side. The figure is a qualitative solution sketch, not a reproduction or fit of the paper's vapor-pressure measurements; its axes are schematic.
Articles by others on the same topic
There are currently no matching articles.