Polydispersity means that a sample contains chains of different molar masses or lengths. Let count chains with molar mass . The number-average molar mass gives every chain equal weight, while the weight-average molar mass weights a chain population by its contribution to total mass:Writing makes the latter interpretation explicit: . Large chains therefore influence more strongly. If brackets denote an average over chain number,The ratio is molar-mass dispersity, conventionally written Đ. It equals one only when every chain has the same molar mass. Different distributions can share the same ratio, so it does not specify the full distribution.
For a freely jointed chain, write the end-to-end vector as the sum of independently oriented steps , each of fixed length . Isotropy gives , and independence gives for . HenceThe root-mean-square end-to-end distance of a polymer chain is , although the mean vector is zero. Its polymer contour length is , an upper bound on extension; it is not the typical unforced end-to-end length.
Stiffness correlates neighboring bond directions, so the discarded cross terms need not vanish. A freely rotating chain fixes the angle between successive forward bond vectors but leaves torsion uniformly distributed. Set , so . ThenFor a chain long compared with its orientational correlation range, the characteristic ratio of a freely rotating chain approaches . Positive forward persistence increases the mean-square size and gives the Kuhn length of a freely rotating chain . A chemical internal bond angle is supplementary to the forward-vector angle used here, so substituting that internal angle requires . For at fixed , the finite sum tends to , the rigid-rod result; taking the long-chain limit first would incorrectly predict an unbounded size. Real torsional energy preferences can be represented by a rotational isomeric state model, with weighted torsional states and correlations beyond independent free rotations.
A worm-like chain describes continuously varying local orientation. For unit tangent and bending stiffness , its elastic energy is . In three spatial dimensions the persistence length is andSince , integrating the tangent correlation gives the end-to-end distance of a worm-like chain:For , expansion gives , approaching a straight rod. For , it gives , the long-chain ideal chain result with Kuhn length . These models isolate stiffness; long-range excluded volume can additionally swell an isolated chain in a good solvent. When coarse-graining, a chemical repeat count and a count of independent statistical steps must not be silently interchanged.
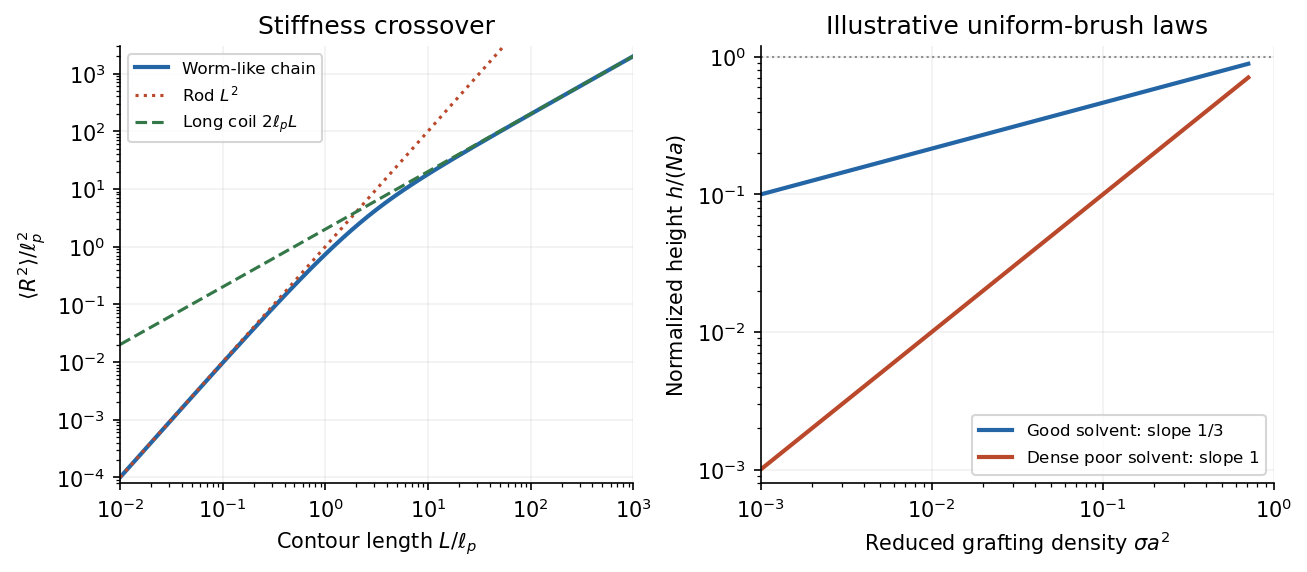
Stiff-chain crossover and distinct polymer brush density scalings
. Details. 
The first panel shows the exact worm-like chain crossover between a rod and a long flexible coil. The second compares original normalized scaling curves for a uniform polymer brush; their prefactors have been chosen for illustration and do not fit the exam's experimental points.
For a good solvent, consider long flexible grafted polymer chains with grafting density and lateral spacing . At high coverage, is smaller than the isolated coil size, and adjacent chains cannot retain their unperturbed conformations. A scaling model divides each chain into concentration blobs of diameter . Inside one blob the chain retains good-solvent statistics,using the Flory approximation exponent . The blobs per chain form a stretched sequence approximately normal to the surface. The good-solvent brush height therefore obeysHere and refer to consistently chosen effective segments, whose microscopic properties are held fixed as chain length changes. The result is a scaling law with an undetermined order-one prefactor, not a fully specified height in nanometres.
A complementary free-energy balance per chain iswhere is effective segment excluded volume. The first term is the chain entropy cost of stretching and the second is the cost of crowding segments into a layer of volume per chain. Minimization gives ; with it recovers the same height. The blob argument incorporates good-solvent correlations more directly. Both descriptions require overlapping chains, many segments per chain, and heights below the polymer contour length; the power law cannot be extrapolated to infinite grafting density.
In the printed experimental graph, the vertical axis is and the horizontal axis is . The approximately straight trend through the origin therefore means . Since and is proportional to chain length for a fixed repeat chemistry,The dashed guide rises by roughly – vertical units over six horizontal units, corresponding to of order per unit of the plotted . This is an approximate graphical slope, not a fitted material constant; the graph does not specify a numerical monomer count or a repeat-unit volume from which an absolute brush height could independently be calculated.
The poor-solvent brush height has a simple volume argument. Let be the volume per repeat and the roughly fixed polymer volume fraction within a dense uniform layer. There are repeats per substrate area, soFor fixed poor-solvent conditions, is approximately independent of and , giving the observed linear grafting-density dependence. Polymer–polymer contacts are favored and the layer becomes relatively compact; in a good solvent, favorable solvent contact and segment repulsion instead produce a swollen layer whose stretching and osmotic costs balance at the weaker dependence. Sparse isolated polymer globules or lateral segregation fall outside the uniform-brush model.
The cited experimental paper's abstract independently reports these two scaling laws, but identifies polydimethylsiloxane chains on porous silicon dioxide, rather than the polystyrene system named in the exam. The solution uses the printed axes to infer the exponents and does not treat that material identification as verified experimental provenance.[ref]
Characterization of the brush regime for grafted polymer layers at the solid-liquid interface by P. Auroy and others. Physical Review Letters 66 (1991), 719–722, abstract: neutron-scattering measurement, chemical system, and good- versus poor-solvent thickness scaling
Articles by others on the same topic
There are currently no matching articles.