
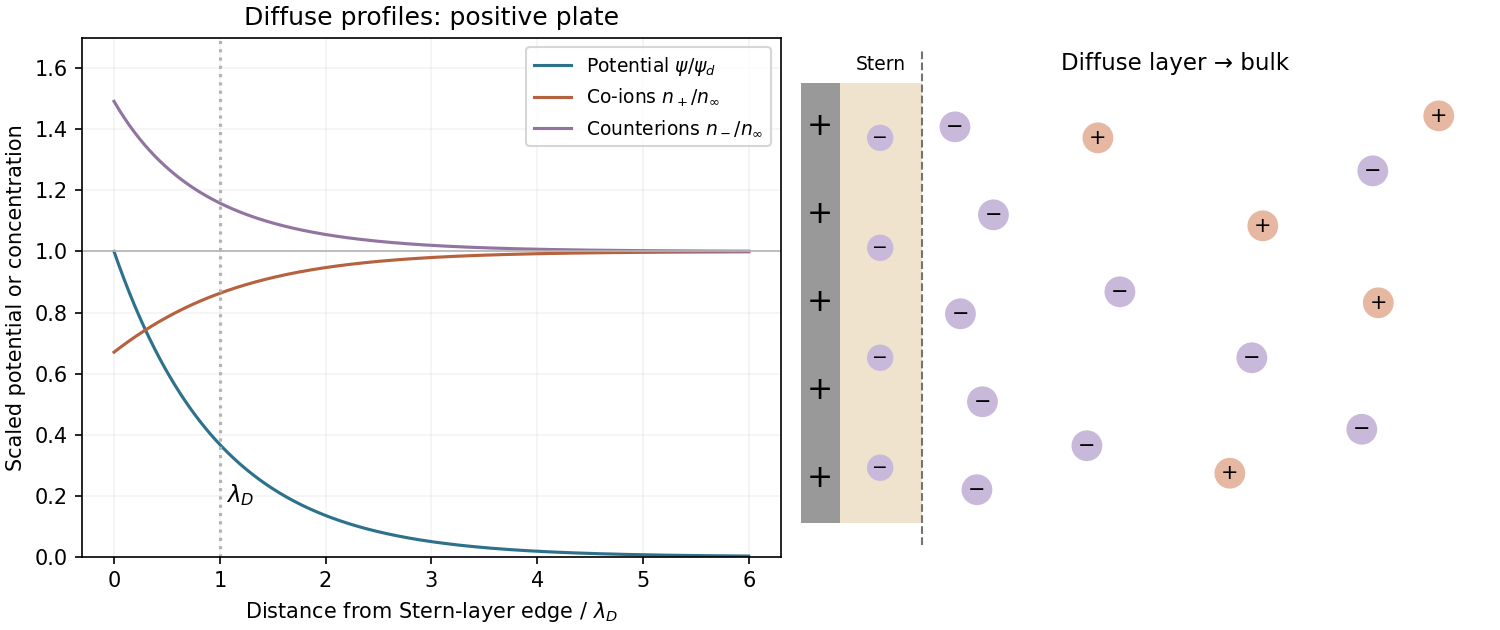
Choose a positively charged plate to match the question's labels for co-ions and for counterions. Let denote the outer edge of its compact Stern layer, and set the bulk potential to zero.
In the weak-potential Debye–Hückel approximation, the diffuse-layer potential isThe key length is the Debye–Hückel screening length. For a symmetric monovalent electrolyte, the Boltzmann distribution givesPositive co-ions are depleted near the positive plate, while negative counterions accumulate. Both approach the same bulk density as the potential decays. Attraction and repulsion by the surface compete with mixing entropy, so diffuse ions do not simply collapse into one plane. The compact Stern layer represents finite closest approach and specifically associated charge; the diffuse continuum begins outside it. For large potentials the linear exponential potential needs the nonlinear Poisson-Boltzmann equation, though the far-field screening scale remains the same in this simple electrolyte.
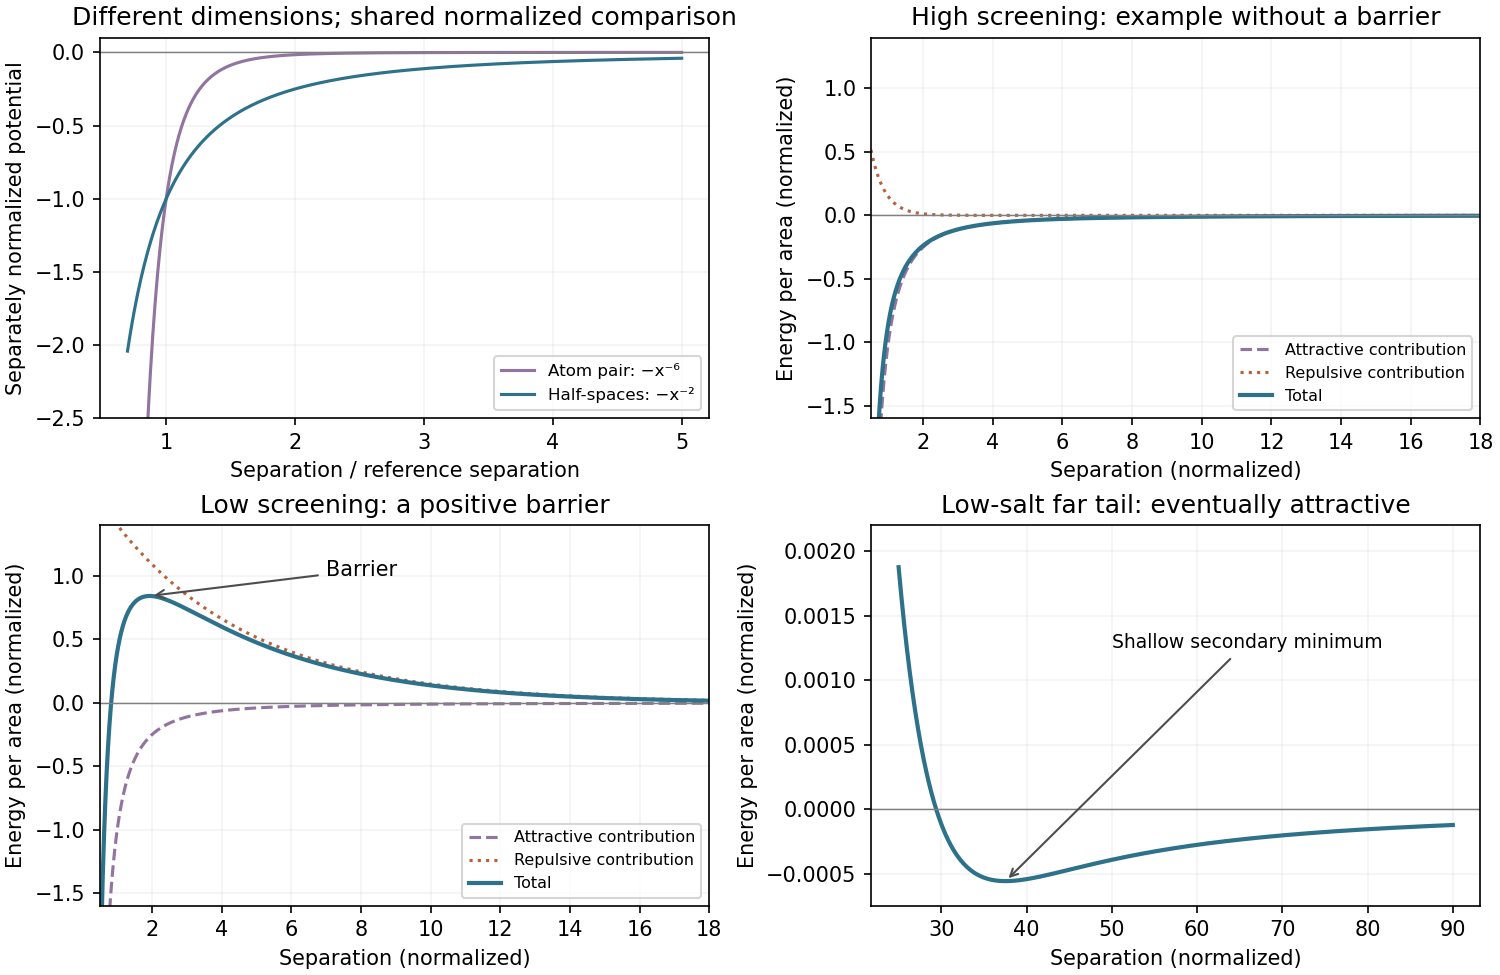
The microscopic pair potential falls as , whereas integrating over two half-spaces gives an interaction energy per area . The plate attraction therefore decays much more slowly with distance because many pairs contribute. The quantities have different dimensions, so the shared sketch uses separately normalized energies at a reference separation rather than pretending that joules and joules per square metre are directly comparable.
The attractive pressure isAt and the supplied effective ,The minus sign denotes decreasing separation. A total force cannot be calculated without the interacting area: for area in square metres, . This uses the supplied nonretarded half-space model; finite film thickness, geometry and retardation at larger distances can change it.
and count the microscopic interacting units in bodies 1 and 2. Their positions are and ; the difference vector gives their pair separation. The positive coefficient specifies an attractive nonretarded pair energy and has units .
Hamaker summation approximates a macroscopic interaction from Van der Waals forces by adding these microscopic pair energies. For homogeneous continua, sums are replaced by integrals over the two body volumes with number densities and . Integrating the geometry changes the distance dependence and produces a Hamaker constant for the stated simple model.
The approximation assumes pairwise additivity, uniform material properties, a known geometry and a separation large enough to use a continuum but small enough for the chosen nonretarded interaction law. It neglects many-body electrodynamic screening, chemical bonding, atomic roughness and short-range repulsion. A medium changes the effective interaction strength; an effective measured across water need not equal a vacuum value inferred from isolated atom pairs.
One consistent five-postulate formulation is the following; different textbooks group the same content differently.
- State. A pure state is a normalized vector in a complex Hilbert space, with ; vectors differing only by an overall phase represent the same state. For a spinless particle in position representation, is its wavefunction.
- Observables. A physical observable A is represented by a self-adjoint operator . In a Cartesian position representation, and , with .
- Outcomes and probabilities. Allowed ideal measurement outcomes are spectral values of . The Born rule gives , where projects onto the corresponding eigenspace; continuous spectra require the analogous spectral probability measure. The expectation is .
- Ideal measurement update. Conditional on a nonzero-probability outcome , an ideal projective measurement leaves . For a nondegenerate result this is its eigenstate. This is the ideal projection rule, not a description of every general measurement apparatus.
- Time evolution. Between measurements a closed system evolves by the Schrödinger equation, , with Hamiltonian . For time-independent , this gives unitary evolution .
The position-dependent probability density is , and its flux is the probability current. These distinguish the wave amplitude from the measurable particle flow in the following scattering problem.
A c-axis wurtzite ZnO wire has crystallographically polar basal ends, conventionally Zn-terminated and O-terminated , and approximately nonpolar prismatic side facets such as . Crystallographic polarity is not identical to net surface charge in a growth solution: protonation, adsorbates and ionic speciation can change the latter.
For face-selective electrostatic growth inhibition, an oppositely charged additive adsorbs preferentially to a particular face and obstructs incorporation there. Blocking the axial end lowers axial growth relative to radial growth and yields a smaller aspect ratio; blocking sidewalls suppresses radial growth and favours long thin wires.
A primary hydrothermal experiment at pH 11 found negatively charged basal top surfaces and positively charged sidewalls. Positively charged Cd-containing complexes inhibited the top and favoured platelets; negatively charged Al-containing complexes inhibited sidewalls and favoured large aspect ratios. These signs are condition-specific, not fixed by the formal Zn/O termination alone.[ref]
Face-selective electrostatic control of hydrothermal zinc oxide nanowire synthesis by Jaebum Joo and others. 2011, Fig. 1 and pH-dependent complex-ion and surface-charge discussion
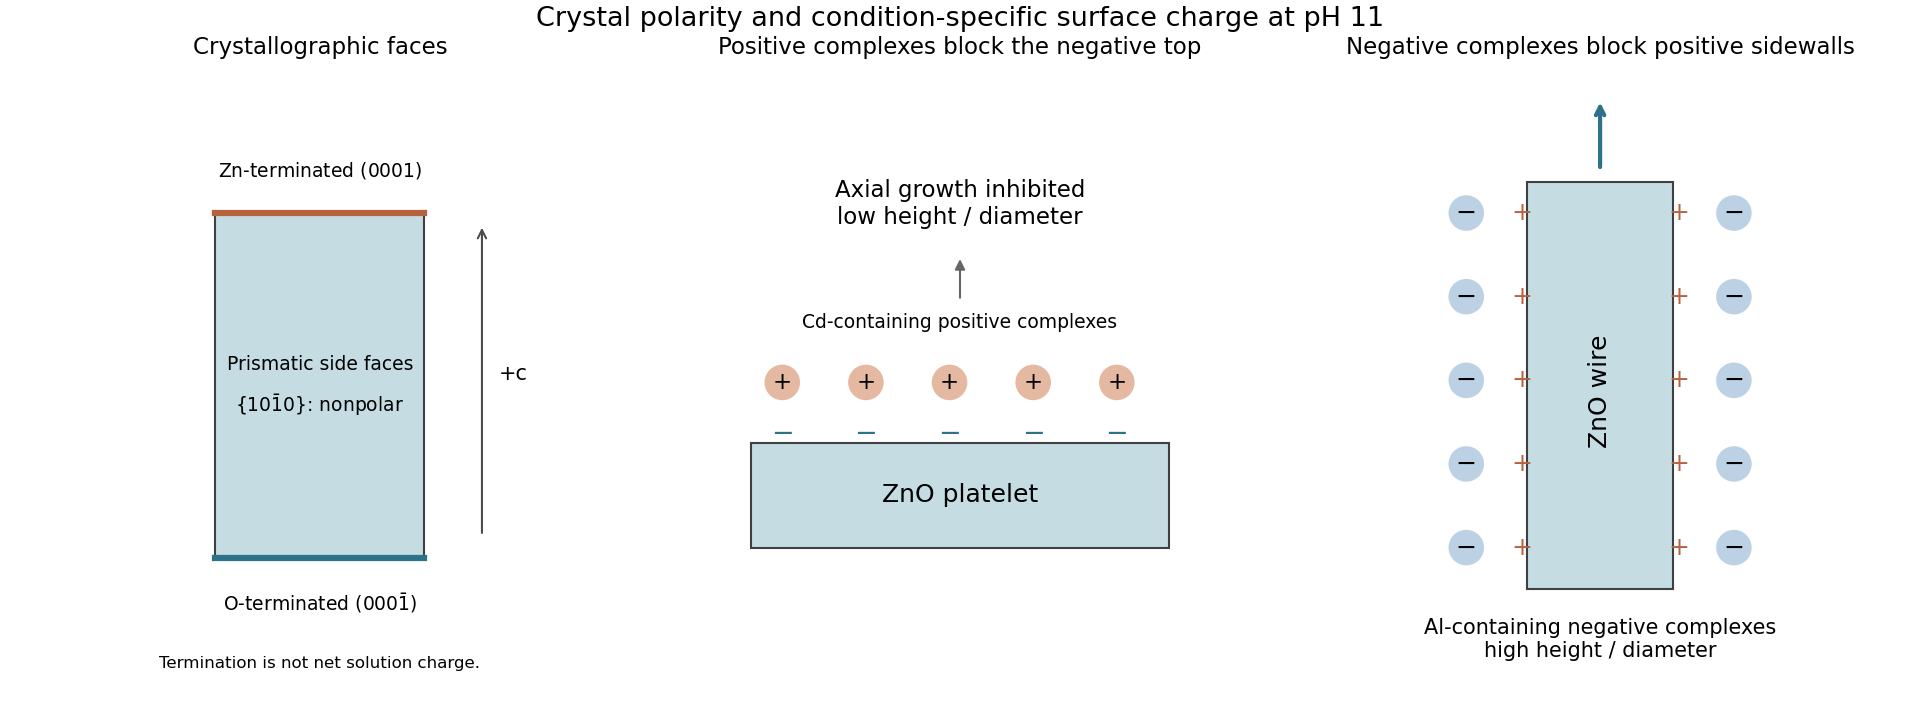
Facet-selective adsorption changes axial and radial ZnO growth
. Original facet-termination diagram and schematic of the cited pH-11 effective surface-charge example. The signs in the adsorption panels denote solution-condition-dependent surface charge, not a universal assignment of charge to crystallographic facets. Details.Cooling changes the catalyst state that is being measured. Crossing Au–Ga phase boundaries can cause solidification, segregation and intermetallic formation. Solubility changes can expel Ga or precipitate additional GaAs after the intended growth interval. The droplet contact angle and interfacial shape also change as temperature and composition change.
A cooled catalyst–wire interface can consequently have a different composition, phase assemblage, geometry and even last-grown crystal segment from the active growth interface. Continued precursor supply during cooling can add another uncontrolled history. An ex situ observation of a solid catalyst does not prove that growth occurred by a solid-catalyst mechanism, and its final geometry cannot simply be substituted into a nucleation model for the liquid growth stage.
Use in situ microscopy, diffraction or spectroscopy under representative growth conditions, or compare controlled interruption and quench protocols. Quenching reduces some rearrangement but does not guarantee a perfectly frozen interface. The Au-catalysed GaAs composition experiment provides a direct example of measuring catalyst state during growth instead of inferring it from the cooled residue.[ref]
In situ analysis of catalyst composition during gold catalyzed GaAs nanowire growth by Carina B. Maliakkal and others. 2019, motivation for and implementation of in situ catalyst analysis
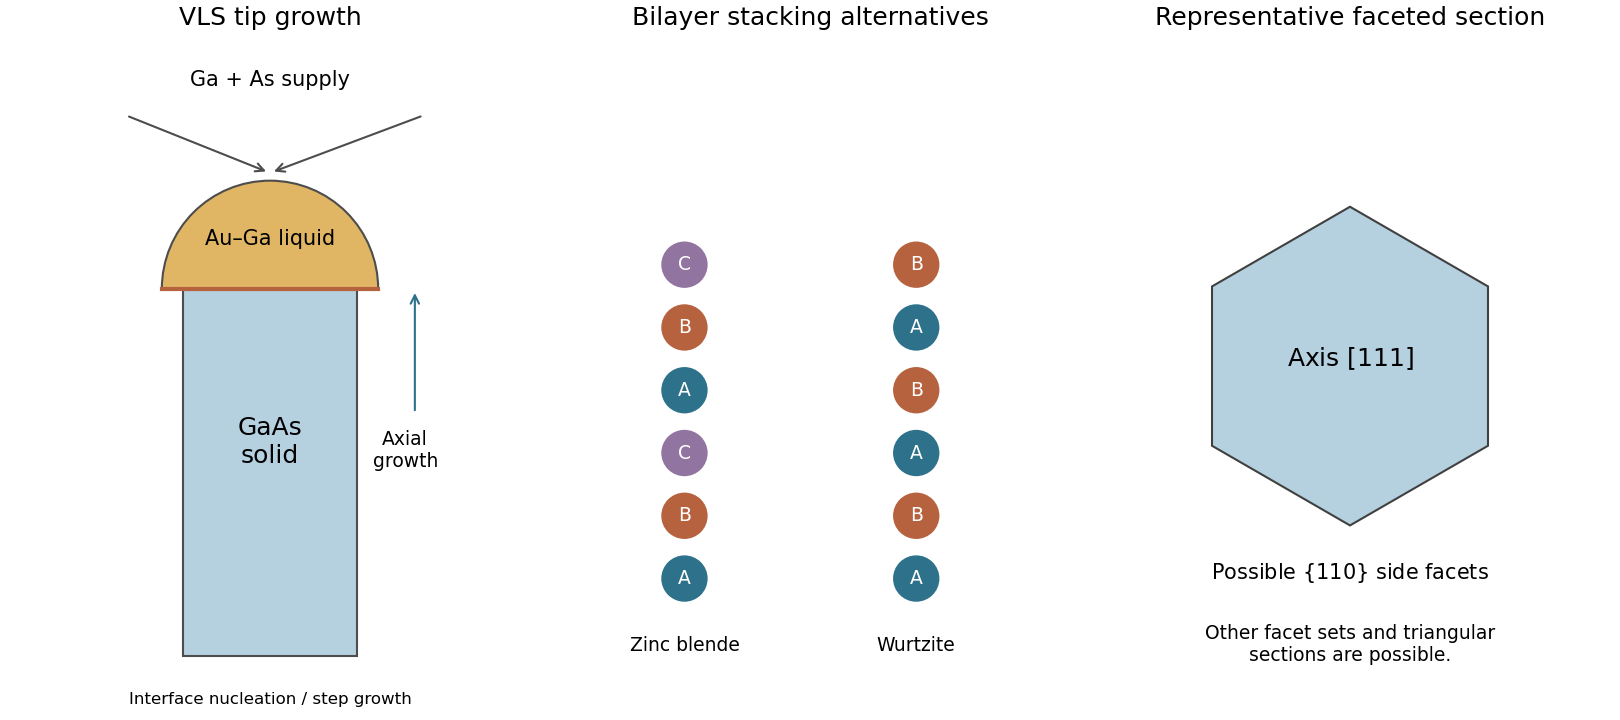
For the common -axis zinc-blende GaAs wire, a representative cross-section is a faceted hexagon with low-index sidewalls, often described by -type facets. The threefold crystallographic symmetry of a polar direction can make alternate facets inequivalent, so triangular or truncated-triangular sections are also possible. The zinc-blende label alone does not fix a unique hexagon: growth direction, termination, twins, surface chemistry and kinetic facet selection also matter.
The accompanying sketch shows a representative faceted section rather than a circular cylinder. Facets that advance slowly in their normal direction tend to remain exposed, so a kinetic growth shape need not be an equilibrium Wulff shape.
A simple cause of tapering is continued radial vapor–solid growth on sidewalls while the tip grows axially. A lower wire segment has been exposed to precursors for longer than a segment formed near the end of growth. For a roughly constant radial growth speed , its radius gains about , giving a larger base. Substrate-fed species, changing catalyst size and droplet wetting can also contribute. Tapering is not proof that the original VLS droplet was wider at every earlier stage.
Zinc blende and wurtzite differ in their stacking of tetrahedrally bonded bilayers: an ideal cubic sequence is ABCABC, while the hexagonal sequence is ABAB. During vapor–liquid–solid growth, each new interfacial nucleus can choose between continuing the existing sequence and changing it.
The selected phase can be the one with the smaller nucleation barrier, rather than the lower bulk free energy alone. A nucleus at the droplet–wire–vapour triple line has edge and interfacial energies different from a nucleus fully inside the liquid–solid interface. Schematically, its free energy combines a favourable chemical-potential term with new edge/interface costs and, when appropriate, a stacking penalty. Supersaturation changes the relative importance of these terms; the droplet shape and contact angle change which nucleation sites are available.
Control is therefore possible through temperature, III/V supply ratio, precursor fluxes, catalyst composition, droplet volume/contact angle and wire diameter. Monitoring growth rather than only inspecting cooled specimens helps determine which parameter actually changes the interface. A nucleation model for Au-catalysed III–V wires explicitly showed how triple-line nucleation can favour wurtzite under suitable interface energies and supersaturation.[ref]
Why does wurtzite form in nanowires of III-V zinc blende semiconductors by Frank Glas and others. 2007, competing phase nucleation at the triple line
There is no universal rule that one phase always corresponds to the larger temperature or smaller diameter regardless of catalyst and interface geometry.An Au-containing seed absorbs gallium and forms a liquid Au–Ga alloy under the selected growth conditions. The supplied binary diagram indicates which temperature and Ga fraction lie in the liquid field; alloying allows a liquid catalyst at temperatures far below the melting point of pure Au. Vapour precursors supply Ga and As, which enter or react through the droplet and precipitate GaAs at the liquid–solid interface when the growth chemical potentials make incorporation favourable.
The droplet remains near the wire tip as interface nucleation and step propagation extend the nanowire. Its footprint helps select the wire diameter, though sidewall growth can change the final profile. The catalyst is a reservoir and reaction interface, not a stoichiometric constituent consumed once per GaAs unit.
Low As concentration makes the Au–Ga diagram a useful first approximation to catalyst state, but does not mean that arsenic supply or chemical potential is irrelevant. A binary phase diagram alone cannot calculate supersaturation with respect to ternary GaAs formation, and nanoscale interfacial energies can shift phase boundaries. In situ composition measurements have directly distinguished substantial Ga content from the very small As content of Au-seeded catalyst droplets.[ref]
In situ analysis of catalyst composition during gold catalyzed GaAs nanowire growth by Carina B. Maliakkal and others. 2019, catalyst spectroscopy and comparison with Au–Ga–As phase calculations


There are unlisted articles, also show them or only show them.