
In evaporative deposition, atoms travel mainly along straight trajectories from a compact source. For an ideal cosine-emitting source below a parallel wafer, a point at lateral radius and source separation receives approximatelyConsequently . Increasing makes arrival angles and distances more similar across a fixed wafer, improving uniformity. But the central flux falls as for a fixed source output, so the deposition rate decreases and less evaporated material is collected.
Rotation averages azimuthal variations, and source shaping or multiple sources can help, but simple rotation does not remove a radial flux gradient. Raising source output can partly compensate at the cost of source heating, consumption and possible material limitations. The trade-off follows from geometry rather than an intrinsic prohibition on simultaneously optimizing a more elaborate system.
At fixed reactant partial pressures and temperature, their ideal-gas bulk concentrations remain approximately fixed. Lowering total pressure means removing diluent rather than automatically lowering the reactant concentration.
In the continuum molecular-diffusion regime, gas diffusivities scale approximately as . Delivery through a comparable boundary layer is therefore faster, increasing relative to . The system tends toward reaction-limited operation, where concentration differences between substrate locations are smaller. This commonly improves thickness uniformity and access to recessed surfaces.
The qualification is important: changing pressure can also change flow velocity and the boundary layer, gas-phase chemistry and precursor depletion. In narrow structures at low pressure, Knudsen transport limits the simple improvement. Improved transport does not correct a large substrate-temperature gradient in a strongly temperature-sensitive reaction-limited process.
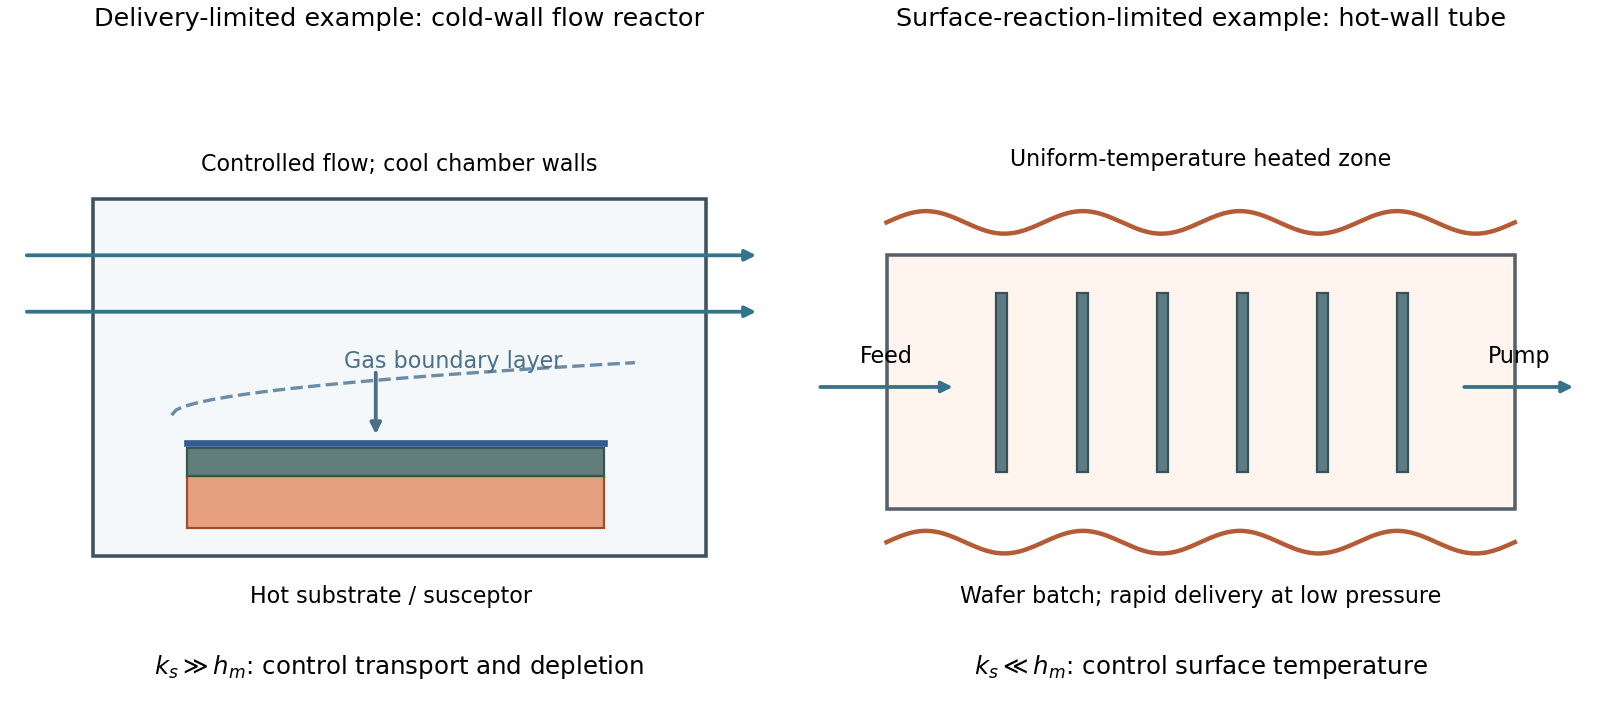
A simple chemical vapor deposition model separates transport through a gas boundary layer, with coefficient , from surface reaction, with coefficient :For , growth is mass-transfer-limited deposition. A typical cold-wall, flowing reactor heats the substrate strongly while keeping most chamber walls cooler. A shaped inlet, controlled flow and tilted or rotating susceptor help control boundary-layer thickness and precursor depletion. The essential design problem is delivering a similar flux everywhere; heating a surface still further gives little benefit once delivery limits growth.
For , growth is reaction-limited deposition. A hot-wall, low-pressure batch tube can hold many wafers in a nearly uniform-temperature zone. Faster gas transport makes surface concentrations more uniform, while slow chemistry reduces consumption before precursors reach downstream surfaces. Temperature uniformity is particularly important because surface rates can depend strongly on temperature.
These are illustrative architectures, not a rule that wall type alone determines the regime. Temperature, pressure, flow and precursor chemistry jointly set .

Depth of focus is the axial tolerance over which the projected pattern remains acceptable. Wafer topography, resist thickness, wafer tilt and focus-setting errors can move part of the film outside that range, reducing contrast and changing printed linewidth. Increasing numerical aperture can improve lateral resolution while reducing this axial process window.
Using the supplied coefficient in the conventional expression,This is the range assigned to DOF by that convention. Whether an instrument reports a full allowable interval or a one-sided defocus tolerance must be stated separately; an additional factor of two cannot be inferred from the numerical coefficient alone.
An on-axis point illuminator increases spatial coherence. It is not a point object, and it does not remove diffraction. For an ideal aberration-free pupil, coherent imaging is linear in field amplitude and has cutoffFor a real amplitude grating , with and all three field orders inside this pupil, the intensity contrast is . Flat coherent field transfer preserves this contrast; weak input modulation does not itself meet a high resist contrast threshold. Assume a sufficiently high-contrast amplitude mask: for example, gives , exceeding both resist thresholds. Under this assumption, both resists have the same limiting equal-line/space widthThis is an approach to the cutoff from below; finite dose latitude, aberrations and a real binary mask can make usable resolution worse. A general coherent intensity image cannot be obtained by applying an incoherent intensity MTF unchanged: , rather than .[ref]
Advanced Optical Imaging: Incoherent imaging by Delft University of Technology. coherent/incoherent comparison: field cutoff versus the twice-as-wide incoherent intensity cutoff
With , this coherent cutoff is : the low-contrast resist improves from roughly to , while the high-contrast resist worsens from roughly to . Coherence improves contrast within its passband but reduces the ultimate bandwidth relative to incoherent illumination.
With the literal Rayleigh-spacing normalization , the same physical cutoff is instead , not . The corresponding widths from the preceding part would improve from roughly and toward . The cutoff in physical units is unambiguous under the stated ideal on-axis model; the claimed direction and size of a change inferred from the plotted normalized axis depend on its definition. Off-axis illumination, partial coherence and arbitrary phase objects require a fuller imaging model.
For a positive photoresist, let be the largest dose retaining the nominal film and the clearing dose. With the conventional photoresist contrast definition,For a sinusoidal aerial image, the bright-to-dark dose ratio is , where is the Michelson contrast. A dose window that clears bright regions while retaining dark regions requiresThis assumes a fully modulated input pattern and that the plotted modulation transfer function gives the aerial-image contrast. It is a dose-window criterion, not a statement that the resist creates optical information absent from the image.[ref]
The two thresholds are approximatelyReading their intersections with the supplied curve gives, to graphical accuracy,for the lower- and higher-contrast resists respectively. These are the results independent of the dimensional frequency convention. Their minimum full periods are , and equal line/space widths are half those periods:An ArF excimer laser uses . A numerical length requires specifying what the caption's “Rayleigh limit” means. Taking it literally as the reciprocal of the Rayleigh criterion point separation givesIf instead the graph uses the common incoherent-cutoff normalization , the widths are and , with periods twice those values. The caption does not explicitly provide an equation for or define whether “feature size” means period or half-pitch, so these conventions must not be silently mixed. The higher-contrast resist resolves the higher normalized frequency in either convention.
An attached particle changes the effective tip shape, potentially creating a second contact apex. The image can then show duplicated or broadened copies of surface features, shifted edge positions and altered apparent roughness: a double-tip artefact or more general AFM tip-convolution artefact. Detachment can produce a sudden line-to-line change in that image kernel, so a region may abruptly recover a sharper profile. A change that follows the probe state or scan history should not be interpreted as a real reconstruction of the semiconductor surface.
A coarse fringe in a high-resolution transmission electron microscopy image need not directly identify the lattice spacing of a new phase. Check whether overlapping crystals, a particle and its substrate, or differently oriented domains can produce the corresponding moiré fringe. Compare the underlying reciprocal-space peaks and their difference, use the particle boundary to constrain how many periods are actually sampled, and examine neighbouring or differently oriented regions. For the closest pair here, fitting a periodicity from less than one complete period is particularly unreliable. Distinguishing lattice contrast from a beat envelope prevents misidentifying a phase or over-interpreting local strain.
For each spacing pair, the largest geometrical period occurs with parallel projected reciprocal vectors. The closest pair is and , givingHowever, the crystal is only across. It contains at most of this period, so the largest formal period cannot appear as a repeated fringe train inside one crystal. It can instead give a broad variation of contrast. A period of order the particle diameter is the largest directly sampled scale, and even that is poorly constrained by one particle.
The distinction matters if “see” means a complete repeat. Of the exactly parallel spacing pairs, the largest other period is approximately from the and pair. If relative rotation is continuously variable, the closest pair can instead be rotated slightly to shorten its period below , so is not a universal maximum visible period for arbitrary orientations.
Let the relevant projected reciprocal lattice vectors have magnitudes and , with angle between them. Subtracting their phases gives the slow spatial modulation . The moiré fringe spacing formula is thereforeFor parallel planes, and . For equal spacings, at a small angle measured in radians. The apparent divergence as both mismatch and rotation vanish means that there is no finite beat period; it does not predict an infinite number of visible fringes.
Moiré fringes arise when two overlapping periodic structures contribute closely spaced reciprocal lattice vectors to the transmission electron microscopy image. Their relative phase varies slowly across the image, producing a coarse modulation with a period much larger than either atomic spacing. The structures may have different lattice spacings, a small relative rotation, or both. The modulation is an interference or beat phenomenon; its spacing is not itself a new atomic-plane spacing. Its orientation is perpendicular to the difference vector of the two contributing projected reciprocal-lattice vectors.
For an ideal electrolyte with species number densities , valences , solvent permittivity and common temperature,Increasing salt concentration supplies more mobile charge to screen a surface perturbation, so a shorter distance is needed for the potential to decay. At fixed ion composition, permittivity and temperature, .
A fivefold concentration increase therefore givesEquivalently, the inverse screening length grows by . Changing ion valence changes the ionic-strength weighting as well, and highly concentrated electrolytes can depart from this dilute-solution screening model.
There are unlisted articles, also show them or only show them.