Here is the low-density per-generation multiplication factor and sets the inverse crowding scale. The positive fixed point is when ; its derivative lies strictly between minus one and one, so it is locally asymptotically stable. The map reaches its maximum at and decreases thereafter. Stability follows from the derivative, not from assuming that every overcompensating population map undergoes period doubling.
The Ricker population map models density-dependent reproduction with a declining per-capita growth factor. Its nonzero equilibrium is , with multiplier . It loses stability through a period-doubling bifurcation at . Every population after the first update is bounded by , the maximum of the update function on nonnegative populations.
Population dynamics studies changes in the abundance and composition of a biological population through births, deaths, movement and interactions. The first step is a balance: count gains and losses over the same time interval and within the same population boundary. If each individual gives birth at constant per capita rate and dies at rate , with no movement across that boundary, the deterministic abundance obeysThe coefficients have units of inverse time, so gives exponential growth rather than addition of a fixed number each generation.
Resources and crowding can introduce density dependence. For example, the logistic differential equation uses , with carrying capacity . An age-structured population equation or stage-structured population model separates individuals whose survival and reproduction differ. At low abundance, a birth-death process also represents demographic stochasticity: a positive deterministic growth rate does not prevent a finite population from going extinct. Repeated counts and survival or reproductive observations test which rates and state variables the model actually needs.
A seed-producing population with first-season and second-season recruitment leads to nonnegative recurrence coefficients . Its characteristic roots are . The nonnegative dominant root is below one precisely when , giving deterministic decay of every finite initial population. This is a mean-population model; literal integer extinction requires a stochastic interpretation or a separate integer-population argument.
A chemostat maintains a well-mixed culture at constant volume by feeding fresh nutrient solution and removing culture at the same volumetric flow . Its dilution rate is . Mixing makes the outflow's nutrient concentration and biomass concentration equal to those inside the vessel; continuous replacement supplies nutrient and also removes growing cells.
The simplest one-nutrient chemostat uses nutrient concentration , biomass concentration , constant feed nutrient concentration , and constant biomass yield . Assume a cell-free feed, one growth-limiting nutrient, constant volume, and no cell retention, death or additional nutrient consumption for maintenance. With specific growth rate , its ordinary differential equations areThe nutrient balance contains inflow , outflow , and consumption ; the biomass balance contains production and removal . If is in grams of nutrient per litre and in grams of dry biomass per litre, is grams of dry biomass produced per gram of nutrient consumed. Thus both balances have units of their respective concentration per time. The Monod equation supplies an empirical choice of ; the balances themselves express the stated production, consumption and transport assumptions.
The appeal of a chemostat is that, at a positive chemostat steady state, adjusting the pump sets the specific growth rate to . The residual nutrient concentration then adjusts to that rate, and the available nutrient together with biomass yield sets the biomass concentration. This gives a controlled way to compare cultures at selected growth rates and a simple quantitative warning of chemostat washout.
Two 1950 publications on continuous culture are Novick and Szilard's Description of the Chemostat, Science 112(2920), 715-716, dated 15 December, and Monod's La technique de culture continue. Théorie et applications, Annales de l'Institut Pasteur 79, 390-410. The latter's original bibliographic details are reproduced in the contents of Monod's collected papers. These references identify contemporary publications without establishing priority between them. [ref]
https://doi.org/10.1126/science.112.2920.715. Aaron Novick and Leo Szilard, Description of the Chemostat (1950)
. [ref]https://api.pageplace.de/preview/DT0400.9780323142632_A23647608/preview-9780323142632_A23647608.pdf. Monod's 1950 original, listed in Selected Papers in Molecular Biology by Jacques Monod, contents p. vi
.The Monod equation is an empirical saturating law for the specific growth rate of a culture limited by one nutrient. Write for its residual nutrient concentration, for the limiting specific growth rate, and for the nutrient concentration at half that rate:Here and have units of inverse time, whereas has the same units as . The notation in the title denotes the same growth function, with , and . For , ; for , approaches . Its derivative is positive: more nutrient increases the specific growth rate, with progressively smaller increments.
For example, take and . Nutrient concentrations of , and give specific growth rates , and . In a chemostat with dilution rate , the intersection selects the residual nutrient concentration , provided the feed can supply enough nutrient for a positive biomass concentration.
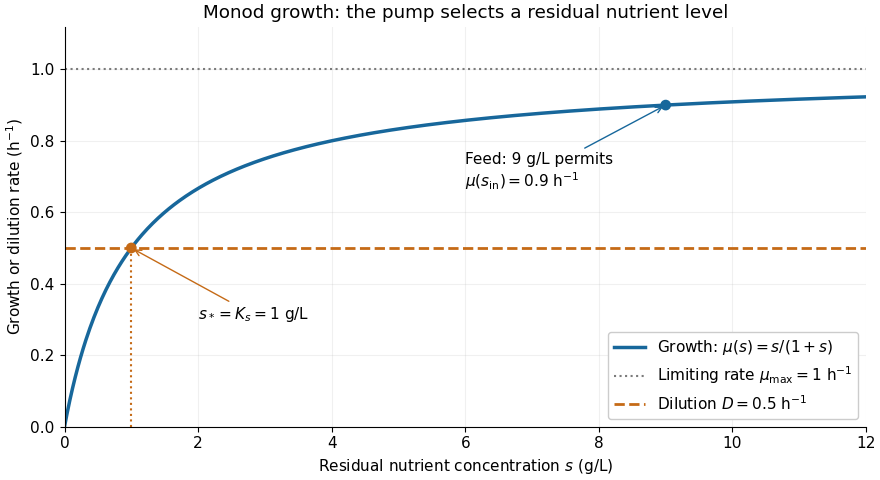

The Monod equation is useful because two measurable parameters describe both nutrient scarcity and saturation. It assumes the other conditions affecting growth remain controlled and does not represent inhibition at high nutrient concentration. Although its formula resembles the Michaelis-Menten equation, a whole culture's specific growth rate combines many processes; the resemblance alone does not derive it from Michaelis-Menten kinetics or identify with a Michaelis constant.
In his 1949 review, Monod presents the hyperbolic rate law as an empirical fit in equation (2), pp. 383-384, and discusses the difficulty of identifying a single growth-controlling reaction. His reported division rates use doublings per unit time; the natural-exponential specific growth rate used here is that division rate multiplied by . [ref]
https://garcialab.berkeley.edu/courses/papers/Monod1949.pdf. Jacques Monod, The Growth of Bacterial Cultures, Annual Review of Microbiology 3 (1949), 371-394, DOI: 10.1146/annurev.mi.03.100149.002103
.A network describing how gene products affect the production of other gene products. Positive and negative regulatory interactions can generate multistability, oscillations, and noise-sensitive transitions.
// Target: mathematical-biology.bigb
A food web records resource-consumer interactions among species. A linear food chain is a special case. Positive interaction coefficients alone do not imply persistence: the per-capita growth balances must admit feasible positive long-term mean abundances.
An Allee effect makes per-capita growth less favorable at low abundance. A strong effect permits a stable zero state and a stable positive state separated by a finite threshold. Cooperative infections can exhibit the same positive-feedback structure: neither disease invades alone, but sufficiently many joint infections sustain both.
A metapopulation describes occupied habitat patches with local colonization and extinction. The patch occupancy variable differs from population abundance within a patch.
An epidemic is disease occurrence above the expected level for a specified population, place and period. The comparison needs a baseline: an increase in incidence alone does not establish an epidemic, and cases need not be increasing throughout an outbreak. For example, if a hypothetical community normally records two cases per week, a fall from twenty cases to eight still leaves occurrence above that baseline.[ref]
Principles of Epidemiology in Public Health Practice by the Centers for Disease Control and Prevention. Lesson 1, section 11, Level of disease: expected occurrence and epidemic/outbreak definitions
An epidemic curve plots cases against time, commonly using symptom onset. A common-source outbreak reflects shared exposure, whereas a propagated outbreak reflects transmission between hosts; these mechanisms can also combine.[ref]
Principles of Epidemiology in Public Health Practice by the Centers for Disease Control and Prevention. Lesson 1, section 11, Epidemic Patterns: common-source, propagated and mixed outbreaks
In a closed homogeneous SIR model, let and be susceptible and infectious fractions, with transmission coefficient and recovery rate . The equations giveFor , the infectious compartment grows when the effective reproduction number exceeds one and shrinks below one. This is a dynamical growth threshold, distinct from comparison with an observed baseline. An epidemic invasion threshold concerns growth after a small introduction; a final size relation for an epidemic concerns total susceptible depletion. An endemic equilibrium instead has continuing transmission balanced by the population's other processes.
The FitzHugh-Nagumo model represents an excitable cell by a fast activation variable and a slower recovery variable. A common nondimensional form is , . Its cubic activation response and recovery feedback can produce an excitable resting state or sustained oscillations through bifurcations. Particular reductions and travelling-wave equations can have additional state variables; their signs and parameter conventions must be stated separately.
Math 530: Graph Theory (Combinatorial Mathematics I), Spring 2023 Math 530 Spring 2023, Lecture 6: Multigraphs and digraphs by  Codex 0 2026-10-13
 Math 220A: Partial Differential Equations of Applied Mathematics 5 Wave Equation in R by Codex 0 2026-10-13
Codex 0 2026-10-13 There are unlisted articles, also show them or only show them.