
Antonius T. M. Van Kessel 2026-11-05
Antonius T. M. Van Kessel coauthored the visible-light co-oxidation assay with Evan A. Haidasz and Derek A. Pratt for characterizing radical-trapping antioxidants.[ref]
A Continuous Visible Light Spectrophotometric Approach To Accurately Determine the Reactivity of Radical-Trapping Antioxidants by Evan A. Haidasz and others. Byline and Abstract
A central analytical distinction is between reaction speed and finite trapping capacity: an inhibitor can intercept radicals rapidly yet be exhausted after relatively few events.An original competition model holds the concentrations of donor and reporter approximately constant over a short interval. Let the effective rates for a radical be for interception and for a competing reporter route. The probability of interception as the first event isChoosing and gives . Halving without changing concentration gives . The kinetic response changes even if the two preparations have the same total number of donor molecules.
Under a separate ideal capacity model, two intercepted radicals per donor at and constant initiation rate give an inhibited interval . That capacity estimate alone does not distinguish the two chosen rate constants. Actual co-oxidation traces require the appropriate chain-reaction and reporter model; the simple competition and capacity calculations illustrate different kinds of information, not individual experimental tasks attributed to Van Kessel.
Autoxidation 2026-11-05
Autoxidation is oxidation of a substance by molecular oxygen, commonly proceeding through a self-propagating free radical chain in organic materials. The name does not mean that initiation is unnecessary. Light, existing peroxides or other radical sources can start a chain, and changes in initiation can alter the observed rate.
A basic hydrocarbon propagation scheme writes the substrate as :A peroxyl radical is converted into a hydroperoxide while generating a new carbon-centered radical. The two-step cycle consumes substrate and oxygen but regenerates a chain carrier. Radical–radical reactions can terminate chains; hydroperoxide decomposition can create further initiating species.
An original limiting kinetic model assumes abundant oxygen, approximately constant substrate concentration and termination dominated by pairs of peroxyl radicals. If initiation supplies radicals at rate and termination removes them at , the steady radical concentration isQuadrupling then doubles the propagation rate rather than quadrupling it. This scaling follows from the stated balance; it need not hold when oxygen delivery, changing substrate or other termination pathways control the experiment.
A motivating modern apparatus is the inhibited autoxidation assay. A primary method co-oxidizes a hydrocarbon substrate with a BODIPY-based signal carrier and monitors progress with a visible-light spectrophotometer. Comparing inhibited and uninhibited traces tests radical trapping while distinguishing reaction rate from trapping capacity.[ref]
A Continuous Visible Light Spectrophotometric Approach To Accurately Determine the Reactivity of Radical-Trapping Antioxidants by Evan A. Haidasz and others. Primary abstract, co-autoxidation signal carriers and kinetic/stoichiometric interpretation
A reduced signal slope can reflect chemical inhibition or inadequate oxygen supply, so controls for oxygen-limited autoxidation, probe response and matched initiation matter. The chain mechanism helps explain why excluding oxygen, intercepting radicals and changing peroxide decomposition can affect oxidation differently. An arbitrary antioxidant-assay signal alone does not establish product identity or a biological benefit.
Autoxidation inhibition period 2026-11-05
An autoxidation inhibition period is a defined interval during which oxidation is suppressed relative to a matched uninhibited reaction. In an inhibited autoxidation assay, it can report how long a radical-trapping antioxidant retains effective capacity, but the operational start and end of the interval must be specified.
For a limiting model with antioxidant concentration , trapping stoichiometry and constant effective chain-initiation rate , let . If trapping is rapid and quantitative until exhaustion,At chosen values , and , the model gives . Equal periods can arise from different combinations of concentration, stoichiometry and initiation rate, so an independent autoxidation initiation-rate calibration is needed to infer a capacity.
For changing initiation rate, capacity is consumed according to the integrated flux:An original decaying-flux example takes , with . Thenwhen . For , and , this gives about , rather than the initial-rate approximation .
Initiator-limited antioxidant exhaustion arises because this model supplies only total flux . Here that limit is : a capacity would never be exhausted by this modeled initiation source. Absence of a breakpoint would not demonstrate unlimited antioxidant capacity.
Experimentally, a delay can be defined by a stated curve-fitting or threshold rule, while the suppressed region can retain a nonzero oxidation slope. Primary spectrophotometric co-autoxidation work treats kinetics and stoichiometry as distinct properties of the radical-trapping reaction.[ref]
A Continuous Visible Light Spectrophotometric Approach To Accurately Determine the Reactivity of Radical-Trapping Antioxidants by Evan A. Haidasz and others. Indexed abstract, continuous reaction monitoring and kinetic/stoichiometric distinction
A longer apparent period can also reflect changed initiation, oxygen depletion or a readout effect. Comparing a matched blank, a reference antioxidant and a concentration series helps test which interpretation is supported. Autoxidation initiation-rate calibration 2026-11-05
Autoxidation initiation-rate calibration estimates the effective rate at which radical chains enter the specified inhibited autoxidation assay. It connects a measured inhibition delay to chemical trapping capacity. Initiator concentration by itself is not necessarily this effective rate: decomposition, radical escape and reaction conditions can affect how many chains are actually initiated.
For a known reference radical-trapping antioxidant at concentration with trapping stoichiometry , assume constant effective initiation rate and rapid, quantitative trapping until exhaustion. Capacity balance givesThis calibrates the initiation rate only to the extent that the reference stoichiometry and the inhibition-period interpretation are valid. A single unknown antioxidant cannot generally determine both its own trapping capacity and .
Autoxidation lag standard addition can expose a background capacity. Under an additive-capacity model,An original series with added reference concentrations , and and measured periods , and has slope . For , this implies . The intercept represents an equivalent pre-existing trapping capacity under this model; it does not identify the background chemical species.
Using without accounting for the intercept would give about and at the two nonzero additions, instead of the common slope-based value. A concentration series therefore tests more than one isolated lag measurement. Curvature or changing slopes can indicate that addition changes the chemistry or that the initiation rate is not constant.
The signal still needs a reaction model. A primary visible-light method follows a BODIPY-based signal carrier co-autoxidizing with a hydrocarbon substrate, distinguishing radical-trapping kinetics from stoichiometry.[ref]
A Continuous Visible Light Spectrophotometric Approach To Accurately Determine the Reactivity of Radical-Trapping Antioxidants by Evan A. Haidasz and others. Indexed abstract, signal-carrier method and kinetic/stoichiometric distinction
A fitted optical breakpoint is not automatically the instant of chemical exhaustion.For time-dependent initiation, the balance becomes . Temperature, solvent, oxygen availability, reference identity and the observation procedure must therefore remain controlled or explicitly modeled. The calibration belongs to the assay conditions, rather than being an intrinsic constant transferable to every oxidation experiment.
Autoxidation lag standard addition 2026-11-05
Autoxidation lag standard addition estimates an initiation rate or an equivalent background trapping capacity by adding known amounts of a reference radical-trapping antioxidant to a matched sample matrix. It uses a series of autoxidation inhibition periods, rather than treating one delay as a chemical concentration.
Under constant effective initiation rate , fast quantitative trapping and unchanged reference stoichiometry , let be the initial background capacity and the added reference concentration. Capacity balance givesThus the linear regression intercept and slope have different roles. The concentration is an equivalent amount of the chosen reference; it does not identify the background chemical species.
For an original series, gives delays . Then and . With , the model gives and of trapping capacity, equivalent to of that reference. Using only the largest addition and dividing by its full delay would give about , because it incorrectly includes the background delay in the reference-only balance.
At first order, if is known, . Inference of also involves the fitted intercept-slope covariance; treating fitted parameters as independent can misstate the measurement uncertainty. Replicates at several concentrations test linearity and estimate the delay variability.
The chemical observation must still be defined. A primary spectrophotometric method monitors a BODIPY-based signal carrier co-autoxidizing with a hydrocarbon and distinguishes trapping kinetics from stoichiometry.[ref]
A Continuous Visible Light Spectrophotometric Approach To Accurately Determine the Reactivity of Radical-Trapping Antioxidants by Evan A. Haidasz and others. Primary abstract, continuous visible-light method and kinetic/stoichiometric distinction
The regression above is a stated capacity model, not an assertion that this paper used this particular numerical series. Keep solvent addition, initiation, temperature, oxygen supply and breakpoint rule matched. Curvature can reveal altered chemistry, oxygen-limited autoxidation or time-varying initiation; it should not be hidden by forcing a straight line. BODIPY 2026-11-05
BODIPY denotes the boron-dipyrromethene family of compounds, widely used as optical dyes. A common dye skeleton contains a boron-difluoride centre coordinated within a dipyrromethene-derived framework. ChEBI defines BODIPY dyes structurally and lists many substituted members, rather than assigning one chemical formula or optical spectrum to the whole family.[ref]
BODIPY dyes in ChEBI. CHEBI:51123, definition and listed class members; broader class CHEBI:51108
The conjugated system, substituents and environment affect light absorption and fluorescence. Sharing a scaffold does not imply equal molar absorption coefficients, fluorescence quantum yields or chemical reactivity. A dye can also serve as a reaction participant, rather than an inert tracer.
A primary method by Evan A. Haidasz, Antonius T. M. Van Kessel and Derek A. Pratt followed co-oxidation of a hydrocarbon substrate with the signal carriers PBD-BODIPY or STY-BODIPY by visible-light spectrophotometry. The assay was designed to characterize radical-trapping antioxidants and distinguish reaction kinetics from trapping capacity.[ref]
A Continuous Visible Light Spectrophotometric Approach To Accurately Determine the Reactivity of Radical-Trapping Antioxidants by Evan A. Haidasz and others. Abstract, signal carriers and kinetic/stoichiometric interpretation
Its optical readout should not be described automatically as a fluorescence measurement simply because the compounds are dye derivatives.An original photon-counting model illustrates another distinction. For incident photon rate and absorbance , the fraction absorbed is . With fluorescence quantum yield and detection efficiency , an idealized detected emission rate isAt small , this is approximately , which can be proportional to concentration under a suitable Beer-Lambert law. Increasing from0.10 to0.20 instead increases absorbed fraction from approximately0.206 to0.369, a factor1.79 rather than2. This example assumes unchanged quantum yield, geometry and negligible reabsorption; it does not assign those conditions to every BODIPY experiment.
A quantitative application therefore specifies the derivative, solvent, wavelength, chemical state and observable. Absorption loss, emission change and reaction-product formation are related measurements only through a validated response model.
Chromophore-specific calibration of antioxidant signal carriers determines how the optical response of a particular dye, its products and its environment maps to chemical amount. Sharing the BODIPY scaffold does not establish equal spectra or extinction coefficients. The original assay distinguishes the PBD- and STY-conjugated carriers and seeks kinetic as well as stoichiometric information.[ref]
An original two-species absorption model iswhere is the carrier, an absorbing product and the background. If one product molecule forms for each consumed carrier, , soThe optical slope depends on the difference in coefficients, not the carrier coefficient alone.
For stipulated cm, and , conversion of 10 micromolar carrier changes absorbance by 0.40. Treating the product as transparent would infer only micromolar loss. The chemical conversion has been underestimated by one third. No actual carrier coefficient is assigned by this example.
Product-absorbance correction in antioxidant signal carriers can be tested with multiple wavelengths. With known backgrounds, two independent spectral equations can recover two species if their coefficient matrix is invertible. For the illustrative coefficient matrixpath 1 cm and absorbances , solving gives and micromolar. Nearly proportional columns would make that separation unstable even if the matrix were formally invertible.
The experimental calibration should therefore specify derivative identity, solvent, wavelength, path, background and relevant chemical states. Acidity changes can alter species populations, and a reaction product may remain optically active. A good fit to a single trace does not independently establish those assumptions. Once the carrier-consumption rate is inferred, a further reaction model is still needed to interpret antioxidant reactivity or stoichiometry.
A dark-loss control for STY-BODIPY autoxidation distinguishes initiation-associated chemical loss from changes caused by illumination, handling or the measurement itself. The control must preserve the relevant experimental conditions while accounting for the photons needed to read the sample. “Dark” handling followed by an optical measurement does not mean zero photon exposure.
The primary antioxidant method uses STY-BODIPY as a co-autoxidizing signal carrier monitored by visible-light spectrophotometry.[ref]
A Continuous Visible Light Spectrophotometric Approach To Accurately Determine the Reactivity of Radical-Trapping Antioxidants by Evan A. Haidasz and others. Abstract
The manufacturer describes monitoring absorbance loss at 571 nm.[ref] That signal does not label its own cause.An original diagnostic design crosses initiation absent/present with low-exposure handling/continuous illumination. Let be the matched fractional absorbance loss, where marks initiation and illumination. The interaction contrast isIt is zero under a simple additive loss model. A nonzero result shows that subtracting an independently measured light-only loss may not isolate the initiated process.
For stipulated losses , , and , the additive prediction for the last condition is 0.16, while the observed-model value is 0.20. The interaction is 0.04. These are constructed observations, not published STY-BODIPY data. They illustrate why photobleaching and chemical oxidation need not combine as independent corrections.
Illumination-initiation interaction in dye-loss controls can arise in a measurement model without being uniquely diagnosed by this contrast. Temperature, oxygen availability and exposure timing also need matching. Compare spectral changes and final readout conditions, rather than assuming every difference is photobleaching.
A proposed control series includes carrier without initiation, initiation without test antioxidant and test material without carrier where its own absorbance could contribute. Record readout duration and photon exposure for each condition. A dark endpoint measured once and an illuminated sample monitored repeatedly have different acquisition histories. Interpret their difference using that history before converting absorbance loss into antioxidant kinetics or trapping capacity.
Derek A. Pratt 2026-11-05
Derek A. Pratt studies the mechanisms and products of radical reactions, including hydrocarbon and lipid oxidation and its inhibition by antioxidants. His University of Ottawa profile identifies this research programme and his chemistry affiliation.[ref] With Evan A. Haidasz and Antonius T. M. Van Kessel, he coauthored the visible-light spectrophotometric method for radical-trapping antioxidant reactivity.[ref]

Derek A. Pratt, portrait identified by the University of Ottawa
. External portrait labelled Derek Pratt on the official Faculty of Science profile.An original steady-state model illustrates why adding a trap can change oxidation kinetics. Let radicals enter at rate , disappear by bimolecular radical chain termination at rate , and be removed by trapping at rate . Radical balance givesWith no trapping, ; with sufficiently strong trapping, . A substrate-oxidation rate proportional to consequently follows different initiation-rate scalings in those regimes.
For chosen and , the no-trap radical concentration is . Adding gives . These are illustrative model parameters, not measurements from Pratt's work. Experimental interpretation must identify which reactions the optical reporter follows; a reduced signal alone does not locate the inhibited chemical step or establish an effect in a living system.
Evan A. Haidasz 2026-11-05
Evan A. Haidasz is first author of a spectrophotometric method for measuring radical-trapping antioxidant reactivity, with Antonius T. M. Van Kessel and Derek A. Pratt. The primary paper uses visible-light monitoring of hydrocarbon co-oxidation with PBD-BODIPY or STY-BODIPY signal carriers.[ref]
A Continuous Visible Light Spectrophotometric Approach To Accurately Determine the Reactivity of Radical-Trapping Antioxidants by Evan A. Haidasz and others. Byline and Abstract; Journal of Organic Chemistry81, pp.737–744
The measurement connects a continuous optical trace with a kinetic model, rather than ranking compounds solely by a final colour.For an original idealization, let a signal carrier at concentration obey the Beer-Lambert law in a fixed path:With stipulated , and slope , the inferred carrier-consumption rate is . These chosen optical parameters are not a calibration assigned to the paper's dyes.
A constant background drops out of the derivative, but a drifting background does not. If itself changes, its slope can mimic chemical conversion. Products that also absorb at the measurement wavelength likewise require an expanded response model. Continuous observation provides timing information, while chemical identity and calibration determine what that timing means. The inferred dye-consumption rate is not automatically the elementary rate of every radical event.
Illumination-initiation interaction in dye-loss controls tests whether changing illumination has the same response in the absence and presence of chemical initiation. A crossed factorial design separates the four conditions. For mean fractional losses , with indicating initiation and illumination, the contrastmeasures statistical interaction on the fractional-loss scale. In the STY-BODIPY assay context, the optical observable is carrier loss during co-autoxidation, not a direct label of its chemical cause.[ref]
A Continuous Visible Light Spectrophotometric Approach To Accurately Determine the Reactivity of Radical-Trapping Antioxidants by Evan A. Haidasz and others. Abstract: visible-light spectrophotometric co-autoxidation and kinetic/stoichiometric interpretation
The crucial qualification is response-scale dependence of dye-loss interactions. Consider an original first-order survival model with fully additive rate constants,ThenFor positive , and , this is negative even though the rates have no interaction term. With stipulated , in reciprocal time units and , the losses are , , and , giving . Saturation of fractional loss produces the contrast without a new chemical coupling.
On the transformed scale , the same noiseless model gives and zero interaction contrast. This transformation is appropriate only when the measured signal genuinely follows the stated survival model; product absorption or changing backgrounds can invalidate it. A transformed zero is therefore a conditional model check, not proof of a reaction mechanism.
For independent replicate measurements, the variance of the estimated loss contrast is . Four replicates per condition with common standard deviation 0.01 give a contrast standard uncertainty of 0.01. The modeled contrast above is smaller than that scale. Shared references instead introduce covariances that must be retained.[ref]
Match temperature, oxygen access, timing and readout exposure across conditions. Specify the response scale before interpreting a nonzero contrast as evidence about photobleaching or initiated oxidation.
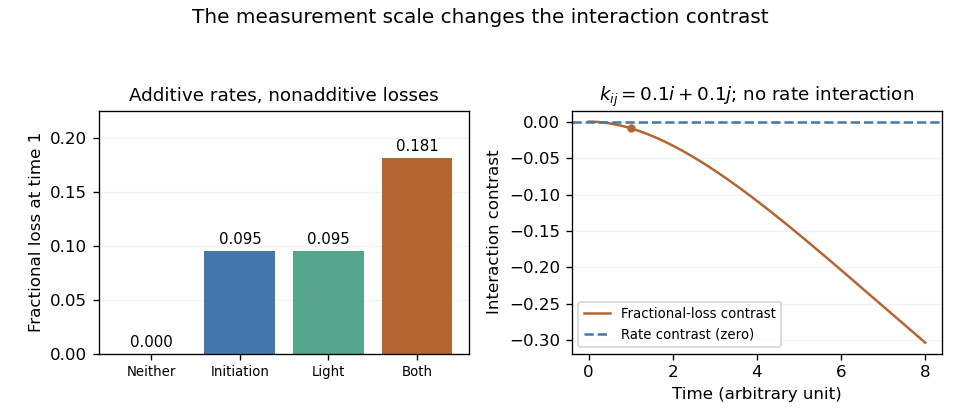
An original additive-rate model gives a negative interaction contrast on the fractional-loss scale. Transforming the same ideal observations back to rates gives zero rate interaction.
Details. 
Inhibited autoxidation assay 2026-11-05
An inhibited autoxidation assay measures how an added substance changes the time course of a substrate's autoxidation under specified conditions. A radical-trapping antioxidant competes with radical chain propagation, so both the speed of interception and the amount of trapping capacity can affect the observed curve. A smaller oxidation rate and a longer delay before rapid oxidation are distinct observations.
An experiment compares a defined oxidizable substrate with and without the test substance, using matched solvent, temperature, oxygen availability and radical chain initiation. The readout must track the oxidation process rather than merely the test substance's own optical background. One primary method uses a visible-light spectrophotometer and a BODIPY-based signal carrier that co-autoxidizes with a hydrocarbon substrate.[ref]
A Continuous Visible Light Spectrophotometric Approach To Accurately Determine the Reactivity of Radical-Trapping Antioxidants by Evan A. Haidasz and others. Primary indexed abstract, co-autoxidation signal carriers and kinetic/stoichiometric distinction
The instrument observes a probe response; interpreting it as substrate oxidation requires the method's coupled-reaction model.An original limiting model explains an autoxidation inhibition period. Let radical-chain initiation supply chains at constant concentration rate . Suppose the antioxidant initially has concentration and can intercept chain carriers per molecule, with fast, nearly quantitative interception until it is exhausted. Capacity balance givesFor chosen values , and , the modeled period is . Doubling the antioxidant concentration doubles it under these assumptions. But at gives the same capacity, so an inhibition period alone does not separately determine trapping stoichiometry and antioxidant concentration.
Autoxidation initiation-rate calibration is consequently part of the inference. If initiation varies between samples, a longer inhibition period need not mean more antioxidant. Finite trapping rates, side reactions, inhibitor regeneration and changing oxygen availability can invalidate the simple capacity model. Comparing the inhibited slope with the uninhibited curve asks a kinetic question in addition to the capacity question.
A 1983 primary study used inhibited autoxidation to estimate lipid-soluble chain-breaking antioxidant concentrations in human plasma and erythrocyte ghosts, and compared those results with vitamin E measured by high-performance liquid chromatography.[ref]
Is vitamin E the only lipid-soluble, chain-breaking antioxidant in human blood plasma and erythrocyte membranes? by G. W. Burton and others. Abstract, inhibited-autoxidation and HPLC comparison
That independent comparison tests a relationship between activity and composition in the studied preparations; an arbitrary antioxidant-assay signal alone does not establish chemical identity or a health benefit. Initiator-limited antioxidant exhaustion 2026-11-05
Initiator-limited antioxidant exhaustion describes whether a finite radical source can consume all the trapping capacity in an inhibited autoxidation assay. A missing end to an autoxidation inhibition period can result from too little integrated initiation, rather than an unlimited amount of radical-trapping antioxidant.
Let be the initial radical-trapping capacity, measured in concentration of trapped chain carriers. Assume quantitative trapping, no regeneration or competing loss, and an initiation flux with . Before exhaustion the remaining capacity isThe source can deliver only . Consequently, gives finite exhaustion timeIf , capacity approaches zero only as . If , a positive capacity remains even at infinite time. These are different outcomes despite both lacking a finite exhaustion breakpoint.
For an original example, and give total supply . Initial capacities , and respectively give exhaustion at , asymptotic exhaustion, and a residual . The initial-rate estimate would wrongly predict a finite exhaustion time in the middle case.
The logarithm explains a sensitive regime. For ,but diverges as . Small capacity or initiation-calibration changes near that threshold can cause large lag changes.
A primary visible-light autoxidation method distinguishes trapping kinetics from stoichiometry through a coupled oxidation readout.[ref]
A Continuous Visible Light Spectrophotometric Approach To Accurately Determine the Reactivity of Radical-Trapping Antioxidants by Evan A. Haidasz and others. Indexed abstract, reaction monitoring and kinetic/stoichiometric interpretation
In the model here, a controlled second initiator addition can test whether capacity remains after the first source declines. A matched blank and independent autoxidation initiation-rate calibration are essential: extra initiation can change the optical reaction, and a persistent background source would eventually exhaust even capacity above . An absent breakpoint alone does not distinguish these mechanisms. PBD-BODIPY 2026-11-05
PBD-BODIPY is the 1-phenylbutadiene-conjugated BODIPY signal carrier in a spectrophotometric method for radical-trapping antioxidants. The conjugated appendage distinguishes it from the styrene-conjugated carrier STY-BODIPY. In the primary method, each can co-autoxidize with a hydrocarbon substrate so that the changing optical signal follows reaction progress.[ref]
The shared scaffold does not make the two carriers interchangeable calibrants. Additional conjugation can alter the electronic structure, while substitution and solvent affect the spectrum and chemical response. Chromophore-specific calibration of antioxidant signal carriers is therefore needed before converting an absorbance slope into a chemical rate.
An original comparison assumes a PBD-carrier calibration and path length 0.5 cm. Absorbance 0.40 then represents 10 micromolar carrier. Substituting a coefficient of 50000 from another hypothetical dye would instead infer 16 micromolar, a 60% overestimate. These stipulated coefficients illustrate a calibration error; neither is asserted as a measured value for these compounds.
The same issue affects a rate. Under a Beer-Lambert law with unchanged absorbing species and coefficient,With the first illustrative coefficient and path, an absorbance slope gives carrier-loss rate . A raw optical slope is not yet a molecular consumption rate, and a carrier-consumption rate is not automatically an antioxidant-trapping rate.
A proposed comparison records separate starting spectra, matched reaction conditions and appropriate carrier and test-material blanks. Differences in lag duration and decay slope can constrain different parts of a kinetic model. A longer lag can reflect trapping capacity, while a changed slope also depends on the competition between propagation and trapping; neither readout should be assigned a unique molecular explanation without testing the response model.
The primary study explicitly seeks both kinetic and stoichiometric information. Preserve that distinction when comparing PBD-BODIPY with STY-BODIPY, rather than describing every signal decrease as an interchangeable measure of antioxidant concentration.
Product-absorbance correction in antioxidant signal carriers separates the optical response of unconsumed carrier from that of absorbing reaction products. It is needed before an absorbance slope is converted into carrier consumption. The primary co-autoxidation method distinguishes signal-carrier chemistry and uses its response for both kinetic and trapping-stoichiometry information.[ref]
For an original two-species Beer-Lambert law model with fixed volume and corrected background,If product yield is per consumed carrier molecule, , soBoth molar absorption coefficients and the assumed yield enter. When , conversion is optically invisible at that wavelength even if it proceeds to completion. An unchanged trace is then consistent with extensive chemistry.
Product-null spectral contrasts can eliminate one known interfering component. Suppose two background-corrected wavelengths have illustrative coefficient columns and in . The linear combinationcancels the product because . At cm, absorbances yield and micromolar. This separation does not require a product-yield assumption, but it does require valid coefficients, only the specified absorbing components and known backgrounds.
If the two absorbances have independent standard uncertainties of 0.001, the contrast has uncertainty , giving approximately 0.0203 micromolar uncertainty in . Correlated errors change that result through the covariance term: .[ref]
A product spectrum proportional to the carrier spectrum cannot be removed while retaining carrier sensitivity. Additional products, changing protonation or a drifting background also require a larger measurement model. Test the correction with independently prepared carrier/product mixtures and full spectra before attributing the corrected trace to a particular antioxidant reaction rate. The numerical coefficients here are constructed examples, not reported carrier constants.
Product-null spectral contrasts 2026-11-05
A product-null spectral contrast is a weighted combination of spectral measurements that cancels a modeled product contribution while retaining sensitivity to the carrier of interest. It is useful when carrier consumption and product formation both change the absorbance recorded in an inhibited autoxidation assay.
After background correction and with path length included in the response coefficients, write a measurement vector asHere and are known carrier and product spectral response columns. A contrast removes the product and has unit carrier response whenIf the columns are proportional, these constraints are incompatible. More measurements do not help if they add no independent spectral information.
An original three-channel example uses scaled coefficient columns and . The weights satisfy both constraints. Stipulated concentrations give and the contrast returns . The coefficient and concentration units have been absorbed into the scaling; these are not measured dye coefficients.
For independent equal-variance channel noise , the example has variance . These are the minimum-variance weights under the stated noise model: project perpendicular to , then normalize that residual to unit carrier response. The Cauchy-Schwarz inequality shows that any other vector with the same constraints has at least as large a norm. A two-channel difference using just the first two measurements also isolates the carrier, but weights give the larger variance .
For general covariance matrix , the variance is , so correlated or unequal noise changes the optimal weighting.[ref]
Evaluation of measurement data — Guide to the expression of uncertainty in measurement by JCGM. Section 5.2, covariance propagation
The coupled chemical readout remains the one described by the primary signal-carrier method.[ref]A Continuous Visible Light Spectrophotometric Approach To Accurately Determine the Reactivity of Radical-Trapping Antioxidants by Evan A. Haidasz and others. Abstract
Additional products or changing protonation require additional response columns; a cancellation calibrated for one product does not remove every unknown spectral contribution.A dye-loss interaction is a departure from additivity on a specified response scale. Changing from fractional loss to survival, logarithmic survival or a fitted rate can change that departure. The contrast must therefore be defined before it is interpreted as evidence about coupled chemical mechanisms.
For a crossed initiation/illumination experiment, write fractional losses at a common observation time and defineAn original example takes losses . The contrast is . Yet the surviving fractions obey , with . They are exactly multiplicative on the survival scale.
For first-order survival , transform to . The rate-scale interaction isThe example gives . More generally, additive rates yieldwhich is negative for positive . The fractional-loss ceiling creates the contrast without an additional rate interaction.
The transformation also changes noise. First-order uncertainty propagation gives , so near-complete loss can strongly amplify uncertainty. In addition, the mean of a nonlinear transformation need not equal the transformation of the mean; Jensen's inequality makes that distinction explicit. Averaging transformed replicates and transforming an average need not produce the same result.
The STY-BODIPY readout is a coupled oxidation signal. Its primary method distinguishes radical-trapping kinetics from stoichiometry.[ref]
A Continuous Visible Light Spectrophotometric Approach To Accurately Determine the Reactivity of Radical-Trapping Antioxidants by Evan A. Haidasz and others. Abstract, co-autoxidation method and kinetic/stoichiometric interpretation
A rate transformation requires a justified survival model after product absorption and background have been addressed. Report both the response definition and the uncertainty model; a transformed zero is conditional evidence about that model, rather than a unique identification of the chemistry. STY-BODIPY 2026-11-05
STY-BODIPY is the styrene-conjugated BODIPY signal carrier used in a visible-light assay of radical-trapping antioxidants. It co-autoxidizes with a hydrocarbon substrate, allowing reaction progress to be followed optically. The primary method distinguishes antioxidant reactivity from the number of radicals trapped.[ref]
A Continuous Visible Light Spectrophotometric Approach To Accurately Determine the Reactivity of Radical-Trapping Antioxidants by Evan A. Haidasz and others. Abstract, STY-BODIPY signal carrier and kinetic/stoichiometric aims
The manufacturer's record for the named material gives formula and formula weight approximately . Its method description follows loss of absorbance at 571 nm during co-autoxidation.[ref] This identifies a particular derivative and measurement channel; it does not assign one spectrum to every styrene-substituted BODIPY dye.
An original Beer-Lambert law example assumes a 1 cm path and calibrated molar absorption coefficient . Absorbance falling from 1.00 to 0.80 corresponds to signal-carrier concentration falling from 20 to 16 micromolar. The inferred 4 micromolar loss depends on that assumed coefficient and the identity of the absorbing species. Those numbers are illustrative, not a reported STY-BODIPY calibration.
A simple kinetic model writes , where represents a constant peroxyl-radical concentration. Then . An antioxidant that changes the radical population can change the optical decay, but the resulting trace must be interpreted through the co-oxidation model. Dye consumption alone does not count antioxidant molecules without further kinetic and stoichiometric information.
Dark-loss control for STY-BODIPY autoxidation tests one potential confounder. Proposed controls compare the signal carrier without radical initiation, under matched illumination and in the presence of test material that might itself absorb at the observation wavelength. These distinguish chemical oxidation from unrelated optical change or added absorbance.
Although the product is described as fluorogenic, the original assay discussed here uses visible-light spectrophotometry. Absorbance loss and fluorescence change are different observables. Specify the derivative, solvent, optical channel, blank correction and response model when using the named dye to compare antioxidant activity.