Flow cytometry records signals from suspended particles passing an illuminated interrogation region. For a flow cytometric DNA-content assay, a laser excites a DNA-binding dye and a detector records its fluorescence. An event is a recorded passage, not a guarantee that exactly one intact biological cell was measured.
A flow cytometer is an instrument that measures optical signals as suspended particles pass through an illuminated observation region. Its fluidics positions the sample stream, its optical system excites and collects light, and its electronics converts detector pulses into recorded events. Flow cytometry is the measurement technique; a flow cytometer is the apparatus implementing it.
In a common design, hydrodynamic focusing narrows the sample stream within surrounding fluid so particles encounter a more reproducible region of a laser beam. Collected fluorescence and scattered light reach photodetectors through optical selection elements. A pulse can be summarized by its height, integrated area and width. The FACSCelesta manual distinguishes the maximum digitized intensity from the integral over the electronic acquisition window.[ref]
BD FACSCelesta Flow Cytometer User’s Guide by BD Biosciences. Chapter 7, Technical overview, printed p. 115
Signal area and peak height are different measurements even when both increase with the brightness of a selected particle population.For an original ideal pulse model,Two pulses with the same height but widths and have areas in ratio 1:2. Conversely, equal areas can arise from different heights and durations.
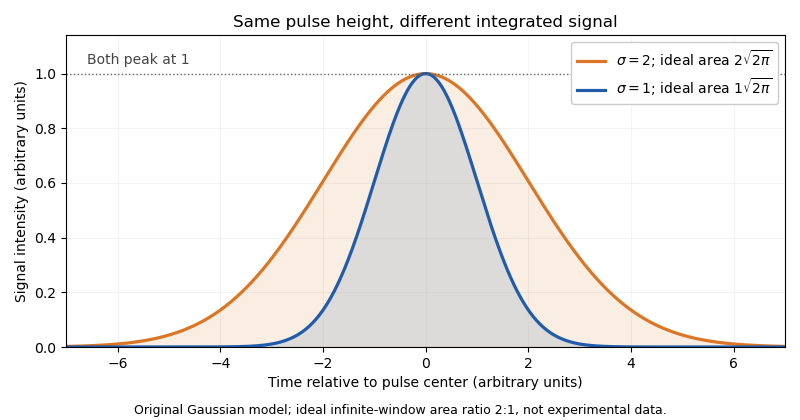
Real acquisition windows and thresholding modify the infinite-window model. Pulse-shape comparisons can help identify coincident particles, but no one pulse parameter guarantees a single intact biological cell.
A primary experimental example measured green fluorescent protein expression in a genetic toggle switch with a FACSCalibur instrument. It used 488 nm excitation, a 515–545 nm emission filter and separately acquired cultures; single-cell distributions distinguished alternative expression populations.[ref]
Construction of a genetic toggle switch in Escherichia coli by Timothy S. Gardner and others. p. 342, Methods, Assay of gene expression; Figure 5
That experiment illustrates the chain from biological reporter to photons, detector signal and population interpretation.A flow cytometric DNA-content assay similarly requires controlled staining, a suitable event-selection rule and detector operation within its quantitative range. Adjusting detector gain changes recorded signal without changing cellular DNA. Instrument response, sample preparation and biological interpretation therefore require distinct controls.
Hydrodynamic focusing positions a sample-bearing stream within another flowing liquid. In a conventional flow cytometer, surrounding sheath flow narrows the sample core so suspended particles encounter a more reproducible part of the laser beam. The FACSCelesta technical description identifies pressure-driven sample introduction into a laminar sheath stream through the flow cell.[ref]
BD FACSCelesta Flow Cytometer User’s Guide by BD Biosciences. Chapter 7, About fluidics, Hydrodynamic focusing
Positioning the stream improves optical sampling; it does not guarantee that every recorded event contains one particle.Conservation of mass connects flow fractions with geometry only after specifying a velocity profile. In an original equal-speed, incompressible model, a cylindrical core of radius inside radius has sample fraction . A sample fraction 0.01 would therefore give .
A fully developed Poiseuille flow profile gives a different result. For matched viscosities and a passive cylindrical division between sample and sheath, integrate over the core. With ,Now gives , because the central fluid travels faster than the average. These are illustrative limiting models, not a design specification for the manufacturer's developing flow-cell geometry.
In practice, geometry, pressure balance and flow conditions set the core position and width. A narrower distribution of trajectories can reduce variation caused by nonuniform illumination. Raising sample throughput can trade acquisition speed against positional resolution. Particle concentration introduces another issue: even a well-centered stream can contain close pairs whose optical pulses overlap.
A proposed validation holds optical settings fixed, varies the sample-to-sheath flow ratio, and compares a stable reference-particle population's signal distribution and event rate. Changes in measured fluorescence then need to be separated from changes in alignment or transit conditions. Fluid positioning, detector response and biological variability are distinct parts of the measurement.
Sheath flow is a surrounding liquid stream that carries and positions a sample-bearing stream. In a conventional flow cytometer, the sample enters an enclosing flow through the flow cell; hydrodynamic focusing guides the core toward the optical interrogation region. The FACSCelesta technical description identifies the separate pressurized sample input and surrounding sheath fluid.[ref]
BD FACSCelesta Flow Cytometer User’s Guide by BD Biosciences. Chapter 7, About fluidics, Hydrodynamic focusing
The interface between the streams is not a solid tube. In laminar flow, adjacent fluid can travel with relatively little bulk transverse mixing while dissolved material still crosses the interface by diffusion. Positioning particles, controlling sample dilution and preventing molecular exchange are therefore different objectives.
An original diffusion comparison makes the distinction quantitative. A stream travels an observation distance at characteristic speed , giving residence time . For one transverse coordinate, a passive species with diffusion coefficient has characteristic displacementTake stipulated s and a core radius of . A species with has , whereas one with in those units has . The same focusing geometry can confine slowly diffusing particles well while allowing appreciable redistribution of a smaller solute. These coefficients are illustrative, not assigned to a particular reagent or cell.
Increasing sheath relative to sample flow can narrow the core, but the quantitative relation depends on the velocity field and geometry. The hydrodynamic focusing article contrasts equal-speed and Poiseuille flow models. A flow fraction is not automatically an area fraction.
A useful experimental check keeps a stable reference-particle suspension and optical settings fixed while changing the flow balance. Event-rate changes, signal spread and background distinguish throughput from measurement consistency. Clean fluid paths, suitable fluid composition and detector controls address different parts of the experiment; a well-centered sample stream alone does not certify a quantitative fluorescence measurement.
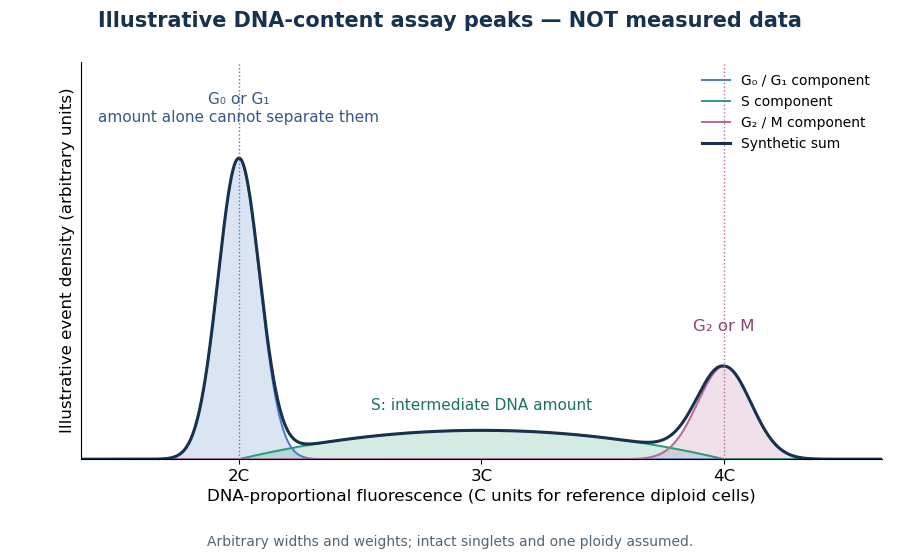
Under controlled staining and detector settings, integrated fluorescence can be approximately proportional to nuclear DNA amount. A histogram of accepted single-cell events then separates a region, an intermediate region and a region. These are ordinarily assigned to G0 phase/G1 phase, S phase, and G2 phase/M phase respectively in the stated diploid model.
A Cornell protocol fixes a single-cell suspension by adding cold 70% ethanol dropwise while mixing, reducing clumping. After washing, its staining solution contains propidium iodide at ; ribonuclease A removes interfering RNA. It specifies excitation at and emission around . The resulting readout is fluorescence per event, not a direct count of chromosomes. [ref]
DNA Cell Cycle Analysis with PI. DNA Cell Cycle Analysis with PI, p. 1: dye properties, staining steps 1–7 and reagent recipe
Useful controls include an unstained sample for background and a reference population with known nuclear DNA amount, processed with identical settings. Two attached biological cells can mimic one event. Comparing signal integral with pulse height or width helps exclude such doublets; a gate selecting intact single particles also limits debris. These are proposed assay checks, not measurements underlying the illustration.
A peak cannot distinguish G2 phase from mitosis; a peak cannot distinguish G1 phase from G0 phase. Mixed ploidy, uneven staining and aggregates can invalidate phase assignments. Peak areas describe the accepted sample at collection, and do not by themselves establish phase durations, division rates or a particular arrest mechanism. A treatment comparison needs matched handling and another readout appropriate to the claimed mechanism.
Articles by others on the same topic



Flow Cytometry Animation by StarCellBio (2015)
Source.