A lock-in amplifier measures the component of an input signal synchronized with a reference at a chosen frequency. It multiplies the input by a reference sinusoid, then uses a low-pass filter to retain the slowly varying product. Two references in phase quadrature recover both amplitude and phase difference. A shared timing source keeps the relative wave phase stable: this is coherent detection.[ref]
Model SR830 DSP Lock-In Amplifier manual by Stanford Research Systems. Model SR830 DSP Lock-In Amplifier manual, revision 2.5, printed pp. 3-1–3-2: multiplication, filtering, reference locking and dual-phase detection
The useful trick is to move the wanted frequency to zero before averaging. An electronic amplifier alone enlarges both the wanted signal and unwanted noise; a lock-in amplifier instead selects a component by its timing. A photodiode's electric current can first be converted to an electric potential difference, so the same calculation can measure weak modulated light. The chopped-light lock-in experiment makes this selection tangible.
phase-sensitive detection correlates an input with a synchronized reference and filters the product. Sinusoidal quadrature references recover both signal amplitude and relative phase. Narrow detection bandwidth rejects incoherent noise but cannot reject a background coherent at the same frequency; changing the integration time also changes settling and tracking speed.[ref]
Let the input electric potential difference be , with peak amplitude , angular frequency , and phase difference relative to . For an observation interval containing an integer number of cycles, each lasting one period of a function, , define the lock-in quadratures in a peak convention:These integrals average the products with dimensionless references and ; and have the input's units. The minus sign makes positive give positive . The trigonometric functions giveThe oscillating terms have zero integral over the stated interval, proving and . Their orthogonality turns an oscillating signal into two constant coordinates.
Represent those coordinates as a vector, or as the complex number . Its modulus and complex argument recover the peak amplitude and phase difference:Here selects the angle with the correct signs of both coordinates, rather than applying the arctangent to and losing the quadrant. When , the amplitude is zero and the phase difference is undefined. When , despite a nonzero signal; measuring prevents this blind spot. Rotating both references by a fixed angle rotates the coordinate vector but preserves .
The factors of two above deliberately recover peak amplitude. The SR830 instead reports the selected sinusoidal component in root mean square units: in a calibrated, zero-offset display, . For this is , while the peak-to-peak span of that component is . Display normalization, reference sign, gain and angle units must be checked for the particular instrument.[ref]
Model SR830 DSP Lock-In Amplifier manual by Stanford Research Systems. Model SR830 DSP Lock-In Amplifier manual, printed p. 3-3, “RMS or Peak?” and “Degrees or Radians?”; pp. 3-13–3-14, output scaling and display offsets
Consider this original constructed input electric potential difference, with in seconds and :The unwanted component has three times the reference frequency and more than twice the wanted peak amplitude. Nevertheless, the lock-in quadratures over are exactlyso and . This is a peak amplitude calculation, not an SR830 display prediction.
To see why the larger component vanishes, multiply by each reference:Each sinusoid has zero average value of a function over a whole reference cycle. More generally, a component with integer gives products at and , whose integrals vanish over any integer number of reference cycles. This is the orthogonality behind selecting a Fourier coefficient with sinusoidal references. A nonsinusoidal reference can contain additional frequencies and need not have the same rejection property.
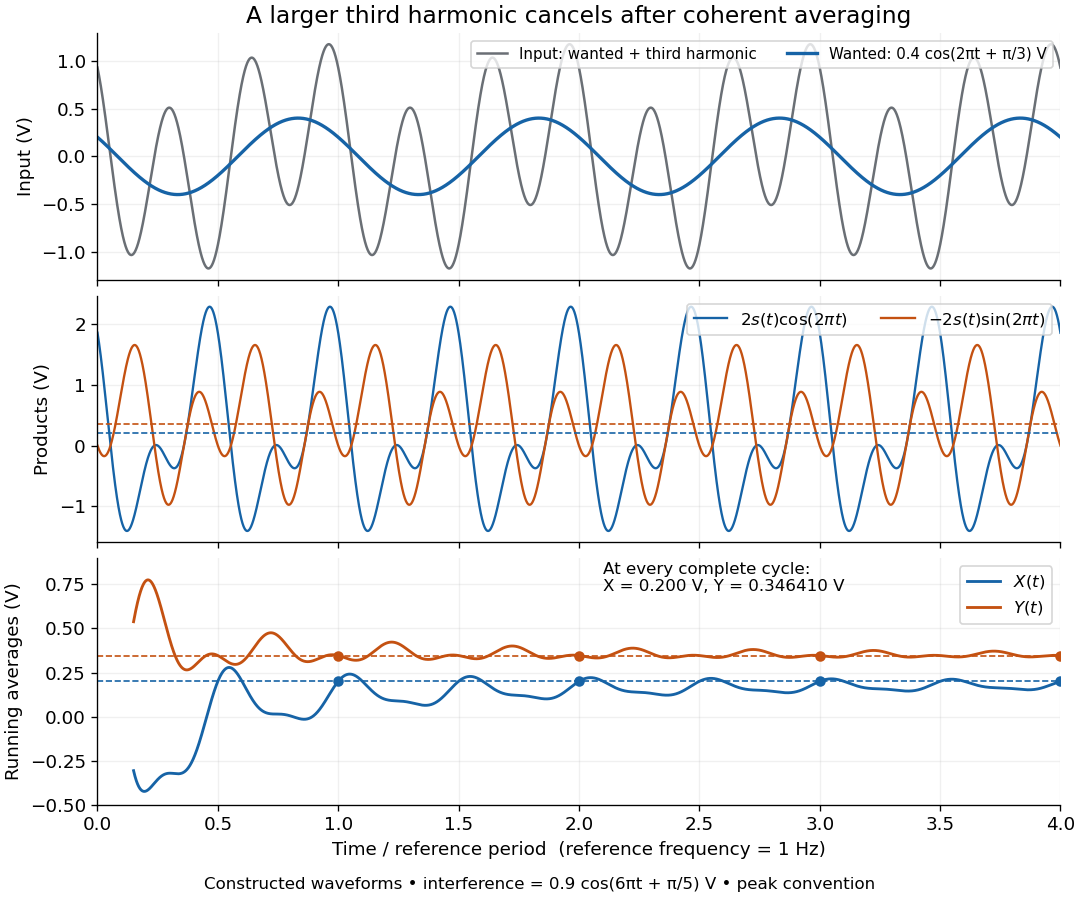

An unwanted component at the reference frequency survives. If is added to the input, its coordinate vector adds to the wanted one:For example, adding with to the wanted component gives , , , and phase difference . Longer averaging cannot separate these two synchronized contributions.
An observation interval of finite duration is not an infinitely sharp frequency selector. Combine the lock-in quadratures intoFor unwanted electric potential difference , where is an angular frequency offset and , expansion into complex exponentials gives the exact responseThe sinc function formula follows by integrating the exponential function and factoring ; its value at zero follows from a limit. The first term changes slowly after multiplication; the second oscillates at the sum frequency. It vanishes at exact matching when is an integer number of reference cycles, each lasting one period of a function, but cannot generally be discarded in a short-window calculation.
For and many reference cycles, the first term usually dominates: its modulus is and its complex argument includes . Thus gives almost no rejection. A longer observation separates closer frequencies, with the first zeros of this term at . Those zeros are not a brick-wall cutoff: the sinc function has nonzero lobes beyond them. At a synchronized contribution remains however large becomes.
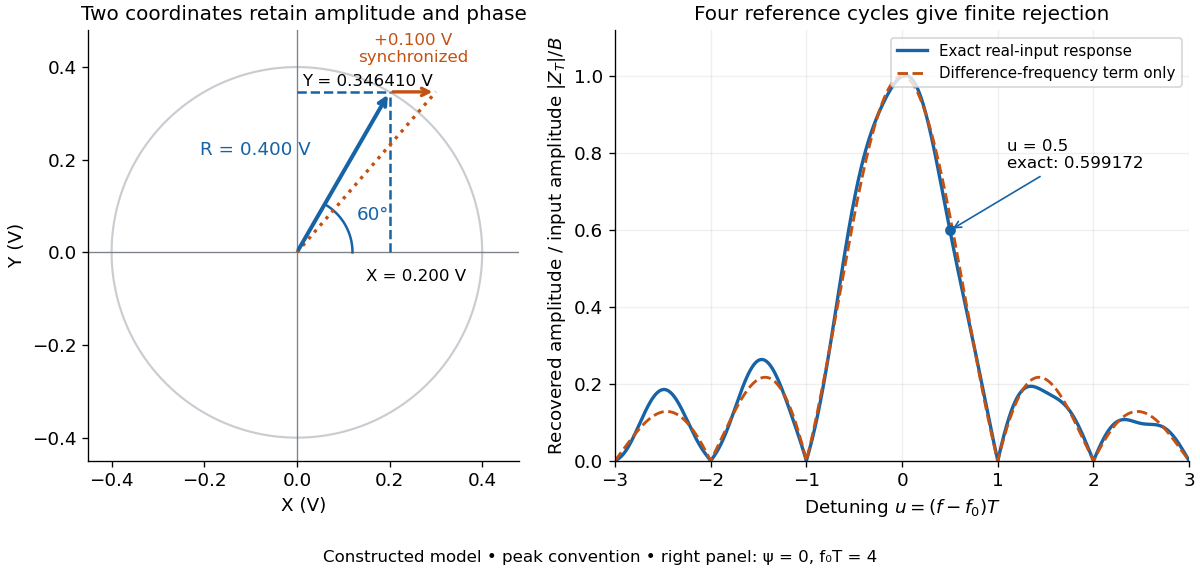

For a numerical check, use , , and an unwanted frequency . Then and the exact expression giveswhereas the difference-frequency term alone gives . An interference amplitude therefore contributes to in this constructed example. A nearby frequency can survive strongly even though the three-times-frequency component in lock-in harmonic rejection cancels exactly.
A practical lock-in amplifier's low-pass filter weights past products differently from this rectangular observation interval. Its time constant and roll-off determine near-reference rejection and settling time; narrowing detection slows the response.[ref]
Model SR830 DSP Lock-In Amplifier manual by Stanford Research Systems. Model SR830 DSP Lock-In Amplifier manual, printed p. 3-2, “Narrow band detection”; pp. 3-11–3-12, time constants and filter roll-off
The University of California, Berkeley guide LLS - Measuring the Light Signal from a Diode, in Experimental Setup and Experiments X–XI, documents an experiment using a red light-emitting diode amid room-light background. An optical chopper, controlled by an SR540, periodically interrupts its light. A PIN-10DP photodiode sends electric current to an SR570 preamplifier, which converts it to an electric potential difference for an SR760 spectrum analyzer and an SR830 lock-in amplifier. The SR540 supplies the external reference. Preparation includes aligning the photodiode and its shielding cone and choosing gain to avoid overload. One comparison first searches for the source frequency without the chopper reference, then checks against that external reference; switching off the LED tests the candidate spectral peak. The measurement procedure varies chopper frequency and preamplifier filtering, then records repeated lock-in readings with selected averaging settings. These are prescribed observations to make, not published numerical results.[ref]
LLS - Measuring the Light Signal from a Diode, University of California, Berkeley. LLS - Measuring the Light Signal from a Diode, Experimental Setup; Block Diagram I; Experiment X, steps 2 and 9–13; Experiment XI, steps 1–8
The guide notes nearly triangular chopping because slit and emitter sizes are comparable. Its interpretation requires detector conversion, preamplifier gain and waveform geometry to infer optical power from the selected component.[ref]
LLS - Measuring the Light Signal from a Diode, University of California, Berkeley. Experimental Setup, waveform discussion; Interpreting the Data, points 1–3 and collection-geometry discussion
The inference is therefore specific: synchronized electric potential difference supports the presence of a modulated optical component at the reference frequency. It does not by itself give total emitted optical power. The photodiode's spectral responsivity, collected fraction of the light, and conversion from the measured Fourier coefficient to the chopped waveform must enter that calibration. The finite-window lock-in response also explains why a frequency-search reading can drift when the reference is not synchronized. An LED-off comparison tests background at the same timing; it cannot guarantee that every synchronized disturbance disappears when the desired source is present. Overload before multiplication destroys information that later averaging cannot restore.
Articles by others on the same topic
There are currently no matching articles.