Put and . The characteristic roots are . For release from rest at displacement , the three regimes areunderdamping produces decaying oscillations; critical damping is the repeated-root boundary; overdamping has two real decay rates. The critical and overdamped curves from rest approach equilibrium without crossing it. All three initially have zero slope and negative acceleration. A sufficiently strong initial kick can cause a single crossing even without an oscillatory mode.
For the critical oscillator with initial velocity , the repeated-root solution isIts exponential is positive at finite time. Therefore the bracket has a positive-time zero precisely whenEquality gives a pure positive exponential and no finite-time crossing.
For the specified numerical oscillator, and , verifying overdamping. Its two roots are and in inverse seconds. The initial conditions givewith in seconds. The slow component has a negative coefficient; the fast positive component initially dominates.
The values for the requested plot areThe curve crosses near and then returns toward zero from below. The exact expression provides a check on the graphical estimate:
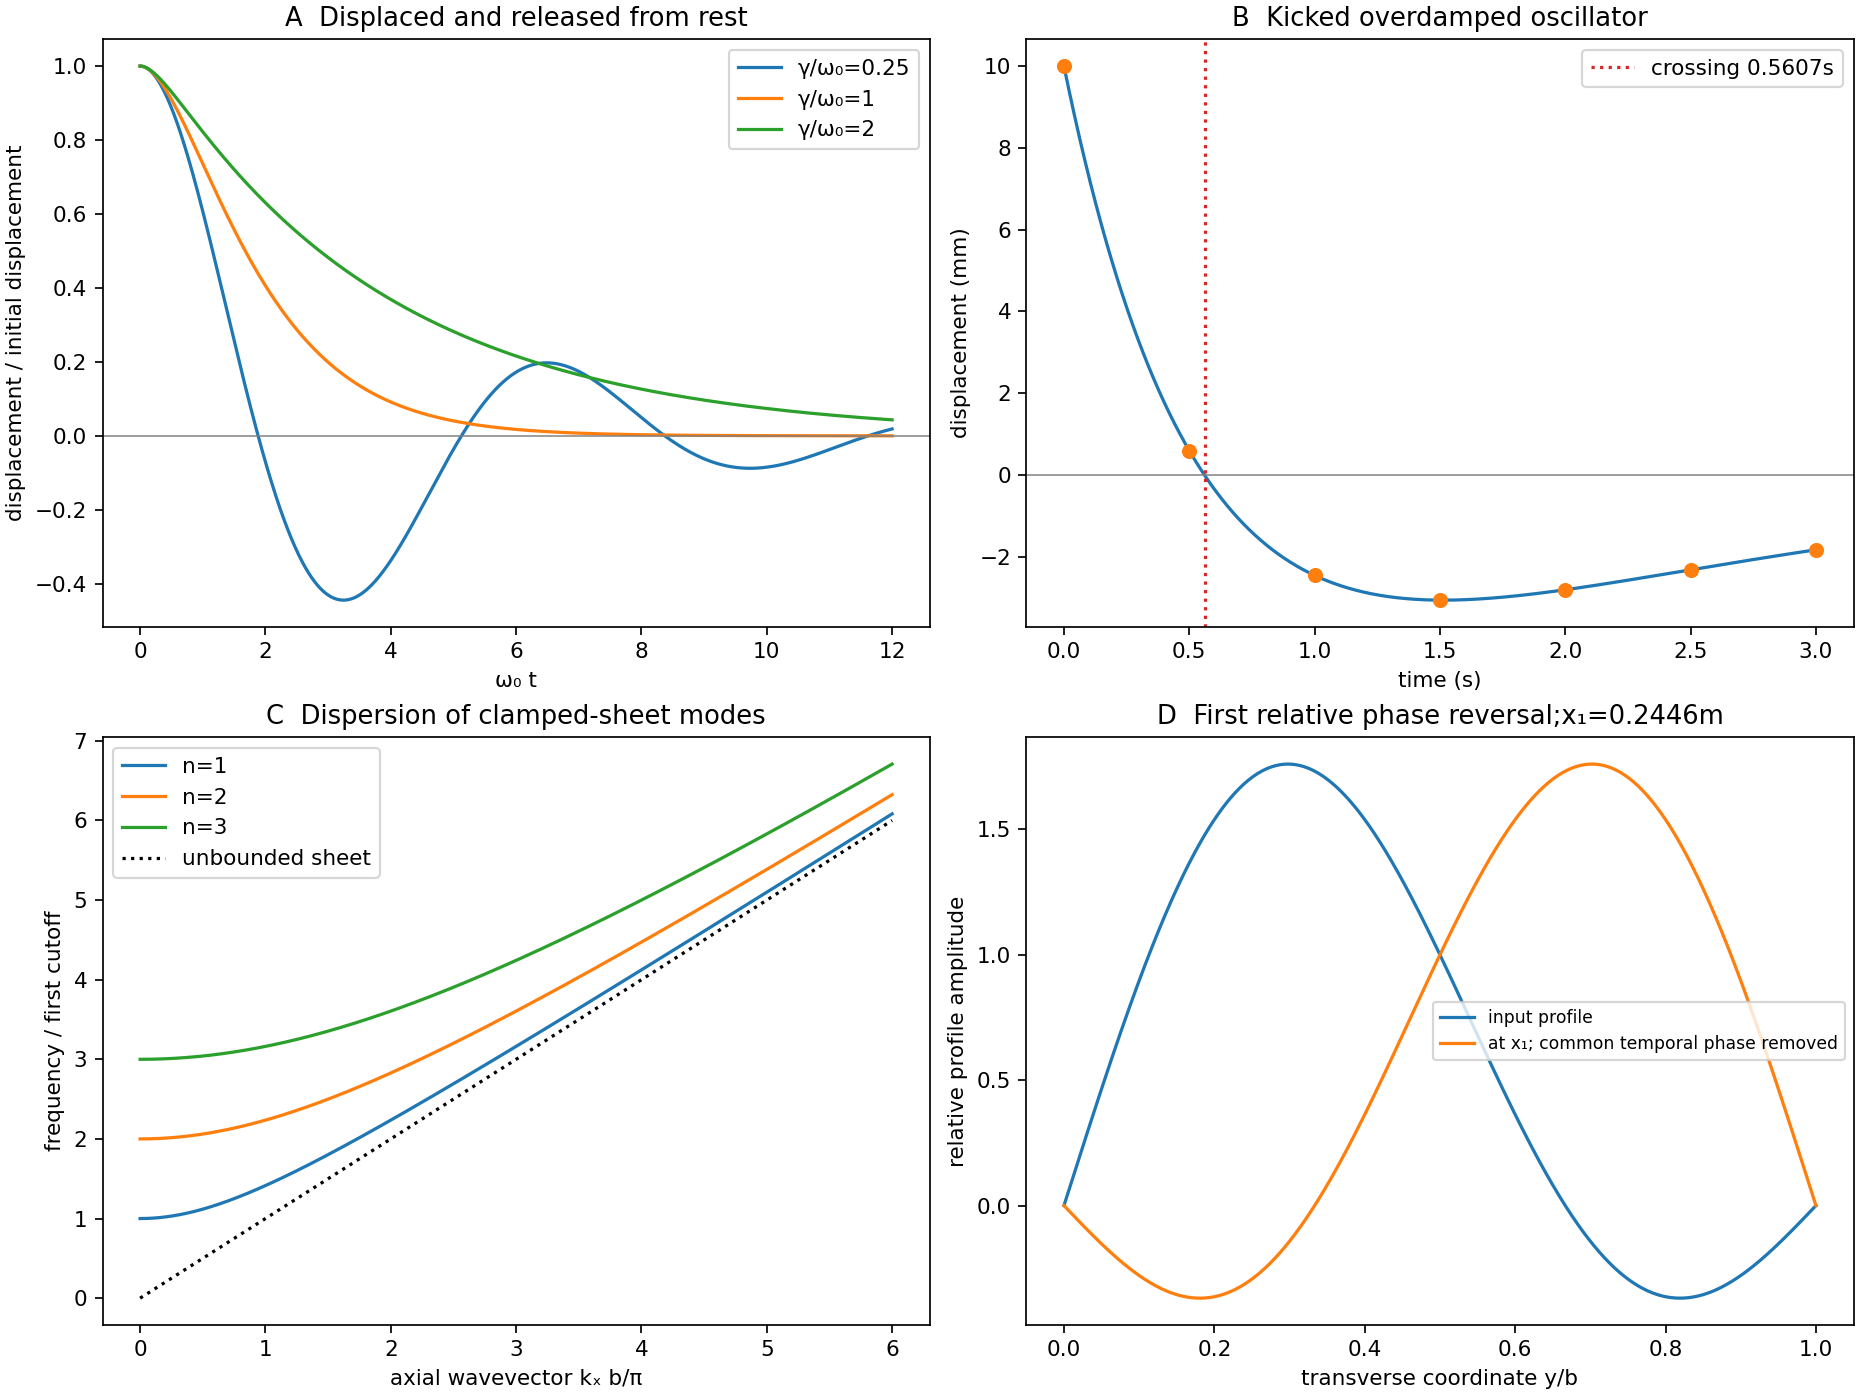

For a uniform taut sheet in the small-displacement approximation, the two-dimensional wave equation isSeek a harmonic solution . The clamped edges impose Dirichlet boundary conditions . Hence has nontrivial solutions only forTaking the real part gives the stated sinusoidal transverse profile. There is no nonzero mode satisfying both clamped boundaries.
Substitution gives the dispersion relationThe three branches have cutoffs at and approach at large . Only frequencies above a branch's cutoff give traveling waves along an infinitely long guide; below it, the axial dependence is evanescent. For a forward propagating mode,The phase velocity exceeds , while the group velocity is smaller: the carrier phase speed is not the signal speed.
Here the first two cutoff frequencies are and , so both modes propagate at . With ,Each transverse mode independently acquires its axial phase. The second mode first changes sign relative to the first when , givingAt that distance a common temporal phase is modulo ; the second term is negative relative to the first for every and every time, not just at one selected instant.
In an optical fibre, different guided modes have different group velocities, so an input pulse becomes a sum of differently delayed pulses. This intermodal dispersion broadens pulses and can make adjacent digital symbols overlap. A single-mode optical fiber removes this particular mode-delay mechanism; a graded-index optical fiber can reduce it in a multimode design. Single-mode propagation still permits wavelength-dependent group delay, so it does not remove every kind of optical dispersion.
The Fourier expression is the scalar Fraunhofer diffraction approximation for coherent, effectively monochromatic illumination with a uniform incident plane wave over the aperture. At a distant screen the aperture-dependent quadratic propagation phase must be negligible, roughly for transverse size . Alternatively, a thin lens forms the angular Fourier transform in its back focal plane. That focal-plane construction is the appropriate one here; the aperture-to-lens distance need not itself be an enormous free-propagation distance. aperture features should be large compared with wavelength for this simple scalar transmission-mask model.
If complementary transmissions are and , linearity gives . Away from the undiffracted forward beam, the uniform plane-wave contribution vanishes in angular space, so and their intensities agree. This is Babinet's principle. It equates the off-forward diffracted intensities, not the transmitted power or the on-axis intensity including the direct beam.
Let be screen coordinates conjugate to aperture coordinates , so , . With width along and height along , define . The complementary rectangle has transformThus the obstruction's off-forward scattered component hasIts dark lines occur atThe central-lobe zero-to-zero size is by ; it is wider in the direction conjugate to the narrower obstruction. The central forward image of the illuminating beam must be distinguished from this scattered envelope in a real screen observation.
The source figure gives centre-to-centre separation . Choose the three rectangle centres at ; an overall translation changes only the transform phase. Their scattered amplitude is proportional toThereforeAlong the screen's direction, the three-element interference factor has principal maxima separated by , under the single-rectangle envelope. Its zeros lie at and . It also has weaker secondary maxima between principal orders. Every fifth principal order coincides with a single-rectangle zero and is missing; multiplication by the envelope slightly shifts maxima away from the nominal interference-factor positions. The figure plots the calculated scattered component and marks the separate direct-beam limitation.
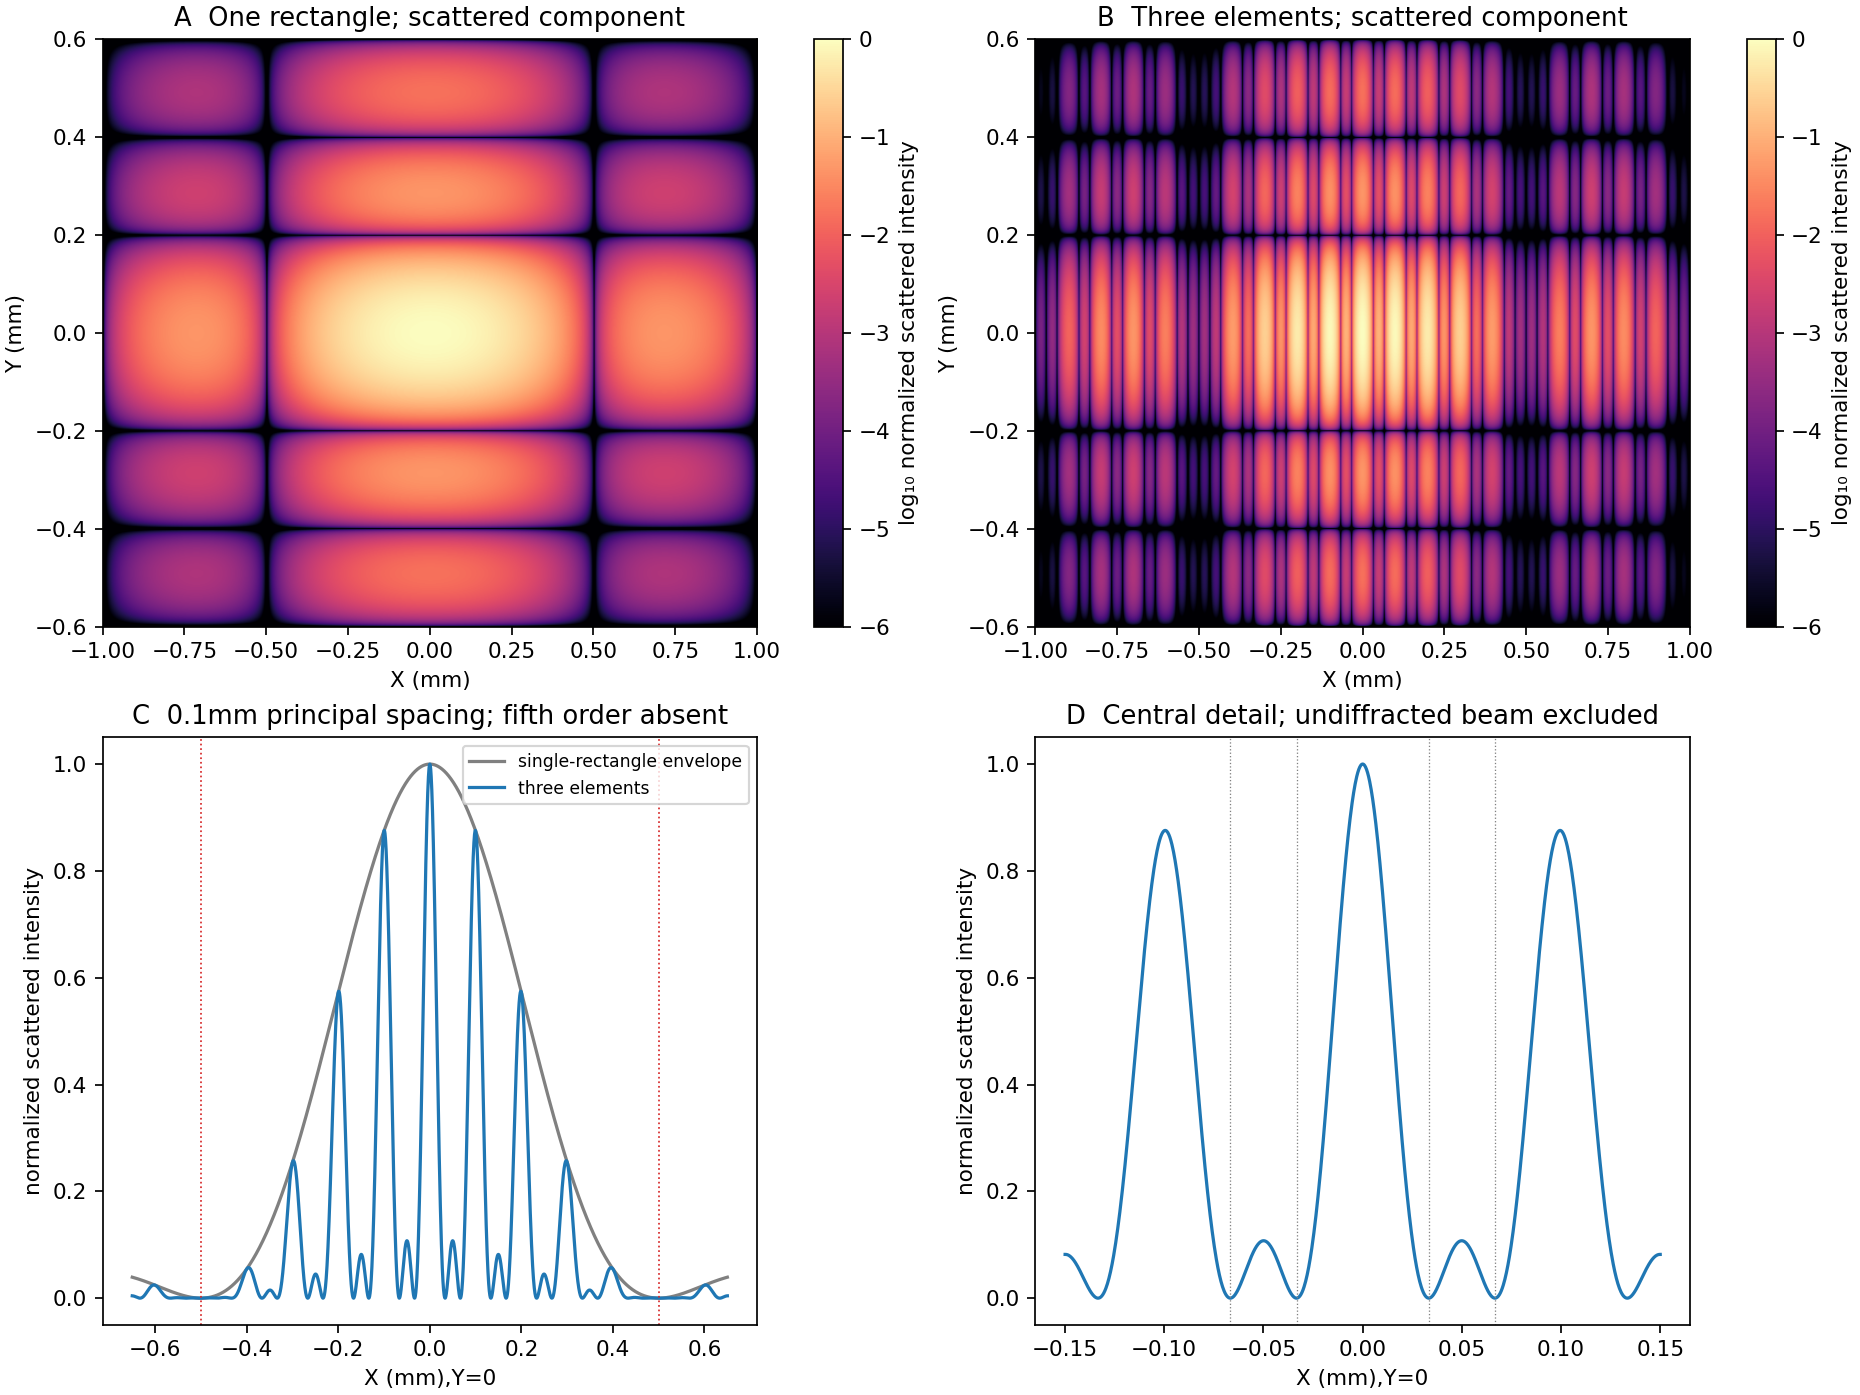
Original calculated rectangular-obstruction and three-element Fraunhofer scattered intensities
. Screen coordinates are physical conjugates of the obstruction coordinates. All plotted values describe the scattered component; the unresolved undiffracted illumination at the origin is excluded. Intensities are normalized, and no source figure is reproduced. Details.
Let the first transmitted complex amplitude be : two amplitude transmission factors each of magnitude give magnitude . Each extra internal round trip adds two amplitude reflections, with combined magnitude , and phase . With the mirror phase convention already incorporated in the stipulated ,Taking the squared modulus givesIt is , not , that multiplies the field after a round trip; would be the corresponding round-trip intensity fraction.
At resonance , . If is the positive phase displacement to half maximum,For , the stipulated high-reflectivity approximation gives , while the exact value is . The full width is twice this value. With , , and the pattern repeats every . Its ideal finesse is approximately .
A wavelength component resonates at . Within the scan interval, the individual resonances areNo neighboring orders of these lines fall within the stated interval. The observed signal is the sum of their two Airy transmissions, since different spectral components add intensities. Individual resonance positions identify the two peaks to the plotted precision; the tails cause very small shifts of the maxima of the sum.
The gap-coordinate full width isThe separation is , about full widths, so the two components can be resolved by the ideal etalon. The equivalent wavelength resolution near order is about , smaller than their separation.
The added wavelength has an order- resonance atIt lies between the preceding two peaks; its adjacent orders are outside the scan. Its input strength was not specified, so the third peak's height cannot be uniquely assigned. The original plot uses equal strength only as a declared illustration.
This is an order-identification problem: the free spectral range near is . A line more than one free spectral range away can appear among peaks of another order. A lower-resolution prefilter or additional dispersive spectrometer is needed to identify the order; a narrow peak alone does not identify an absolute wavelength. mirror parallelism, beam collimation and detector angular acceptance must also be controlled before attributing a measured width entirely to reflectivity.[ref]
Fabry-Perot Interferometer, University of Washington Physics 331. pp.2–5, instrument finesse and free spectral range; central-spot scanning discussion
Articles by others on the same topic
There are currently no matching articles.