A lies on the continuation of the offset outside the two ridge tips: it is the fracture zone, whose two sides are carried in the same overall plate direction. A bathymetric step can remain because the two sides have different ages and thermal histories, without continuing plate-boundary strike-slip faulting.
B is the black segment connecting the two white spreading ridges. Construct the plate motion from divergence away from those ridge axes. Between their tips, the upper side of B belongs to the plate west of the right-hand ridge and moves approximately west-northwest; the lower side belongs to the plate east of the left-hand ridge and moves approximately east-southeast. Looking across B from either side, the opposite side moves to the observer's left. B is therefore a left-lateral strike-slip faulting on a transform fault. The offset preserved outside the active segment must not be read as the sense of present slip.
The grey arrows in the source image are pointers to detachment faults, not plate-motion vectors. The original publication identifies white lines as spreading ridges, black lines as transform faults, and arrows as pointers to detachments. Its Figure 1b is the unlettered source of the exam's Figure 3.[ref]
C lies on the white spreading ridge extending down from the left-hand ridge-transform intersection. Relative motion there is extensional, so its tectonic faults have normal slip. Dike intrusion also accommodates extension at a spreading ridge; “normal slip” is the appropriate category among the four offered, not a claim that all spreading is achieved by a single normal fault.
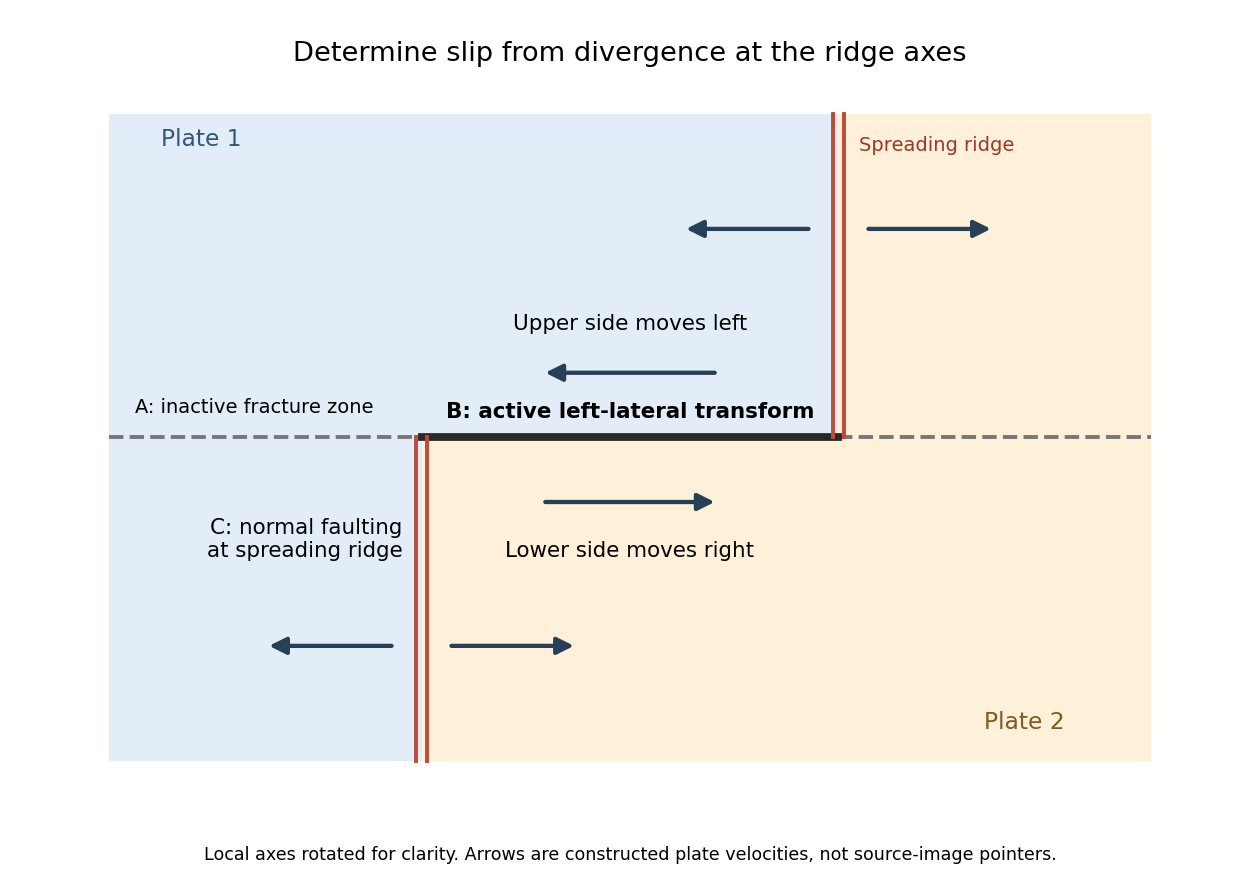
Why the active transform in the supplied geometry is left lateral
. Original idealized plan-view construction using the supplied ridge arrangement and relative motion directions. It illustrates the kinematic test, rather than reproducing the exam bathymetry. Details.
Probably yes in connected fractures or transiently opened pore space, especially where a transform fault admits circulating seawater; a uniform water-filled porous layer several kilometres thick is not guaranteed. Porosity and permeability of a porous medium generally decrease as cracks close or seal, while ongoing faulting can reopen pathways. Fluid can occur at high pressure and temperature, including a supercritical state; it need not resemble cold surface water.
Several complementary tests address presence and origin:
- Geological: recover fresh cores or dredged fault rocks. Hydrous alteration assemblages, veins, serpentinite replacing peridotite, and altered gabbro record water-rock interaction. Sealed fluid inclusions can preserve former fluids. These establish fluid access in the past; they do not by themselves demonstrate currently connected free pore fluid.
- Geochemical: analyse sampled fluids and fluid inclusions for salinity and chlorine, oxygen and hydrogen isotope ratios, and strontium or boron isotope ratios in alteration products. Compare with seawater, host rocks, and possible magmatic or metamorphic sources. A seawater-like input modified systematically by water-rock interaction supports deep circulation from the ocean. Exchange, isotope fractionation, mixing and phase separation mean that altered fluids need not retain the exact surface composition.
- Geophysical: combine seismic tomography, Compressional-to-shear wave speed ratio and seismic attenuation with magnetotelluric sounding or controlled-source electrical measurements. A connected saline fluid network can reduce electrical resistivity and change elastic wave speeds. Sample hydrothermal vents, measure heat flux and, if drilling is possible, make direct pore pressure and permeability measurements.
No one anomaly uniquely identifies water. Seismic velocity can also reflect cracks, composition and temperature; electrical conductivity can reflect melt or conductive minerals. Serpentinization demonstrates incorporation of water into minerals, which must be distinguished from fluid currently occupying pore space. At an oceanic transform fault, an external seawater supply is the natural first hypothesis, but isotope ratios and chemical budgets can test contributions from deep fluids rather than presuming the source. A research example of coupled deformation and hydrothermal alteration is Mass transfer and fluid flow during detachment faulting and development of an oceanic core complex, Atlantis Massif by Chiara Boschi and others; a detachment system illustrates the methods without proving identical flow at every transform fault.
Cooling makes the oceanic lithosphere denser and contracts it; isostatic adjustment therefore lowers the seafloor. The cooling layer includes substantial mantle, not just the approximately fixed-thickness igneous oceanic crust.
New plate near a spreading ridge is hot and relatively buoyant. As it moves away, conductive cooling penetrates more deeply, and material formerly in the hot asthenosphere becomes part of the colder thermal boundary layer. To first order,where is the volumetric thermal expansion coefficient, a reference mantle density, the hot reference temperature, and plate age. A positive depth-integrated density anomaly makes the column negatively buoyant relative to the ridge column. Isostasy is restored by downward displacement and mantle redistribution; cold rock also occupies less volume.
At a fixed sufficiently deep datum, deepening the seafloor by removes an equivalent thickness of rock from the column and replaces it with less dense seawater. In the usual constant-property approximation this giveswhere is seawater density and lies below the relevant thermal anomaly. This explains why contraction alone and water-loaded seafloor subsidence are not identical numerical quantities.
For a half-space cooling model,so integration yieldsHere is thermal diffusivity and is measured downward from the surface of the thermal model. The leading oceanic thermal subsidence is proportional to . A finite oceanic plate cooling model limits this growth at old ages. Sediment loading, dynamic topography, anomalous crust thickness and hydrothermal heat transport can produce departures from the simple relation.[ref]
Choose a common horizontal compensation depth beneath the deepest cooling-induced density anomaly, within mantle that can relax pressure differences over the timescale considered. In a normal oceanic plate model, this means below the old plate's thermal lithosphere, not at the base of the approximately 7 km thick oceanic crust.
The reason is that cooling changes density through both crust and lithospheric mantle. A datum at the Mohorovičić discontinuity would omit most of the changing column mass. A different datum for each age would also compare unlike columns. Once the common datum is sufficiently deep, extending it farther into laterally uniform mantle adds the same mass per unit area to each column and does not change the predicted relative subsidence.
There is no unique number fixed by the question. For an illustrative oceanic plate cooling model with a thermal thickness about 100–125 km, a common datum beneath that layer, of order 150–200 km below sea level, is a defensible choice provided the model has no substantial lateral density anomaly there. These are model choices, not measured universal boundaries. In a half-space cooling model, use the oldest age to choose a practical cutoff: makes the remaining temperature anomaly less than about 0.5% of its surface contrast. For and million years, this is about 225 km. A half-space model has no mathematically sharp finite thermal base.
Finally, equal column mass is the local, approximately constant-gravitational acceleration representation of equal pressure at the datum. A weak asthenosphere permits pressure relaxation through slow solid-state material creep; it need not be liquid. Short-wavelength loads, lithospheric flexure or dynamic topography can violate local column-by-column isostasy, requiring a more complete mechanical model.
I would not assign the lunar mare an automatic terrestrial 100–125 km compensation level. For present-day mare basins, a local equal-column-mass model may have no physically valid compensation depth; first test whether lithospheric flexure supports the load. For ancient thermally driven subsidence that did relax, choose a common datum beneath the cooling layer in deformable lunar mantle appropriate to that epoch.
The Moon is smaller than Earth and has lost a larger fraction of its original heat. Its cold, mechanically strong outer shell can be much thicker relative to its radius than the terrestrial oceanic lithosphere. Lunar mare basalts filled pre-existing impact basins: their loading, basin excavation, mantle uplift, cooling and the evolving strength of the lithosphere all matter. A thick elastic lithosphere can support lateral stress differences, so equal column mass need not hold even after a long time. The strong gravity anomalies of lunar mascons, measured by GRAIL, are evidence that the present mare-basin system is not everywhere locally compensated.[ref]
For an explicitly assumed ancient relaxed thermal model, estimate its thermal penetration depth from thermal diffusivity and the elapsed cooling time, infer the contemporaneous mechanical lid from gravity-topography admittance or basin deformation, and place below that layer where lateral pressure anomalies relax. For example, a hypothetical several-hundred-kilometre-thick lid requires a deeper datum than that lid, not the shallow crust-mantle boundary. The paper supplies neither an epoch-specific thermal model nor a load wavelength, so a unique kilometre value is not determined. If the chosen datum is a substantial fraction of the lunar radius, spherical geometry and radial variation in gravity must replace the flat, constant-gravity column approximation.
Does the Moon have an asthenosphere? Not a demonstrated shallow, globally connected Earth-like layer underlying mobile plates; but “no weak or partially molten mantle anywhere, ever” is too strong. Apollo lunar seismology indicates a cold outer interior and more attenuating deep regions. Reanalyses support a deep low-velocity or partially molten region near the lunar core, while lunar laser ranging and tidal Love numbers constrain deep deformability and tidal dissipation. Such a deep weak region is sometimes called a lunar asthenosphere; it is not automatically the correct local compensation surface for a mare load.[ref]
The inferred melt fraction and distribution remain model dependent: Dissipation at tidal and seismic frequencies in a melt-free Moon by Francis Nimmo and others demonstrates that much of the dissipation can also be explained by hot solid-state anelasticity, although its model does not reproduce every frequency-dependent constraint. The Moon was hotter during mare emplacement and could relax loads differently then. Choose the datum from the relevant thermal and mechanical history, or use a flexural model when local isostasy fails.
Articles by others on the same topic
There are currently no matching articles.