Scanning tunneling microscopy uses a scanning tunneling microscope to map a surface from the electric current across a tunnel junction. In constant-current operation, feedback control adjusts the tip height to maintain a chosen electric current. The current-distance test of vacuum tunnelling explains the underlying distance sensitivity and its measurement limits.
The image records the response of a tunnel junction, rather than photographing chemical atoms. Its apparent height can reveal both surface structure and the local density of states; distinguishing them is part of interpreting the measurement.[ref]
Scanning Tunneling Microscopy: From Birth to Adolescence by Gerd Binnig and others. p. 391, Fig. 2; p. 396, Fig. 5
Controlled positioning or modification of individual surface atoms or molecules, including manipulation with a scanning probe. A weakly coupled imaging pass locates the adsorbate; stronger tip interaction or suitable excitation changes its motion or binding. Subsequent imaging checks the result. Temperature, substrate, tip state and atomic species determine the useful mechanism.
A deliberately assembled xenon-atom surface pattern illustrating controlled atomic manipulation. Don Eigler and Erhard Schweizer reported individual xenon positioning on single-crystal nickel at about in their 1990 paper.[ref]
Transferring an adsorbate between substrate and probe tip, allowing pickup, lateral repositioning and deposition at a selected site. Its feasibility depends on the tip and substrate binding landscapes and on the controlled excitation.
Moving a surface adsorbate between lateral positions by coupling it to a nearby scanning-probe tip and moving the tip parallel to the surface. Pulling, pushing and sliding depend on the competing tip–adsorbate and substrate interactions.
A conducting tip probes the energy-dependent local density of states by recording tunnel current versus applied bias, often measuring with a small bias modulation and lock-in detection. At low temperature and for slowly varying tip density and matrix element, is proportional to sample local density of states at the corresponding bias energy. Thermal broadening, surface structure and energy-dependent tunnelling selectivity limit a direct interpretation as bulk band structure.
Interference between incident and elastically reflected surface-state waves gives density oscillations proportional to . Their real-space period is , half the travelling-wave wavelength.
Low-temperature scanning tunneling spectroscopy resolves energy-dependent interference in the surface electronic density of states near scattering features. Its coexistence with a structural map distinguishes electronic corrugation from atomic positions. The 1993 Cu(111) observation provides an early example.
Vibrational excitation opens additional tunnelling channels at biases satisfying . A step in differential conductance gives paired opposite-sign features in its voltage derivative.
In the 1982 experiment, separate drives using piezoelectricity scanned a metal tip laterally and adjusted its height. A control unit held electric current fixed at constant tip-sample electric potential difference; calibrated drive voltages supplied the displacement readout. Their Fig. 1 explicitly contrasts a surface step with apparent height from contamination changing the work function.[ref]
Surface Studies by Scanning Tunneling Microscopy by Gerd Binnig and others. pp. 58–59, Fig. 1, equation (1), piezodrive calibration
Gerd Binnig and Heinrich Rohrer describe a later vibration isolation system using two spring stages and eddy current damping inside a vacuum chamber, with sputtering and annealing for surface preparation. These measures addressed unwanted motion and surface condition separately.[ref]
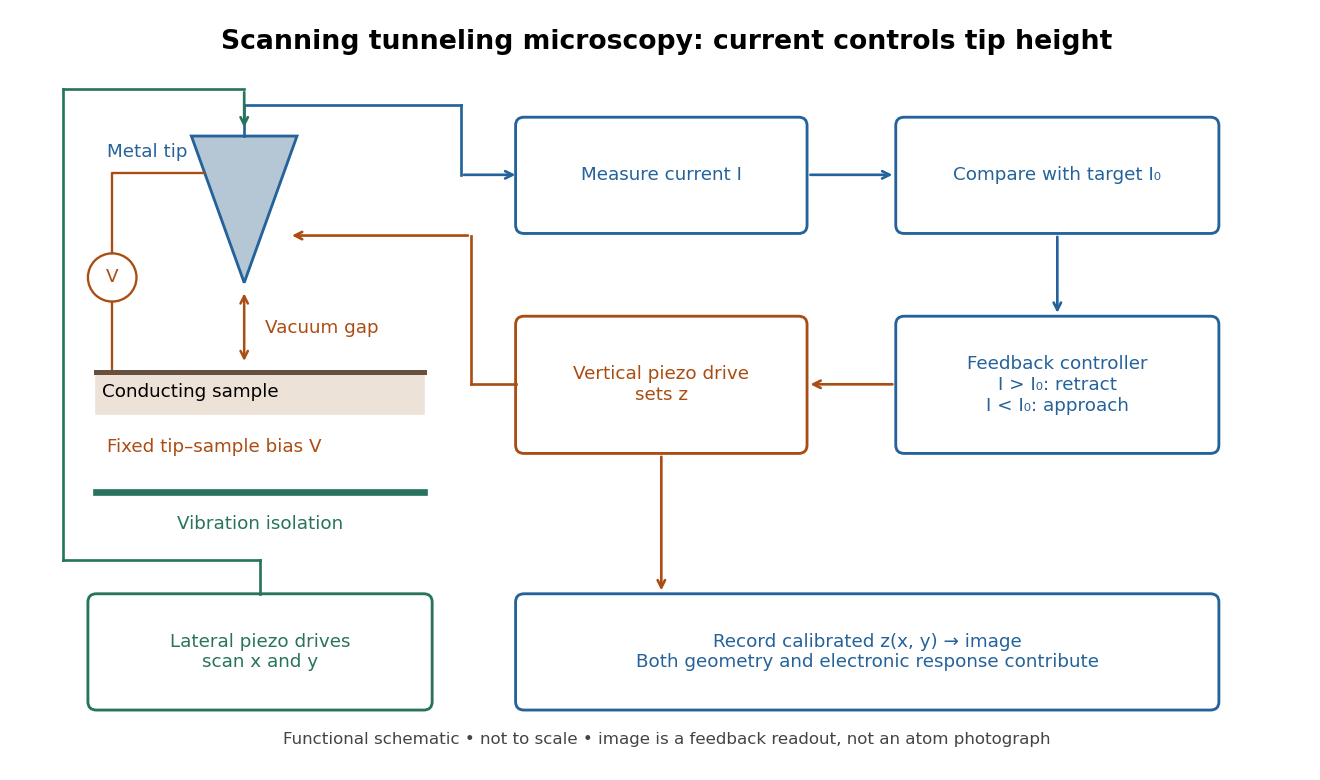

Choose a fixed tip-sample electric potential difference and a positive target electric current magnitude . At each lateral position , feedback control adjusts until the measured electric current approaches . Since increasing the gap reduces quantum tunnelling, excessive electric current calls for retraction; insufficient electric current calls for approach. The image is the calibrated vertical displacement , while the residual electric current error tests how closely the loop followed its target.
This is a contour of equal electric current, not necessarily a contour of equal separation. The electronic contrast in scanning tunneling microscopy model below shows why. It also explains the value of vibration isolation: an unintended displacement changes the same sensitive gap as the feature being measured. A scan must be slow enough for the finite bandwidth of feedback control; otherwise lags the desired contour.
Separate geometry from electronic response in an original one-dimensional toy tunnel junction. Write the geometric surface height as , tip height as , and positive gap as . Assume low fixed tip-sample electric potential difference: the sampled energy window is narrow enough that the tip density of states is featureless and the sample local density of states varies little across that window. Neglect thermal broadening, changes of tip shape and lateral averaging. Let be the effective sample local density of states divided by a positive reference value, so it is dimensionless. Choose a spatially constant effective barrier energy , a positive coefficient with units of electric current, andHere is the electron mass, the reduced Planck constant, and the tunnelling decay constant. This is an illustrative low-bias model, not a universal calibration formula. At fixed , taking a logarithm givesThe logarithms have dimensionless arguments. Only constant makes the recorded height differ from geometric height by a constant. Multiplying by raises the apparent height by without moving the geometric surface.
For a concrete ambiguity, choose , , lateral period , , and . CompareBoth produce exactly at . Substitution checks this without identifying with geometric height: case A has constant gap , while case B has gap and a compensating electronic factor. The chosen ranges from to , approximately to ; every gap remains positive. The chosen corresponds to electronvolts, a positive effective barrier.
At fixed tip height , both cases instead giveTheir maximum-to-minimum electric current ratio is . Thus even adding this fixed-height scan at the same electric potential difference cannot distinguish these deliberately chosen surfaces within the toy model. Independent structural information or additional electronic measurements are required. Changing electric potential difference can supply such information, but also changes the assumptions used to define and .
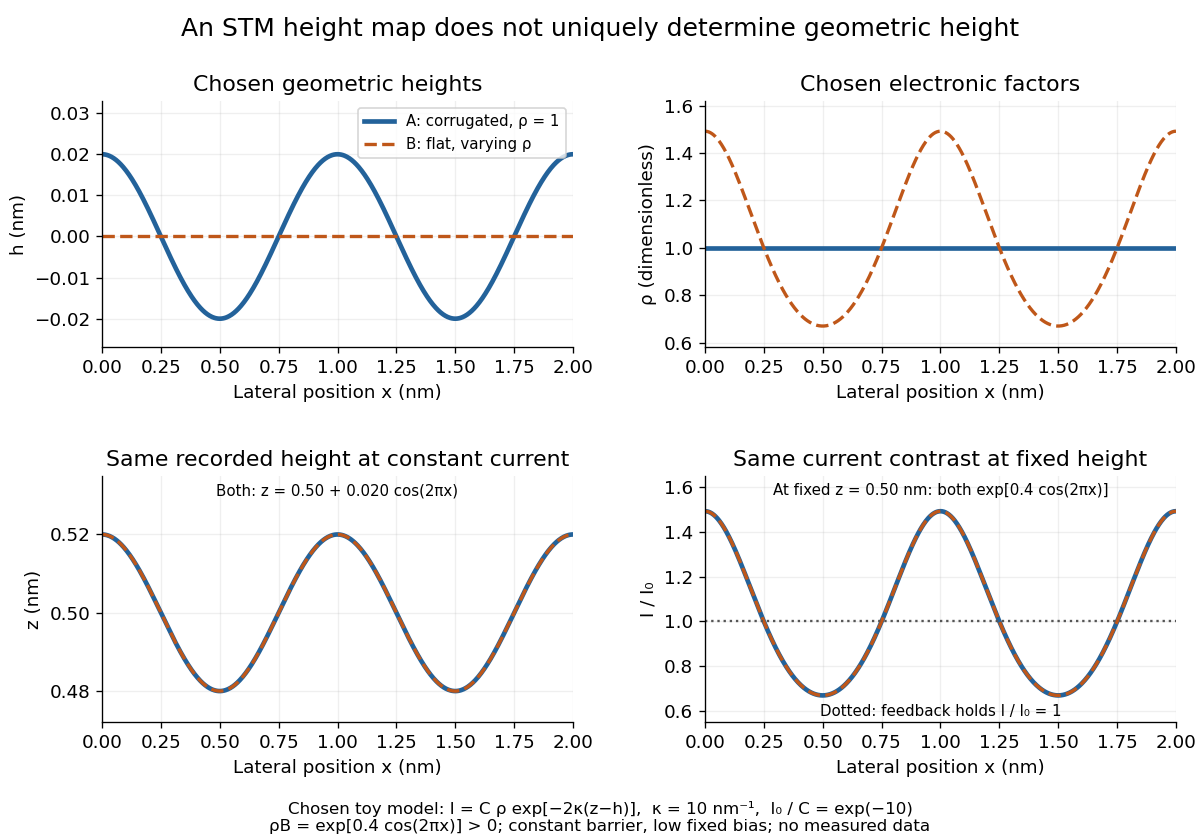
Different geometric and electronic profiles can produce the same STM image
. Original toy calculations, not measured data. The corrugated surface with constant local density of states and the flat surface with varying local density of states give identical recorded heights under constant-current scanning tunneling microscopy. They also give identical fixed-height electric current contrast at this chosen bias. Details.
For gold (110), the 1982 paper compared an untreated surface with one prepared by argon sputtering and annealing. Repeated cleaning reproduced the corrugation; the gap-modulation signal checked work function variation. This supported a structural interpretation while exposing the danger of confusing work function contrast with geometric relief.[ref]
Surface Studies by Scanning Tunneling Microscopy by Gerd Binnig and others. p. 59, Au preparation, repeated cleaning and modulated signal
The authored lecture describes resolving the surface reconstruction on gold (110), alongside ribbons of other periodicities. It also reports gold transfer to the tip on contact and fluctuating resolution, attributed tentatively to migrating tip chemical atoms. The probe could change during observation: an image was evidence requiring controls, not an unambiguous map of atomic positions.[ref]
Scanning Tunneling Microscopy: From Birth to Adolescence by Gerd Binnig and others. pp. 398–399, Au(110) reconstruction, tip coating and changing resolution
Articles by others on the same topic
There are currently no matching articles.