A symmetric beam-radius perturbation for overlap branch selection compares two controlled settings of one Gaussian beam radius: and , with known . Under the centred, matched-wavefront curvature model of reciprocal size-ratio ambiguity in centred Gaussian overlap, writeThe hyperbolic secant form makes the symmetry explicit: the two settings evaluate the same even function at and . Their ordering identifies the sign of , as shown in branch selection by a controlled beam-radius change.
An original extension removes an unknown common scale and recovers the radius ratio itself. Suppose the two measured positive efficiencies satisfyThe factor is a shared multiplicative nuisance parameter, such as an unchanged response normalization. The symmetric log-overlap ratio eliminates it exactly:For the last equality, use the addition formula for hyperbolic cosine to write the fraction as , where . The defining logarithmic identity for the inverse hyperbolic tangent completes the derivation. Because , is positive for the initially narrower beam, negative for the wider beam, and zero at matching.
The inversion of a symmetric Gaussian overlap log-ratio now givesA finite radius ratio exists exactly when . This condition follows from ; equality is approached only as one radius ratio tends to zero or infinity. A measured log-ratio outside that interval has no finite solution in this ideal two-setting model.
For an original numerical example, take , true and unknown scale . The ideal readings are and . They give , recovering without supplying to the inversion. The physical bound is .
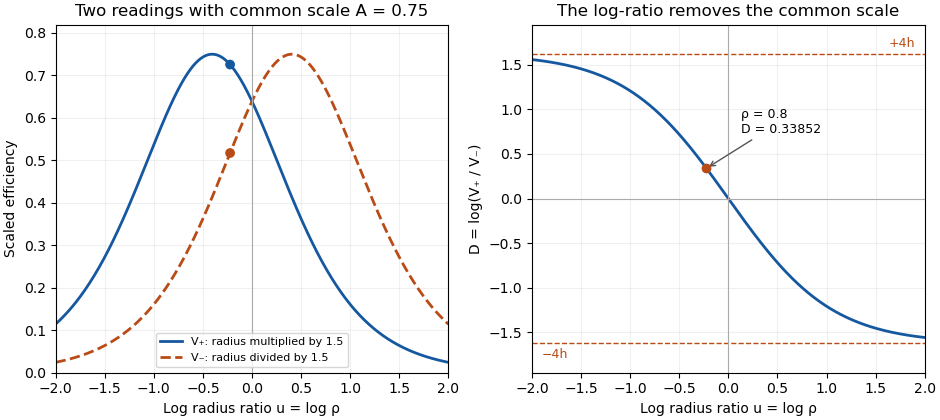
Two symmetric radius settings remove a shared scale and determine the signed Gaussian radius mismatch
. Original exact model with radius multiplier 1.5 and common efficiency scale 0.75. The left panel shows the two efficiency readings; the right shows their scale-independent log-ratio, its limiting bounds and the worked radius ratio 0.8. All curves are analytical model predictions. Details.
Finite measurement noise still limits branch selection. For small relative errors, the delta method givesA perfectly shared multiplicative fluctuation cancels sample by sample, paralleling common-gain cancellation in heterodyne overlap uncertainty. Independent relative standard uncertainties of in the two readings instead give . At the worked point, the derivative of the inverse gives , hence about relative standard uncertainty in . At exact matching the two branches coincide; a noisy sign cannot identify a distinct physical branch there.
These conclusions require and the other optical mode matching conditions to remain shared across the settings. Changing a lens can alter wavefront curvature and polarization as well as radius. NIST's physical heterodyne apparatus explicitly controlled polarization and spatial matching.[ref]
Frequency response metrology for high-speed optical receivers by Paul D. Hale and others. PDF p. 1, Heterodyne measurements
Larger radius changes may strengthen the log-ratio response while lowering either measured efficiency and changing its noise. Step choice therefore depends on the apparatus and noise model.A symmetric log-overlap ratio compares two measured Gaussian-beam overlap efficiencies after equal and opposite logarithmic changes of one radius. It removes a common multiplicative response scale and retains the sign of the initial radius mismatch.
In the centered, matched-curvature model, let , and . The two controlled settings have positive efficiency readingsHere and multiply the second radius. The readings are efficiencies proportional to squared field overlap, not field amplitudes. The shared nuisance scale cancels inUsing the addition formula for hyperbolic cosine, put and to obtainThus is odd in , positive when and negative when . Its finite-radius range is . As tends to either infinity, the ratio approaches a limiting value even though individual efficiencies can become very small.
The derivative makes the sensitivity explicit:At matching it is ; far from matching it approaches zero. A saturated log-ratio consequently supplies little information about additional radius mismatch.
For an original example, take , and . The positive setting gives , while the negative setting gives . Their log-ratio is , independent of the chosen scale. The allowed bound is . Taking logarithms of field-amplitude readings instead would give half this log-ratio.
A symmetric-overlap normalization drift breaks the simple cancellation: different scales add to the ideal . Interleave the settings and monitor conditions to test that sharing assumption. NIST's receiver apparatus explicitly controlled spatial mode and polarization, but did not establish this particular symmetric-radius diagnostic.[ref]
Frequency response metrology for high-speed optical receivers by Paul D. Hale and others. PDF p. 1, Heterodyne measurements
The displayed relations are model derivations whose use requires fixed displacement, wavefront curvature and polarization across both settings.Symmetric-overlap normalization drift is a time-dependent change in the multiplicative scale of two overlap readings. The symmetric log-overlap ratio cancels one shared scale, but sequential settings need not experience that same scale.
Let the stable optical contributions at the two radius settings be and , and letwhere . The ideal log-ratio is . A positive-setting reading at time 0 followed by a negative-setting reading at time instead gives . A drift in normalization can therefore mimic a signed radius mismatch.
An original four-reading design uses settings at equally spaced times . FormThe scale contribution vanishes exactly when is linear in time: both settings have the same mean observation time. This cancels linear drift in logarithmic scale, not arbitrary drift in every measured quantity.
If , the remaining drift contribution is . For stipulated , per time unit and , a simple two-reading comparison gives 0.03 under purely linear log-drift, while the four-reading design gives 0.05. Adding per squared time unit changes the latter to 0.056. These are analytical timing examples, not measurements from a beam experiment.
With independent equal log-readout variance , the four-reading estimator has variance , because it combines four coefficients of magnitude one half. A single two-reading difference has variance at half the acquisition count. Correlated noise and longer acquisition time can change the practical tradeoff.
State-dependent gain in symmetric overlap measurements does not cancel through this ordering. If the scale changes systematically with the radius-setting state, it remains confounded with . The optical mismatch must also remain stable over the sequence; a changing beam is not merely an electronic scale drift.
NIST controlled mode and polarization matching while calibrating the receiver's electrical response.[ref]
Frequency response metrology for high-speed optical receivers by Paul D. Hale and others. PDF pp. 1–2, Heterodyne measurements
The ordering above is an original drift-control calculation, not an attributed NIST procedure. Test its assumptions with timing records, repeated sequences and independent monitoring before feeding the resulting ratio into the radius inversion.State-dependent gain in symmetric overlap measurements is a multiplicative response that changes with the optical radius-setting state. It can imitate the radius mismatch inferred from a symmetric log-overlap ratio. An acquisition order that cancels time drift does not remove a scale change tied to the state itself.
For positive overlap readings, supposewhere is the true logarithmic radius ratio, is a fixed state-specific gain and is shared logarithmic drift. Even after perfectly removing , the measured log-ratio isHere describes the known symmetric radius settings. The two unknowns and cannot be determined from this one ratio without further information. This is an identifiability problem, not merely a larger readout variance.
For an original matched-beam example, gives . A state-gain ratio instead produces . With , ignoring the gain difference givesapproximately 0.98379. The apparently small radius mismatch is entirely instrumental in this stipulated example. Repeating the same states more often reduces independent scatter without removing the state offset.
A reference-state transfer in overlap normalization can supply additional information. If a reference has known and the same state-gain ratio as the specimen measurement, its observed log-ratio estimates . Subtracting that log-ratio is justified only if the state response transfers. Changing optical power, detector operating point or aperture illumination between reference and specimen can break that assumption.
Another explicit model uses a simultaneous monitor with the same constant in both states. Then , and the state difference cancels the monitored gain. A separate optical-power monitor does not automatically satisfy this equation for an RF-amplifier gain change: verify which part of the measurement chain the monitor actually samples.
NIST's primary receiver apparatus uses variable attenuators, a beam splitter, a polarizer and single-mode-fibre coupling to match the incident modes, followed by electrical calibration.[ref]
Frequency response metrology for high-speed optical receivers by Paul D. Hale and others. PDF p. 1, Heterodyne measurements
Those controls motivate distinguishing an electronic gain change from an optical change in polarization, clipping or beam shape. The reference and monitor designs above are original diagnostic models, not procedures attributed to that paper.Reference-state transfer in overlap normalization uses a known optical state to estimate a state-dependent instrumental offset, then transfers that correction to the specimen measurement. Its central assumption is that the relevant state-gain ratio remains applicable between the reference and specimen. Repeatability of the reference alone does not establish transfer.
Let , andSuppose specimen and reference observations satisfyWith known reference state , the corrected specimen log-ratio isThe residual is exactly the failure of the instrumental offset to transfer. Acquisition order can address time drift, but cannot by itself prove .
An original matched-state example has and . If the specimen's state-gain ratio differs from the reference's by , the corrected ratio still contains 0.02. Ignoring that residual gives an inferred radius ratio approximately 0.9917 instead of one. Repeating both measurements can reduce independent scatter while preserving that systematic offset.
Reference uncertainty must also propagate. Near a matched reference, . For , its magnitude is 2.4. A standard uncertainty 0.01 in the reference log-radius therefore contributes 0.024 to the corrected log-ratio before combining other errors. If the same reference estimate corrects many specimens, this uncertainty is shared; it does not become independent for each specimen. The GUM explicitly retains covariance from common references.[ref]
Operating-point transfer of an overlap reference requires checking the variables capable of changing the state response: optical power, detector bias, electronic range, frequency and illumination. A useful proposed test brackets specimen readings with reference readings and repeats the reference at several operating powers. A trend then tests a transfer assumption; an unchanged reference at only one power leaves power-dependent transfer untested.
NIST's receiver apparatus controls spatial mode and polarization with a polarizer and single-mode-fibre coupling, while separately calibrating the electrical response.[ref]
Frequency response metrology for high-speed optical receivers by Paul D. Hale and others. PDF p. 1, Heterodyne measurements
A reference must preserve the relevant optical and electrical conditions, or the analysis must model their differences. The transfer calculation above is an original diagnostic construction, not a claimed NIST protocol.Operating-point transfer of an overlap reference asks whether a state-dependent normalization correction measured under reference conditions remains valid at the specimen's optical and electrical settings. Detector bias, optical power, beat frequency, amplifier range and illumination can all define the operating point. Repeated readings at one setting establish repeatability there, rather than transfer over an untested range.
Let the true optical log-ratio be and the instrumental state offset at power be . A reference measurement estimates . Applying it to a specimen at leavesThis follows directly from reference-state transfer in overlap normalization. The difference between operating points is a measurement-model input, not extra independent readout noise.
An original local model writes . References at two powers support linear interpolation at an intermediate :The weights sum to one. A specimen outside the tested range requires extrapolation, which is more sensitive to model error.
Curvature error in overlap-reference transfer is visible in an exactly solvable example. If the true offset is linear plus , its difference from endpoint interpolation is . For powers 1 and 3 mW, suppose the measured endpoint offsets are 0.02 and 0.06. The interpolated offset at 2 mW is 0.04. A quadratic term , with powers expressed in mW, leaves both endpoints unchanged but makes the actual midpoint offset 0.03. Correcting by 0.04 then leaves a log-ratio error of . These are stipulated response values, not observations.
Reference uncertainty also transfers. At a fixed, known interpolation power,Here are standard uncertainties; uncertainty in requires additional terms. A shared calibration can correlate the endpoints, so their covariance should not be dropped merely because they were measured at different powers.[ref]
A useful proposed experiment brackets specimen acquisitions in time, samples several operating powers and repeats at the intended bias and frequency. Check for optical changes as well as electronic response: NIST's primary heterodyne apparatus controls spatial mode and polarization before electrical calibration.[ref]
Frequency response metrology for high-speed optical receivers by Paul D. Hale and others. PDF p. 1, Heterodyne measurements
The interpolation calculation above diagnoses a transfer assumption; it is not an attributed NIST procedure.Curvature error in overlap-reference transfer is the residual instrumental correction left when a curved operating-point response is represented by endpoint linear interpolation. Let be the actual log-ratio offset at optical power , and let interpolate its exact values at . Applying as the correction leavesThis deterministic model discrepancy is separate from random uncertainty in the measured endpoints.
The polynomial interpolation error formula gives, for twice continuously differentiable and between the endpoints,for some in that interval. To derive it, subtract a multiple of chosen to make the error vanish also at ; two applications of Rolle's theorem make the second derivative vanish at an intermediate point. If , thenThe maximum product occurs at the midpoint. Halving the reference spacing therefore quarters this worst-case bound when the same curvature bound remains justified.
For an original example, use power in milliwatts, endpoints , , and . The midpoint error is bounded by in log-ratio. The exact functionattains while matching both endpoint corrections perfectly. The corresponding multiplicative error in the corrected optical ratio is . Repeating endpoint measurements indefinitely would reduce their random uncertainty without revealing this midpoint discrepancy.
To guarantee throughout a reference interval under the stated bound, choose spacing satisfyingThe numerical bound and tolerance require spacing no greater than . Outside the endpoint interval, the product error formula needs a curvature bound over the larger range including the extrapolation point; the interior maximum bound cannot simply be reused.
A proposed check measures additional intermediate power settings and repeats at the intended detector bias and beat frequency. It also monitors mode alignment and polarization, which the primary NIST heterodyne apparatus controls separately.[ref]
Frequency response metrology for high-speed optical receivers by Paul D. Hale and others. PDF p.1, Heterodyne measurements, mode matching
Finitely many extra points constrain a response model but do not prove an arbitrary global curvature bound. State how is justified. The GUM's treatment of uncertainty propagation distinguishes local approximations from significant nonlinear effects.[ref]Inversion of a symmetric Gaussian overlap log-ratio recovers a radius ratio from two positive overlap-efficiency measurements made at known symmetric radius settings. It applies to the one-parameter model of symmetric beam-radius perturbation for overlap branch selection, with one shared response scale and fixed remaining mode properties.
Let , and , where . Since the symmetric log-overlap ratio satisfies , defineThenA finite positive radius ratio exists exactly when , equivalently . The strictly decreasing forward relation makes the solution unique inside this interval. Equality corresponds only to a limiting zero or infinite radius ratio; an out-of-range noisy measurement has no finite solution in this ideal model.
For an original example, and give and , hence . If the known first radius is , the inferred second radius is . The nuisance scale is unnecessary for that inversion. Once is obtained, one can reconstruct it as , but two fitted readings alone do not validate the Gaussian optical model.
The inverse sensitivity isFor small errors, relative radius uncertainty is approximately . At the worked point the derivative is ; stipulated gives about 1.13% relative radius uncertainty, before including uncertainty in the setting or the reference radius.
Near the allowed interval's edges, the inverse becomes highly sensitive. Boundary-sensitive Gaussian overlap inversion needs an uncertainty model that respects the nonlinear transformation; clipping an out-of-range value to a convenient radius does not supply the missing information. The GUM distinguishes local uncertainty propagation from cases requiring higher-order treatment.[ref]
The apparatus must implement a radius change without unintended displacement, polarization or wavefront changes. NIST's physical heterodyne receiver experiment used mode and polarization control and separate electrical corrections.[ref]
Frequency response metrology for high-speed optical receivers by Paul D. Hale and others. PDF pp. 1–2, Heterodyne measurements
Those controls motivate checks on the inversion assumptions; the paper is not a report of the particular symmetric-radius example derived here.Boundary-sensitive Gaussian overlap inversion describes the loss of stable radius information when a symmetric log-overlap ratio approaches its finite-model limit. A central reading can remain formally invertible while small measurement uncertainty reaches values for which no finite radius ratio exists.
For known , define , andThe inversion of a symmetric Gaussian overlap log-ratio requires . At the upper limit , the radius ratio tends to zero; at the lower limit it tends to infinity.
An original expansion near the upper limit puts . Expanding the hyperbolic tangent givesThus the approximate relative radius uncertainty is when linearization is still justified. The distance to the boundary, rather than the magnitude of alone, controls this sensitivity.
For stipulated and a central log-ratio only 0.01 below , the asymptotic radius ratio is about 0.0365. A standard uncertainty 0.02 in is twice the boundary distance, so a small symmetric error bar on the inferred radius is not credible. In a hypothetical Gaussian readout model centered there, roughly 31% of readings fall beyond the finite-inversion limit. This is a statistical illustration, not an observed receiver distribution.
Interval propagation for bounded overlap data shows the asymmetry directly. A stated interval in that reaches the upper bound maps to radius ratios arbitrarily close to zero; it does not yield a symmetric finite relative interval. An interval wholly inside the domain maps monotonically, with its endpoint order reversed.
Discarding out-of-range Monte Carlo draws would condition on a selected subset and change the distribution being propagated. Instead, examine the forward measurement model, admissible parameter range and calibration uncertainty, or construct an explicitly stated inference using the measured data. JCGM 101 separates input-distribution assignment from numerical propagation and states conditions for valid Monte Carlo use.[ref]
Finally, proximity to the mathematical boundary is not the only possible problem. A change in shared normalization, polarization or wavefront curvature can violate the one-radius model. NIST's receiver apparatus illustrates the need for optical matching and separate electrical corrections.[ref] Numerical clipping cannot replace those physical checks.
Interval propagation for bounded overlap data maps an allowed measurement interval through the nonlinear inversion of a symmetric Gaussian overlap log-ratio. It exposes asymmetry and finite-model limits that a central value with a symmetric standard uncertainty can hide. A deterministic input bound and a statistical confidence interval have different meanings, even if the endpoint calculation is the same.
For known , defineA finite positive radius ratio requires . Within this range decreases monotonically with . Thus an input interval lying strictly inside that range maps exactly toThe endpoint order reverses. This is direct monotone propagation, without a small-uncertainty approximation.
An original example sets and . The inferred radius ratio lies approximately between 0.4739 and 0.5306. The endpoints should be computed from the full inverse, rather than by forcing equal absolute distances around the central inferred radius. Such asymmetry becomes much stronger near either finite-model boundary.
If an interval reaches from below, it permits radius ratios arbitrarily close to zero. Reaching permits arbitrarily large radius ratios. Boundary values themselves correspond only to limiting ratios, not finite positive solutions. If the interval extends beyond the model range, some allowed observations have no solution in this forward model. Intersecting the interval with the admissible range can describe its compatible portion, but it does not justify discarding the incompatible observations or retaining the original claimed coverage without further analysis.
Uncertainty in changes the boundary too. For a rectangular set with and , increases with . Consequently the extreme compatible radius ratios areFor negative , the dependence on reverses; a sign-spanning interval requires checking that dependence instead of blindly using the positive-case formula. A correlated joint uncertainty region in need not fill the rectangle, so independent interval bounds can overstate the feasible range.
Joint radius-setting and log-ratio bounds therefore belong with the experimental calibration, not only the final arithmetic. JCGM 101 separates assigning input distributions from propagation, defines output coverage intervals and states conditions for its Monte Carlo method.[ref] A correctly propagated deterministic set is not automatically a 95% confidence interval; any probability statement requires the input model and its calibration. Optical alignment and state-gain checks remain necessary because an interval calculation cannot repair an incorrect forward model.
Joint radius-setting and log-ratio bounds retain the allowed relationship between the radius-setting parameter and measured log-ratio when inferring an optical radius ratio. Separate marginal intervals form a rectangle that may contain combinations excluded by shared calibration information. Propagating that rectangle can therefore exaggerate the feasible radius range.
For and , defineFor a stated joint set , the compatible ratios are . This set definition precedes any approximation. A deterministic set is not automatically a statistical confidence region; a probability interpretation needs the corresponding input model.
An original exactly linked calibration example has and . The marginal intervals are and , but their extreme values cannot be chosen independently. Writing and using givesThus the joint model gives approximately . Treating the two marginal intervals as an independent rectangle instead allows approximately . The wider result contains parameter combinations that violate . All values describe a stipulated calibration relation, not observed optical data.
For a positive- rectangle wholly inside the inversion range, monotonicity places the minimum ratio at and maximum at . That shortcut is valid for the rectangle, but those corners may be absent from the actual joint set. With nonlinear dependencies, optimize over the stated joint set or parameterize it by the genuinely independent calibration inputs.
The feasible-set boundary in overlap inversion also matters. If part of a joint set crosses , some allowed observations have no finite positive solution in the assumed model. Report that incompatibility and examine the measurement model; silently discarding those points changes the set or probability distribution. JCGM 101 distinguishes input assignment, propagation and output summaries, and specifies conditions for its Monte Carlo approach.[ref]
Experimentally, retain common calibration records when deriving both and . A shared scale or fitted parameter should be varied consistently through both calculations. Independent draws from their marginals erase that information. Conversely, imposing a convenient correlation without physical calibration evidence can create an unjustifiably narrow range. Interval propagation for bounded overlap data is a numerical step conditional on this joint experimental model.
The feasible-set boundary in overlap inversion separates joint measurements admitting a finite positive Gaussian radius ratio from measurements incompatible with that forward model. For radius-setting parameter and log-ratio , the admissible region isAt its upper boundary the inferred radius ratio tends to zero; at its lower boundary it becomes arbitrarily large. The joint radius-setting and log-ratio bounds must therefore be checked against the sloping joint boundary, not against a fixed limit evaluated only at the central .
An original ellipsoid calculation gives an exact test for a common joint-set model. Let lie in , with positive definite. For any vector , the maximum of isTo see this, write , , and apply the Cauchy-Schwarz inequality; equality is attained along the corresponding transformed direction.
Use and . The entire ellipse is strictly admissible if both displayed maxima are negative and its smallest is positive. This ellipsoidal admissibility test for overlap data checks every point of the stated joint set. It does not require sampling a coarse grid that might miss the closest approach to the boundary.
For stipulated means , standard-scale parameters , and , the central distance is 0.3. With zero covariance, the upper-boundary excursion isso the ellipse crosses that boundary. With correlation , the covariance is 0.0024 and the excursion becomesThat ellipse stays below the upper boundary; the lower boundary and positive- condition are also satisfied. Correlation changes the geometry even though both marginal uncertainty scales are unchanged.
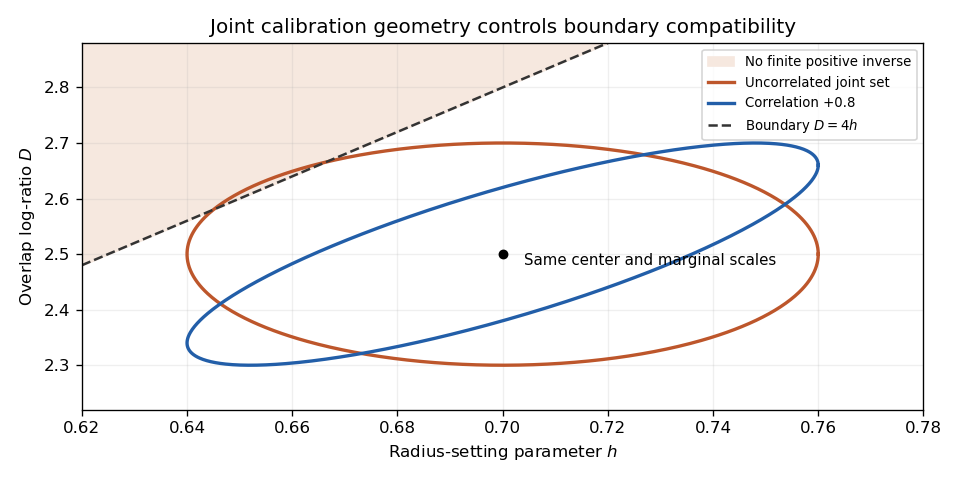
Original joint calibration sets with identical marginal scales: zero correlation crosses the finite-inversion boundary, while correlation +0.8 stays inside
. Details. 
If a set intersects the forbidden region, report the incompatibility and examine calibration, model adequacy and the meaning of the input bounds. Clipping points and applying the inverse to the survivors changes the propagated set or probability distribution. JCGM 101 separates input assignment, propagation and output summaries and gives conditions for valid Monte Carlo propagation.[ref] An illustrative ellipse is a deterministic set here; interpreting it as a confidence region requires an additional statistical model.
An ellipsoidal admissibility test for overlap data checks whether every point of a specified joint calibration ellipsoid permits finite Gaussian radius inversion. For the inversion of a symmetric Gaussian overlap log-ratio, write with the measured logarithmic ratio and the positive radius-setting parameter. The admissible set is and . Together these strict inequalities already imply .
Suppose the joint set isFor nonsingular this is equivalently . The parameterized form also accommodates a singular covariance matrix or a lower-dimensional deterministic set. Its support function in direction isIndeed, , so the Cauchy-Schwarz inequality gives the bound, attained by a parallel when .
Let , marginal scales , and off-diagonal entry . Substituting and gives two exact tests:Both must hold. Equality means that the closed joint set touches a boundary where no finite positive radius ratio exists; testing only the center would miss that point.
For an original example, take , , , and . Zero covariance gives upper-boundary excursion , smaller than the central margin . The lower-boundary test also passes. With correlation coefficient , however, and the upper excursion becomes : the joint set crosses the forbidden region despite identical marginal scales.
The offending point need not be found by grid search. When , the maximizing point isFor the correlated example and , this gives approximately , with . It is a concrete incompatible calibration pair.
The ellipsoid here is a stated joint set. Interpreting it as a confidence region requires a separate sampling or uncertainty model; choosing alone supplies no universal coverage probability. JCGM 101 distinguishes assignment of joint input distributions from propagation and summaries.[ref] If the set fails, report the incompatible region and reconsider the input model or measurement. Clipping it before inversion changes the set being propagated.
Articles by others on the same topic
There are currently no matching articles.