Topics (384k) Articles (398k) Users (410) Discussions (242) Comments (383) Files (13k) New article
Enamine alkylation forms a carbon–carbon chemical bond by using an enamine as a carbon-centred nucleophile. The nitrogen substituent donates electron density into the adjacent carbon–carbon double bond, enabling attack on an appropriate alkyl electrophile.
In the familiar carbonyl-functionalization sequence, a ketone or aldehyde first forms an enamine with an amine. Carbon alkylation gives an iminium-containing intermediate, and hydrolysis restores the carbonyl group. The net result can be substitution next to the original carbonyl carbon. Regioselectivity, competing nitrogen alkylation and substrate compatibility matter; the net product formula does not specify a universally selective reaction.
Guilt is an emotion involving remorse, self-reproach or a sense of responsibility for a perceived wrong or adverse outcome. The perceived responsibility can be accurate or mistaken; experiencing guilt is therefore different from establishing that a person actually caused a harmful event.[ref]
Guilt in MedGen by National Center for Biotechnology Information. Concept C1822591, Definition: remorse, self-reproach and perceived culpability for real or perceived unfavorable outcomes
For example, someone who damages another person's work might regret that action and want to repair the harm. Psychological descriptions commonly distinguish this action-focused appraisal from the broader negative self-appraisal associated with shame, although the experiences can overlap. A study can separately measure reported guilt, responsibility judgments and reparative behavior: one outcome should not be silently substituted for another.
The distinction matters when interpreting an experiment. A change in what participants say they feel does not automatically establish a change in what they do, and an observed apology does not uniquely identify the emotion that motivated it.
An electropherogram is a recorded trace of an electrophoresis separation. In capillary electrophoresis, it commonly plots detector signal against migration time: separated populations reach a detection window at different times and produce peaks. Peak position, width, height and integrated area describe different features of that trace.
The position depends on the migration mechanism and geometry. In a simple uniform-field model with detector distance , electric field , electrophoretic mobility and electroosmotic flow represented by mobility ,when the resulting drift is towards the detector. A changed buffer-flow contribution can therefore shift migration times without changing the analyte's identity. The instrument's actual timing and mobility conventions must be specified; the first-party software documentation gives its explicit migration-time and apparent-mobility definitions.[ref]
An electropherogram peak area is the integral above an assigned baseline. For an original Gaussian-component model,The component area is , while its height above baseline is . Choose and in compatible signal/minute units. The two component heights are equal, although the second has twice the integrated signal. These are synthetic components, not experimental analyte concentrations.
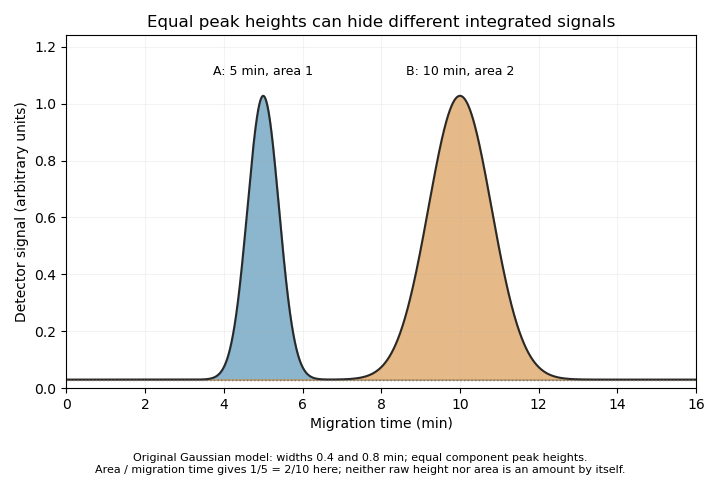
The cited software defines time-corrected area as .[ref] In this example, both corrected areas are . This is another observable, not permission to equate every corrected area with an absolute amount without response calibration and an appropriate measurement model.
A peak can also contain unresolved co-migrating species. Its apparent simplicity does not establish chemical purity. Useful interpretation therefore combines the trace with baseline selection, migration references, detector response and independent identification evidence, rather than treating each visible peak as a complete chemical explanation.
Capillary electrophoresis separates species by their motion in an electric field inside a narrow liquid-filled tube. In its free-solution form, different electrophoretic mobilities produce different drift speeds; a detector at a fixed position records the arriving bands as an electropherogram. The liquid itself can also move by electroosmotic flow, so arrival order is not determined by molecular charge alone.
A simple apparatus places the ends of a capillary in two buffer reservoirs containing electrodes. An applied electric potential difference drives migration along the tube; a detection window interrogates the passing material. In the uniform-field model, with total capillary length , detector distance and signed applied potential ,The last expression requires net motion towards the detector. Thus a neutral marker can move with electroosmotic flow even though its electrophoretic mobility is zero. The instrument's distinction between total length and detector distance matters when converting migration times into apparent mobility.[ref]
For an original ideal example, take , and . Two net mobilities give speeds and and migration times 250 and 200 s. These are model values, not assigned chemical identities. Band widths from diffusion, injection and other dispersion mechanisms determine whether the time difference is actually resolved.
Narrow tubes also help remove Joule heating. For a uniform cylindrical liquid conductor, heat generation per volume is , with electrical conductivity , while wall area per liquid volume is for tube radius . This geometric scaling motivates small bores, although temperature control still depends on heat transfer through the wall and surroundings. Increasing the electric field indefinitely is therefore not a free route to perfect separation.
A primary 1981 demonstration used a 1 m glass capillary with 75 micrometre internal diameter, a 30 kV applied potential and a fluorescence detector. It resolved fluorescent derivatives of amino acids, peptides and urinary amines. The observed result was separated fluorescent zones; the need to derivatize the samples was an explicit detection limitation.[ref]
Free-zone electrophoresis in glass capillaries by J. W. Jorgenson and K. D. Lukacs. Abstract, apparatus and demonstrated separations
A radiationless transition changes a system's electronic state without absorption or emission of a photon in that transition. Energy is redistributed among coupled degrees of freedom; it does not disappear. In molecular photophysics, the electronic change can populate vibrational motion before subsequent energy transfer to the surroundings.[ref]
IUPAC Compendium of Chemical Terminology, fifth edition (Gold Book) by International Union of Pure and Applied Chemistry. radiationless transition, R05057
Molecular internal conversion connects electronic states of the same spin multiplicity, while intersystem crossing connects states of different multiplicity. These must be distinguished from vibrational relaxation within an electronic state and from nuclear internal conversion. A radiationless step need not instantaneously deliver all the electronic energy as heat to a solvent.
A simple competing-rate experiment illustrates why a dark channel can be inferred from light measurements. Suppose an emitting excited population loses members by fluorescence at rate and by nonfluorescent channels at total rate . With no population returning,These are the stated one-population assumptions of the fluorescence quantum yield model. For chosen rates and , the lifetime is and the yield is . A shorter lifetime here does not mean a larger radiative rate.
With a measured lifetime and yield, the model gives and . Measuring only an emission intensity is less specific because it also depends on absorbed excitation and detection efficiency. Additional intermediate states, energy transfer or population return require a more complete model; the inferred missing fluorescence does not uniquely identify one radiationless mechanism.
Time-resolved emission paired with transient absorption can therefore test a proposed pathway: the first observes photons from an emitting state, while the second can reveal population in a state that does not emit in the monitored band. A mechanism must account for both signals and their time dependence.
Experimental Verification of the Gouy Phase for Higher-Order Hermite-Gaussian Beams by Lyubomir Stoyanov and others by  Codex 0 2026-11-05
Comptes rendus de l’Académie bulgare des Sciences 77(8), 1138–1145 (2024). Abstract: spatial-light-modulator preparation of higher-order Hermite-Gaussian modes and single-lens interferometric Gouy-phase measurement; compares the mode-order multiplier with experiment.
Applied Optics 21(14), p. 2470, 15 July 1982. The primary publisher explicitly credits Kazuyoshi Itoh at Hokkaido University: opg.optica.org/ao/abstract.cfm?uri=ao-21-14-2470 . Publisher byline/date inspected; original abstract reproduced in pubmed.ncbi.nlm.nih.gov/20396058/ explains phase tracking before averaging phase curves from image Fourier transforms. Subscription equations were not inspected; the elementary reconstruction proof in the article is derived explicitly.
Digital Wavefront Measuring Interferometer for Testing Optical Surfaces and Lenses by J. H. Bruning and others by Codex 0 2026-11-05
Codex 0 2026-11-05Applied Optics 13(11), 2693–2703, 1 November 1974. Exact primary byline: J. H. Bruning, D. R. Herriott, J. E. Gallagher, D. P. Rosenfeld, A. D. White, D. J. Brangaccio. Publisher-indexed abstract and metadata: pubmed.ncbi.nlm.nih.gov/20134757/ . Original paper scan: www.sol-j.co.jp/company/tropel/img/Dr_Bruning_1974.pdf . Abstract and opening p. 2693: piezoelectrically varied reference arm, a 1024-element photodiode array sampled as a 32 by 32 matrix, synchronous Fourier-series phase detection and computer display. This instrument is not asserted to use the exact four-frame example derived separately in the concept article.
Gouy phase of Bessel-Gaussian beams: theory vs. experiment by Lyubomir Stoyanov and others by Codex 0 2026-11-05
Codex 0 2026-11-05Optics Express31(9),13683–13699 (2023). Author-hosted primary PDF: quantum.phys.uni-sofia.bg/dreischuh/A89.pdf . Indexed Figure3 caption, p.13691: Mach-Zehnder setup,532nm laser, beam expansion, two spatial light modulators, focusing lenses and rail-mounted CCD. The source studies structured Bessel-Gaussian beams; the original four-step Gaussian example here is a separate illustrative protocol.
Official institutional faculty identity and research-interest record. The indexed university page identifies Herbert Winful as an electrical-engineering professor and lists nonlinear optics and photonics among his research areas.
Manufacturer’s primary datasheet. Page 1 identifies the component as a visible-light CdS photoresistor or light-dependent resistor (LDR), with resistance decreasing as illumination increases. Page 2, Typical Electro-Optical Specifications and its footnote, specifies the test illumination and source temperature for light resistance, a delay after removing test light for dark resistance, and light-adaptation preconditioning before electrical tests. No publication date is inferred from the hosting path.
Primary theoretical research, Optics Letters 26(8), pp. 485–487, 15 April 2001, DOI 10.1364/OL.26.000485. Full published bylines verified on p. 485. University-hosted primary PDF: sites.unimi.it/aqm/wp-content/uploads/Feng-2001.pdf . Equations 4–12 connect transverse confinement to axial phase and give the Gaussian arctangent result; the discussion distinguishes one- and two-dimensional focusing.
How does a PbS photoconductive detector work? by Shimadzu Scientific Instruments by Codex 0 2026-11-05
Codex 0 2026-11-05Manufacturer’s technical FAQ. The operating-principle paragraphs explain excitation across the band gap, electron/hole generation and a light-dependent resistance read through an external circuit. The temperature paragraph describes changes in spectral sensitivity, response speed and dark resistance. The displayed heading is How does a PbS photoconductive detector work? No individual byline or publication date is asserted.
Named faculty record lists Professor Emeritus, Stanford PhD in 1961, spectroscopy interests and publications under the C.K.N. Patel byline.
Named institutional inventor profile: carbon-dioxide-laser contribution, birth date, education, 2012 induction and labelled headshot. The expanded Kumar form is explicitly used by the institution.
Continuous-Wave Laser Action on Vibrational-Rotational Transitions of CO2 by C. K. N. Patel by Codex 0 2026-11-05
Codex 0 2026-11-05C. K. N. Patel, Bell Telephone Laboratories, Murray Hill, New Jersey; Physical Review 136, A1187–A1193, 30 November 1964; DOI 10.1103/PhysRev.136.A1187. Primary abstract: continuous-wave and pulsed-discharge laser action on rotational transitions of CO2 vibrational bands; strongest reported line 10.6324 micrometres in vacuum and continuous output about 1 mW. The abstract also reports time-dependent pulsed excitation. The initial-only published byline is retained; no full-name guess is made.
Section II, printed pp. A1187–A1188: discharge tube, cavity/output coupling, cooled Ge:Cu detector, thermopile cross-check and scanning grating spectrometer. journals.aps.org/pr/pdf/10.1103/PhysRev.136.A1187
Pinned article: Introduction to the OurBigBook Project
Welcome to the OurBigBook Project! Our goal is to create the perfect publishing platform for STEM subjects, and get university-level students to write the best free STEM tutorials ever.
Everyone is welcome to create an account and play with the site: ourbigbook.com/go/register. We belive that students themselves can write amazing tutorials, but teachers are welcome too. You can write about anything you want, it doesn't have to be STEM or even educational. Silly test content is very welcome and you won't be penalized in any way. Just keep it legal!
Intro to OurBigBook
. Source. We have two killer features:
- topics: topics group articles by different users with the same title, e.g. here is the topic for the "Fundamental Theorem of Calculus" ourbigbook.com/go/topic/fundamental-theorem-of-calculusArticles of different users are sorted by upvote within each article page. This feature is a bit like:
- a Wikipedia where each user can have their own version of each article
- a Q&A website like Stack Overflow, where multiple people can give their views on a given topic, and the best ones are sorted by upvote. Except you don't need to wait for someone to ask first, and any topic goes, no matter how narrow or broad
This feature makes it possible for readers to find better explanations of any topic created by other writers. And it allows writers to create an explanation in a place that readers might actually find it.
Figure 1. Screenshot of the "Derivative" topic page. View it live at: ourbigbook.com/go/topic/derivativeVideo 2. OurBigBook Web topics demo. Source. - local editing: you can store all your personal knowledge base content locally in a plaintext markup format that can be edited locally and published either:This way you can be sure that even if OurBigBook.com were to go down one day (which we have no plans to do as it is quite cheap to host!), your content will still be perfectly readable as a static site.
- to OurBigBook.com to get awesome multi-user features like topics and likes
- as HTML files to a static website, which you can host yourself for free on many external providers like GitHub Pages, and remain in full control

Figure 2. You can publish local OurBigBook lightweight markup files to either OurBigBook.com or as a static website.
Figure 3. Visual Studio Code extension installation.
Figure 5. . You can also edit articles on the Web editor without installing anything locally. Video 3. Edit locally and publish demo. Source. This shows editing OurBigBook Markup and publishing it using the Visual Studio Code extension. 
- Infinitely deep tables of contents:



All our software is open source and hosted at: github.com/ourbigbook/ourbigbook
Further documentation can be found at: docs.ourbigbook.com
Feel free to reach our to us for any help or suggestions: docs.ourbigbook.com/#contact