Topics (119k) Articles (119k) Users (287) Discussions (237) Comments (383) Files (715) New article
420 to 680 nm for sure, but larger ranges are observable in laboratory conditions.
E. Coli Whole Cell Model by Covert Lab Install and first run by  Ciro Santilli 40 Updated 2025-07-16
Ciro Santilli 40 Updated 2025-07-16At 7e4cc9e57de76752df0f4e32eca95fb653ea64e4 you basically need to use the Docker image on Ubuntu 21.04 due to pip breaking changes... (not their fault). Perhaps pyenv would solve things, but who has the patience for that?!?!
The Docker setup from README does just work. The image download is a bit tedius, as it requires you to create a GitHub API key as described in the README, but there must be reasons for that.
Once the image is downloaded, you really want to run is from the root of the source tree:This mounts the host source under The meaning of each of the analysis commands is described at Section "Output overview".
sudo docker run --name=wcm -it -v "$(pwd):/wcEcoli" docker.pkg.github.com/covertlab/wholecellecolirelease/wcm-full/wcEcoli, so you can easily edit and view output images from your host. Once inside Docker we can compile, run the simulation, and analyze results with:make clean compile &&
python runscripts/manual/runFitter.py &&
python runscripts/manual/runSim.py &&
python runscripts/manual/analysisVariant.py &&
python runscripts/manual/analysisCohort.py &&
python runscripts/manual/analysisMultigen.py &&
python runscripts/manual/analysisSingle.pyAs a Docker refresher, after you stop the container, e.g. by restarting your computer or running
sudo docker stop wcm, you can get back into it with:sudo docker start wcm
sudo docker run -it wcm bashrunscripts/manual/runFitter.py takes about 15 minutes, and it generates files such as reconstruction/ecoli/dataclasses/process/two_component_system.py (related) which is required to run the simulation, it is basically a part of the build.runSim.py does the main simulation, progress output contains lines of type:Time (s) Dry mass Dry mass Protein RNA Small mol Expected
(fg) fold change fold change fold change fold change fold change
======== ======== =========== =========== =========== =========== ===========
0.00 403.09 1.000 1.000 1.000 1.000 1.000
0.20 403.18 1.000 1.000 1.000 1.000 1.000 2569.18 783.09 1.943 1.910 2.005 1.950 1.963
Simulation finished:
- Length: 0:42:49
- Runtime: 0:09:13Run output is placed under
out/:Some of the output data is stored as
.cpickle files. To observe those files, you need the original Python classes, and therefore you have to be inside Docker, from the host it won't work.We can list all the plots that have been produced under Plots are also available in SVG and PDF formats, e.g.:
out/ withfind -name '*.png'The output directory has a hierarchical structure of type:where:
./out/manual/wildtype_000000/000000/generation_000000/000000/wildtype_000000: variant conditions.wildtypeis a human readable label, and000000is an index amongst the possiblewildtypeconditions. For example, we can have different simulations with different nutrients, or different DNA sequences. An example of this is shown at run variants.000000: initial random seed for the initial cell, likely fed to NumPy'snp.random.seedgenereation_000000: this will increase with generations if we simulate multiple cells, which is supported by the model000000: this will presumably contain the cell index within a generation
We also understand that some of the top level directories contain summaries over all cells, e.g. the
massFractionSummary.pdf plot exists at several levels of the hierarchy:./out/manual/plotOut/massFractionSummary.pdf
./out/manual/wildtype_000000/plotOut/massFractionSummary.pdf
./out/manual/wildtype_000000/000000/plotOut/massFractionSummary.pdf
./out/manual/wildtype_000000/000000/generation_000000/000000/plotOut/massFractionSummary.pdfEach of thoes four levels of
plotOut is generated by a different one of the analysis scripts:./out/manual/plotOut: generated bypython runscripts/manual/analysisVariant.py. Contains comparisons of different variant conditions. We confirm this by looking at the results of run variants../out/manual/wildtype_000000/plotOut: generated bypython runscripts/manual/analysisCohort.py --variant_index 0. TODO not sure how to differentiate between two different labels e.g.wildtype_000000andsomethingElse_000000. If-vis not given, a it just picks the first one alphabetically. TODO not sure how to automatically generate all of those plots without inspecting the directories../out/manual/wildtype_000000/000000/plotOut: generated bypython runscripts/manual/analysisMultigen.py --variant_index 0 --seed 0./out/manual/wildtype_000000/000000/generation_000000/000000/plotOut: generated bypython runscripts/manual/analysisSingle.py --variant_index 0 --seed 0 --generation 0 --daughter 0. Contains information about a single specific cell.
It would be boring if we could only simulate the same condition all the time, so let's have a look at the different boundary conditions that we can apply to the cell!
We are able to alter things like the composition of the external medium, and the genome of the bacteria, which will make the bacteria behave differently.
The variant selection is a bit cumbersome as we have to use indexes instead of names, but one you know what you are doing, it is fine.
Of course, genetic modification is limited only to experimentally known protein interactions due to the intractability of computational protein folding and computational chemistry in general, solving those would bsai.
Besides time series run variants, conditions can also be selected directly without a time series as in:which select row indices from so
python runscripts/manual/runSim.py --variant condition 1 1reconstruction/ecoli/flat/condition/condition_defs.tsv. The above 1 1 would mean the second line of that file which starts with:"condition" "nutrients" "genotype perturbations" "doubling time (units.min)" "active TFs"
"basal" "minimal" {} 44.0 []
"no_oxygen" "minimal_minus_oxygen" {} 100.0 []
"with_aa" "minimal_plus_amino_acids" {} 25.0 ["CPLX-125", "MONOMER0-162", "CPLX0-7671", "CPLX0-228", "MONOMER0-155"]1 means no_oxygen. E. Coli Whole Cell Model by Covert Lab Source code overview by Ciro Santilli 40 Updated 2025-07-16
Ciro Santilli 40 Updated 2025-07-16Let's try to understand some interesting looking, with a special focus on our understanding of the tiny E. Coli K-12 MG1655 operon thrLABC part of the metabolism, which we have well understood at Section "E. Coli K-12 MG1655 operon thrLABC".
reconstruction/ecoli/flat/compartments.tsvcontains cellular compartment information:"abbrev" "id" "n" "CCO-BAC-NUCLEOID" "j" "CCO-CELL-PROJECTION" "w" "CCO-CW-BAC-NEG" "c" "CCO-CYTOSOL" "e" "CCO-EXTRACELLULAR" "m" "CCO-MEMBRANE" "o" "CCO-OUTER-MEM" "p" "CCO-PERI-BAC" "l" "CCO-PILUS" "i" "CCO-PM-BAC-NEG"CCO: "Celular COmpartment"BAC-NUCLEOID: nucleoidCELL-PROJECTION: cell projectionCW-BAC-NEG: TODO confirm: cell wall (of a Gram-negative bacteria)CYTOSOL: cytosolEXTRACELLULAR: outside the cellMEMBRANE: cell membraneOUTER-MEM: bacterial outer membranePERI-BAC: periplasmPILUS: pilusPM-BAC-NEG: TODO: plasma membrane, but that is the same as cell membrane no?
reconstruction/ecoli/flat/promoters.tsvcontains promoter information. Simple file, sample lines:corresponds to E. Coli K-12 MG1655 promoter thrLp, which starts as position 148."position" "direction" "id" "name" 148 "+" "PM00249" "thrLp"reconstruction/ecoli/flat/proteins.tsvcontains protein information. Sample line corresponding to e. Coli K-12 MG1655 gene thrA:so we understand that:"aaCount" "name" "seq" "comments" "codingRnaSeq" "mw" "location" "rnaId" "id" "geneId" [91, 46, 38, 44, 12, 53, 30, 63, 14, 46, 89, 34, 23, 30, 29, 51, 34, 4, 20, 0, 69] "ThrA" "MRVL..." "Location information from Ecocyc dump." "AUGCGAGUGUUG..." [0.0, 0.0, 0.0, 0.0, 0.0, 0.0, 89103.51099999998, 0.0, 0.0, 0.0, 0.0] ["c"] "EG10998_RNA" "ASPKINIHOMOSERDEHYDROGI-MONOMER" "EG10998"aaCount: amino acid count, how many of each of the 20 proteinogenic amino acid are thereseq: full sequence, using the single letter abbreviation of the proteinogenic amino acidsmw; molecular weight? The 11 components appear to be given atreconstruction/ecoli/flat/scripts/unifyBulkFiles.py:so they simply classify the weight? Presumably this exists for complexes that have multiple classes?molecular_weight_keys = [ '23srRNA', '16srRNA', '5srRNA', 'tRNA', 'mRNA', 'miscRNA', 'protein', 'metabolite', 'water', 'DNA', 'RNA' # nonspecific RNA ]23srRNA,16srRNA,5srRNAare the three structural RNAs present in the ribosome: 23S ribosomal RNA, 16S ribosomal RNA, 5S ribosomal RNA, all others are obvious:- tRNA
- mRNA
- protein. This is the seventh class, and this enzyme only contains mass in this class as expected.
- metabolite
- water
- DNA
- RNA: TODO
rnavsmiscRNA
location: cell compartment where the protein is present,cdefined atreconstruction/ecoli/flat/compartments.tsvas cytoplasm, as expected for something that will make an amino acid
reconstruction/ecoli/flat/rnas.tsv: TODO vstranscriptionUnits.tsv. Sample lines:"halfLife" "name" "seq" "type" "modifiedForms" "monomerId" "comments" "mw" "location" "ntCount" "id" "geneId" "microarray expression" 174.0 "ThrA [RNA]" "AUGCGAGUGUUG..." "mRNA" [] "ASPKINIHOMOSERDEHYDROGI-MONOMER" "" [0.0, 0.0, 0.0, 0.0, 790935.00399999996, 0.0, 0.0, 0.0, 0.0, 0.0, 0.0] ["c"] [553, 615, 692, 603] "EG10998_RNA" "EG10998" 0.0005264904halfLife: half-lifemw: molecular weight, same as inreconstruction/ecoli/flat/proteins.tsv. This molecule only have weight in themRNAclass, as expected, as it just codes for a proteinlocation: same as inreconstruction/ecoli/flat/proteins.tsvntCount: nucleotide count for each of the ATGCmicroarray expression: presumably refers to DNA microarray for gene expression profiling, but what measure exactly?
reconstruction/ecoli/flat/sequence.fasta: FASTA DNA sequence, first two lines:>E. coli K-12 MG1655 U00096.2 (1 to 4639675 = 4639675 bp) AGCTTTTCATTCTGACTGCAACGGGCAATATGTCTCTGTGTGGATTAAAAAAAGAGTGTCTGATAGCAGCTTCTGreconstruction/ecoli/flat/transcriptionUnits.tsv: transcription units. We can observe for example the two different transcription units of the E. Coli K-12 MG1655 operon thrLABC in the lines:"expression_rate" "direction" "right" "terminator_id" "name" "promoter_id" "degradation_rate" "id" "gene_id" "left" 0.0 "f" 310 ["TERM0-1059"] "thrL" "PM00249" 0.198905992329492 "TU0-42486" ["EG11277"] 148 657.057317358791 "f" 5022 ["TERM_WC-2174"] "thrLABC" "PM00249" 0.231049060186648 "TU00178" ["EG10998", "EG10999", "EG11000", "EG11277"] 148promoter_id: matches promoter id inreconstruction/ecoli/flat/promoters.tsvgene_id: matches id inreconstruction/ecoli/flat/genes.tsvid: matches exactly those used in BioCyc, which is quite nice, might be more or less standardized:
reconstruction/ecoli/flat/genes.tsv"length" "name" "seq" "rnaId" "coordinate" "direction" "symbol" "type" "id" "monomerId" 66 "thr operon leader peptide" "ATGAAACGCATT..." "EG11277_RNA" 189 "+" "thrL" "mRNA" "EG11277" "EG11277-MONOMER" 2463 "ThrA" "ATGCGAGTGTTG" "EG10998_RNA" 336 "+" "thrA" "mRNA" "EG10998" "ASPKINIHOMOSERDEHYDROGI-MONOMER"reconstruction/ecoli/flat/metabolites.tsvcontains metabolite information. Sample lines:In the case of the enzyme thrA, one of the two reactions it catalyzes is "L-aspartate 4-semialdehyde" into "Homoserine"."id" "mw7.2" "location" "HOMO-SER" 119.12 ["n", "j", "w", "c", "e", "m", "o", "p", "l", "i"] "L-ASPARTATE-SEMIALDEHYDE" 117.104 ["n", "j", "w", "c", "e", "m", "o", "p", "l", "i"]Starting from the enzyme page: biocyc.org/gene?orgid=ECOLI&id=EG10998 we reach the reaction page: biocyc.org/ECOLI/NEW-IMAGE?type=REACTION&object=HOMOSERDEHYDROG-RXN which has reaction IDHOMOSERDEHYDROG-RXN, and that page which clarifies the IDs:so these are the compounds that we care about.- biocyc.org/compound?orgid=ECOLI&id=L-ASPARTATE-SEMIALDEHYDE: "L-aspartate 4-semialdehyde" has ID
L-ASPARTATE-SEMIALDEHYDE - biocyc.org/compound?orgid=ECOLI&id=HOMO-SER: "Homoserine" has ID
HOMO-SER
- biocyc.org/compound?orgid=ECOLI&id=L-ASPARTATE-SEMIALDEHYDE: "L-aspartate 4-semialdehyde" has ID
reconstruction/ecoli/flat/reactions.tsvcontains chemical reaction information. Sample lines:"reaction id" "stoichiometry" "is reversible" "catalyzed by" "HOMOSERDEHYDROG-RXN-HOMO-SER/NAD//L-ASPARTATE-SEMIALDEHYDE/NADH/PROTON.51." {"NADH[c]": -1, "PROTON[c]": -1, "HOMO-SER[c]": 1, "L-ASPARTATE-SEMIALDEHYDE[c]": -1, "NAD[c]": 1} false ["ASPKINIIHOMOSERDEHYDROGII-CPLX", "ASPKINIHOMOSERDEHYDROGI-CPLX"] "HOMOSERDEHYDROG-RXN-HOMO-SER/NADP//L-ASPARTATE-SEMIALDEHYDE/NADPH/PROTON.53." {"NADPH[c]": -1, "NADP[c]": 1, "PROTON[c]": -1, "L-ASPARTATE-SEMIALDEHYDE[c]": -1, "HOMO-SER[c]": 1 false ["ASPKINIIHOMOSERDEHYDROGII-CPLX", "ASPKINIHOMOSERDEHYDROGI-CPLX"]catalized by: here we seeASPKINIHOMOSERDEHYDROGI-CPLX, which we can guess is a protein complex made out ofASPKINIHOMOSERDEHYDROGI-MONOMER, which is the ID for thethrAwe care about! This is confirmed incomplexationReactions.tsv.
reconstruction/ecoli/flat/complexationReactions.tsvcontains information about chemical reactions that produce protein complexes:The"process" "stoichiometry" "id" "dir" "complexation" [ { "molecule": "ASPKINIHOMOSERDEHYDROGI-CPLX", "coeff": 1, "type": "proteincomplex", "location": "c", "form": "mature" }, { "molecule": "ASPKINIHOMOSERDEHYDROGI-MONOMER", "coeff": -4, "type": "proteinmonomer", "location": "c", "form": "mature" } ] "ASPKINIHOMOSERDEHYDROGI-CPLX_RXN" 1coeffis how many monomers need to get together for form the final complex. This can be seen from the Summary section of ecocyc.org/gene?orgid=ECOLI&id=ASPKINIHOMOSERDEHYDROGI-MONOMER:Fantastic literature summary! Can't find that in database form there however.Aspartate kinase I / homoserine dehydrogenase I comprises a dimer of ThrA dimers. Although the dimeric form is catalytically active, the binding equilibrium dramatically favors the tetrameric form. The aspartate kinase and homoserine dehydrogenase activities of each ThrA monomer are catalyzed by independent domains connected by a linker region.
reconstruction/ecoli/flat/proteinComplexes.tsvcontains protein complex information:"name" "comments" "mw" "location" "reactionId" "id" "aspartate kinase / homoserine dehydrogenase" "" [0.0, 0.0, 0.0, 0.0, 0.0, 0.0, 356414.04399999994, 0.0, 0.0, 0.0, 0.0] ["c"] "ASPKINIHOMOSERDEHYDROGI-CPLX_RXN" "ASPKINIHOMOSERDEHYDROGI-CPLX"reconstruction/ecoli/flat/protein_half_lives.tsvcontains the half-life of proteins. Very few proteins are listed however for some reason.reconstruction/ecoli/flat/tfIds.csv: transcription factors information:"TF" "geneId" "oneComponentId" "twoComponentId" "nonMetaboliteBindingId" "activeId" "notes" "arcA" "EG10061" "PHOSPHO-ARCA" "PHOSPHO-ARCA" "fnr" "EG10325" "FNR-4FE-4S-CPLX" "FNR-4FE-4S-CPLX" "dksA" "EG10230"
TODO compare with actual datasetes.
Unfortunately, due to lack of one page to rule them all, the on-Git tree publication list is meager, some of the most relevant ones seems to be:
- 2021 open access review paper: journals.asm.org/doi/full/10.1128/ecosalplus.ESP-0001-2020 "The E. coli Whole-Cell Modeling Project". They should just past that stuff in a README :-) The article mentions that it is a follow up to the previous M. genitalium whole cell model by Covert lab. Only 43% of known genes modelled at this point however, a shame.
- 2020 under Science paywall: www.science.org/doi/10.1126/science.aav3751 "Simultaneous cross-evaluation of heterogeneous E. coli datasets via mechanistic simulation"
NCBI taxonomy entry: www.ncbi.nlm.nih.gov/Taxonomy/Browser/wwwtax.cgi?id=511145 This links to:
- Interactively browse the sequence on the browser viewer: "Reference genome: Escherichia coli str. K-12 substr. MG1655" which eventually leads to: www.ncbi.nlm.nih.gov/nuccore/556503834?report=graphIf we zoom into the start, we hover over the very first gene/protein: the famous (just kidding) e. Coli K-12 MG1655 gene thrL, at position 190-255.The second one is the much more interesting e. Coli K-12 MG1655 gene thrA.
- Gene list, with a total of 4,629 as of 2021: www.ncbi.nlm.nih.gov/gene/?term=txid511145
Generalization of AlphaGo Zero that plays Go, chess and shogi.
- www.science.org/doi/10.1126/science.aar6404 A general reinforcement learning algorithm that masters chess, shogi, and Go through self-play by Silver et al. (2018), published without source code
- www.quora.com/Is-there-an-Open-Source-version-of-AlphaZero-specifically-the-generic-game-learning-tool-distinct-from-AlphaGo
www.quora.com/Which-chess-engine-would-be-stronger-Alpha-Zero-or-Stockfish-12/answer/Felix-Zaslavskiy explains that it beat Stockfish 8. But then Stockfish was developed further and would start to beat it. We know this because although AlphaZero was closed source, they released the trained artificial neural network, so it was possible to replay AlphaZero at its particular stage of training.
merlijn.sebrechts.be/blog/2020-08-02-why-one-snap-store/ has some very good comments on how
snap is more closed than Flatpak. Pinned article: Introduction to the OurBigBook Project
Welcome to the OurBigBook Project! Our goal is to create the perfect publishing platform for STEM subjects, and get university-level students to write the best free STEM tutorials ever.
Everyone is welcome to create an account and play with the site: ourbigbook.com/go/register. We belive that students themselves can write amazing tutorials, but teachers are welcome too. You can write about anything you want, it doesn't have to be STEM or even educational. Silly test content is very welcome and you won't be penalized in any way. Just keep it legal!
Intro to OurBigBook
. Source. We have two killer features:
- topics: topics group articles by different users with the same title, e.g. here is the topic for the "Fundamental Theorem of Calculus" ourbigbook.com/go/topic/fundamental-theorem-of-calculusArticles of different users are sorted by upvote within each article page. This feature is a bit like:
- a Wikipedia where each user can have their own version of each article
- a Q&A website like Stack Overflow, where multiple people can give their views on a given topic, and the best ones are sorted by upvote. Except you don't need to wait for someone to ask first, and any topic goes, no matter how narrow or broad
This feature makes it possible for readers to find better explanations of any topic created by other writers. And it allows writers to create an explanation in a place that readers might actually find it.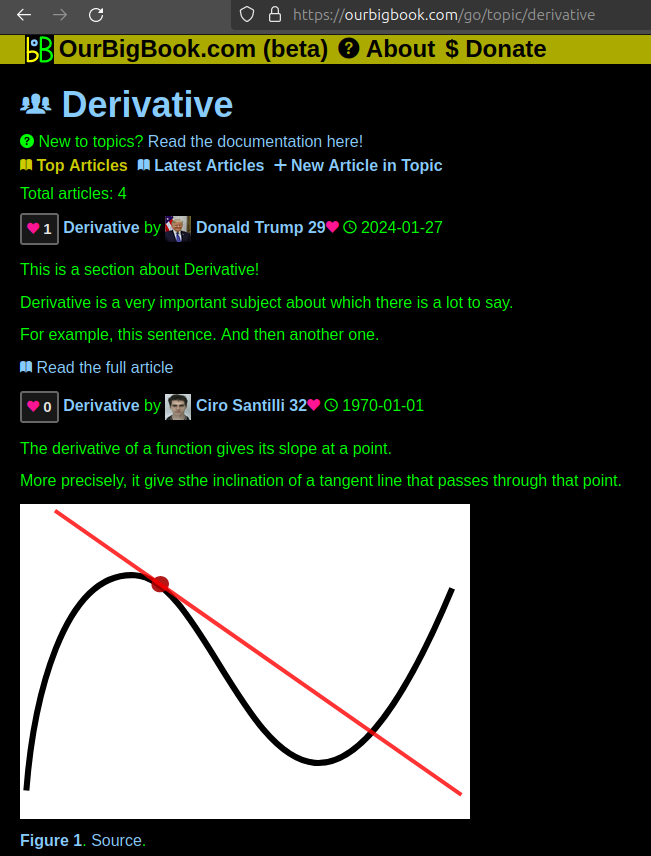
Figure 1. Screenshot of the "Derivative" topic page. View it live at: ourbigbook.com/go/topic/derivativeVideo 2. OurBigBook Web topics demo. Source. - local editing: you can store all your personal knowledge base content locally in a plaintext markup format that can be edited locally and published either:This way you can be sure that even if OurBigBook.com were to go down one day (which we have no plans to do as it is quite cheap to host!), your content will still be perfectly readable as a static site.
- to OurBigBook.com to get awesome multi-user features like topics and likes
- as HTML files to a static website, which you can host yourself for free on many external providers like GitHub Pages, and remain in full control
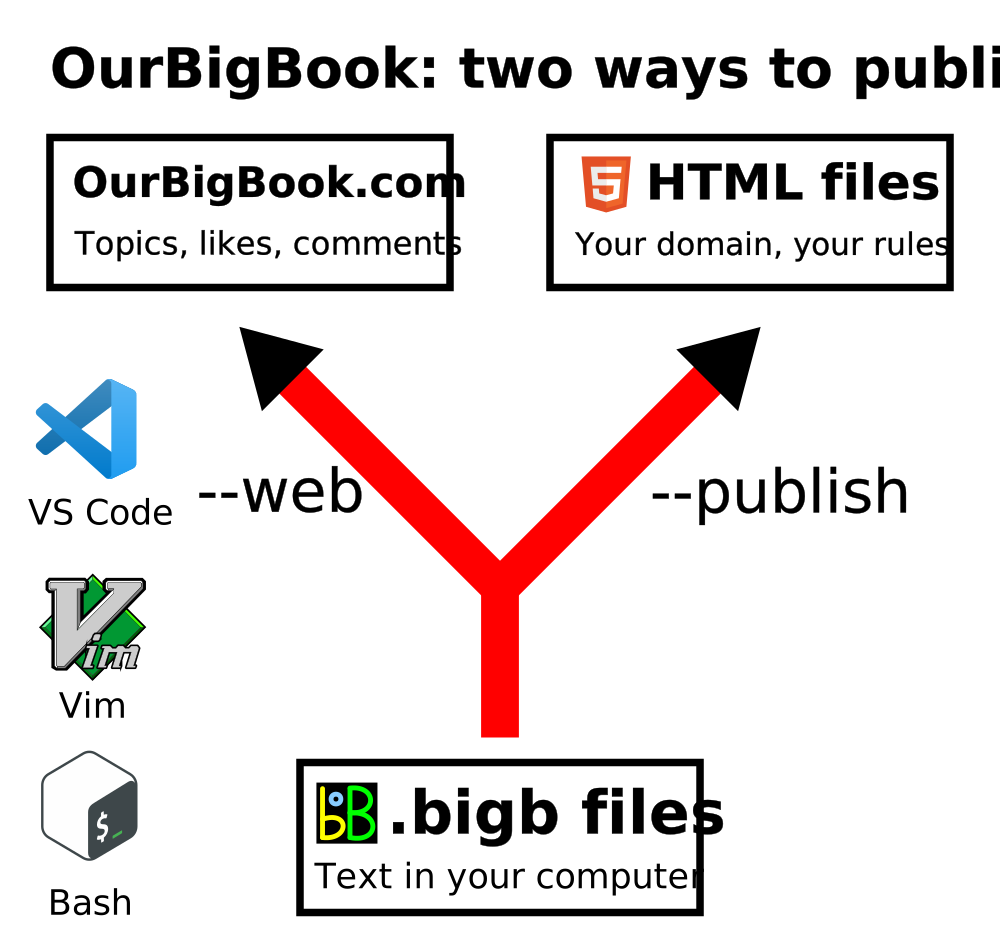
Figure 2. You can publish local OurBigBook lightweight markup files to either OurBigBook.com or as a static website.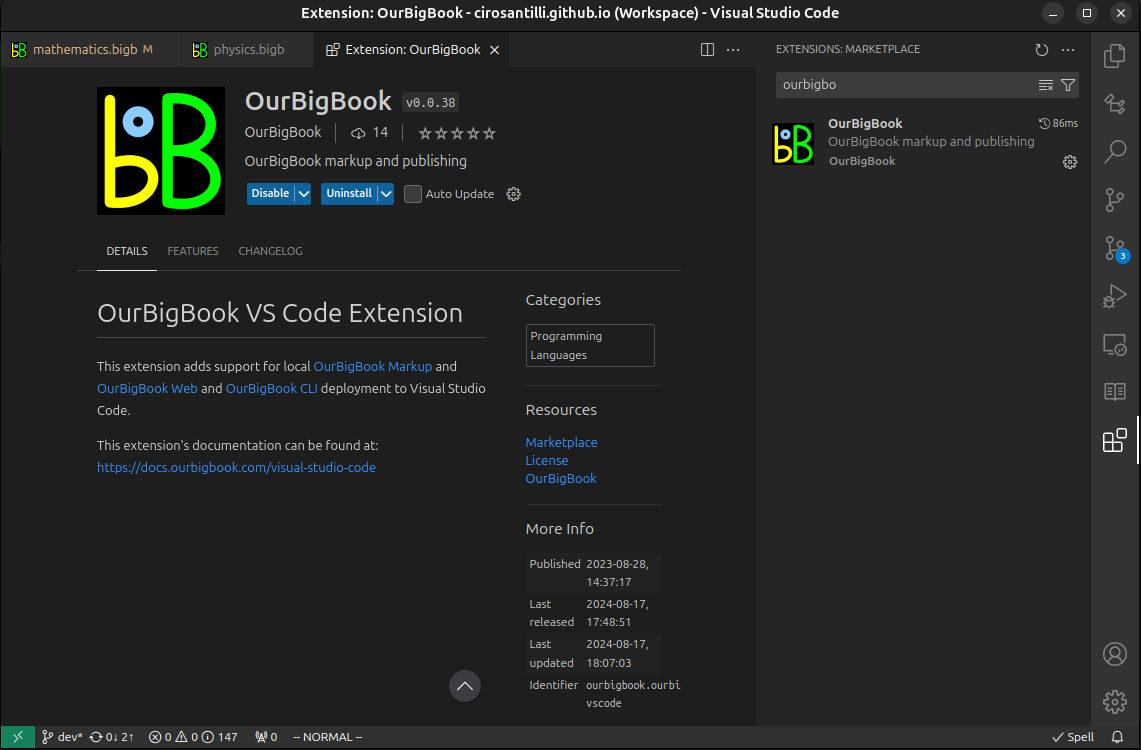
Figure 3. Visual Studio Code extension installation.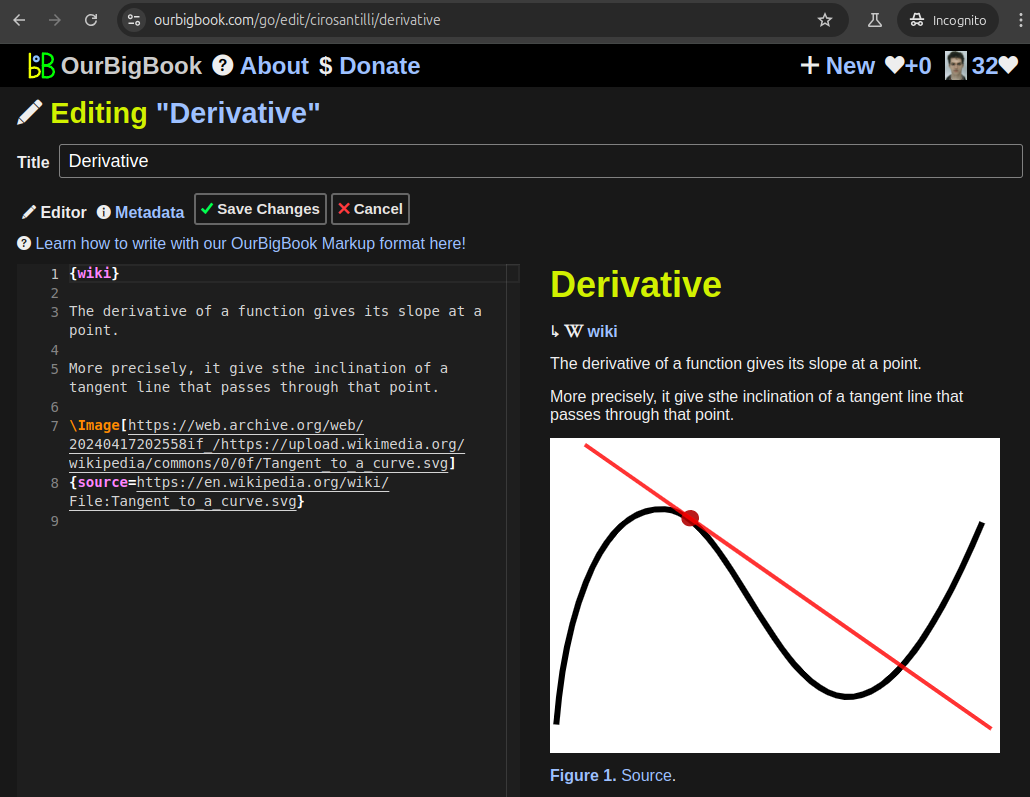
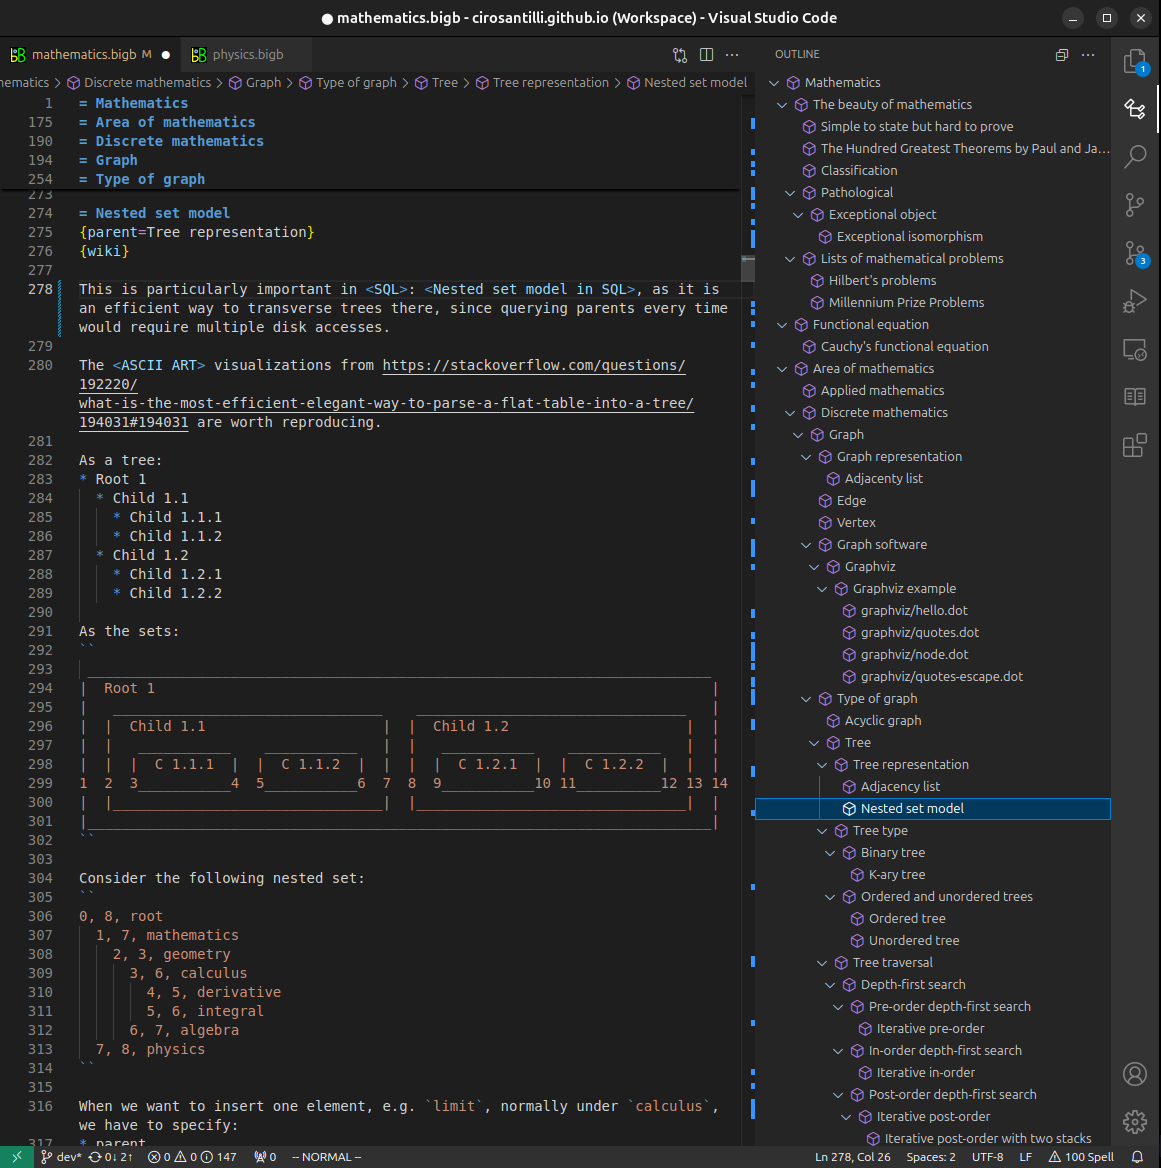
Figure 5. . You can also edit articles on the Web editor without installing anything locally. Video 3. Edit locally and publish demo. Source. This shows editing OurBigBook Markup and publishing it using the Visual Studio Code extension. 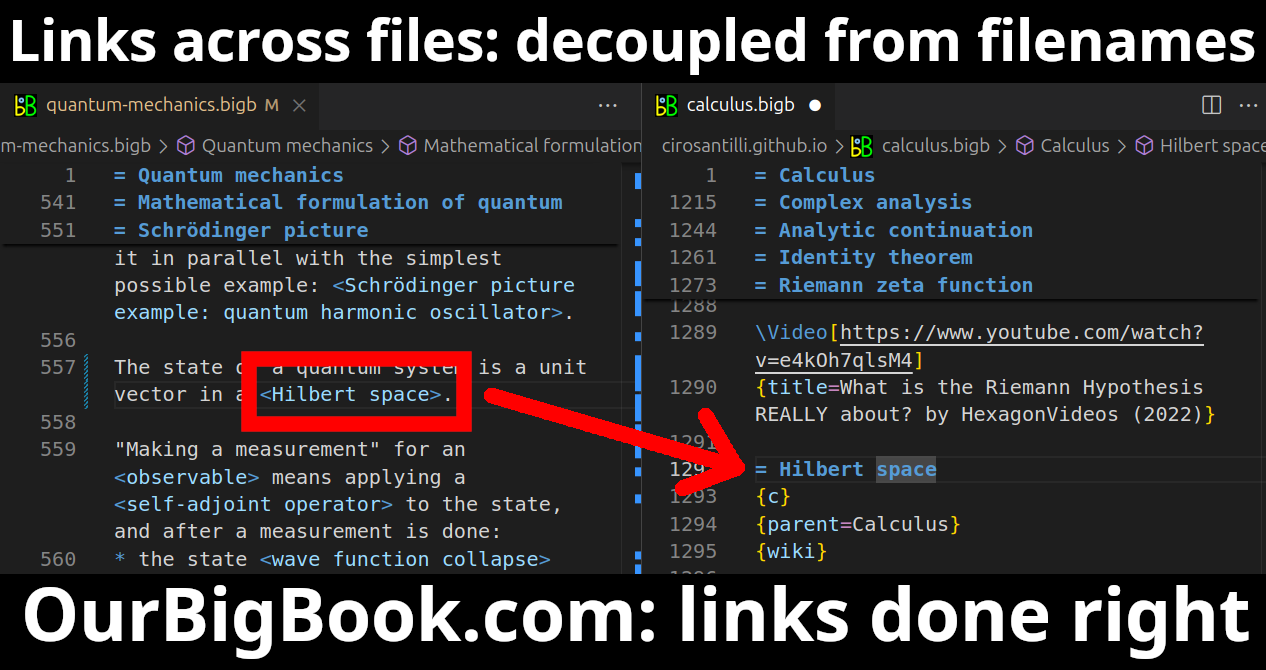
- Infinitely deep tables of contents:
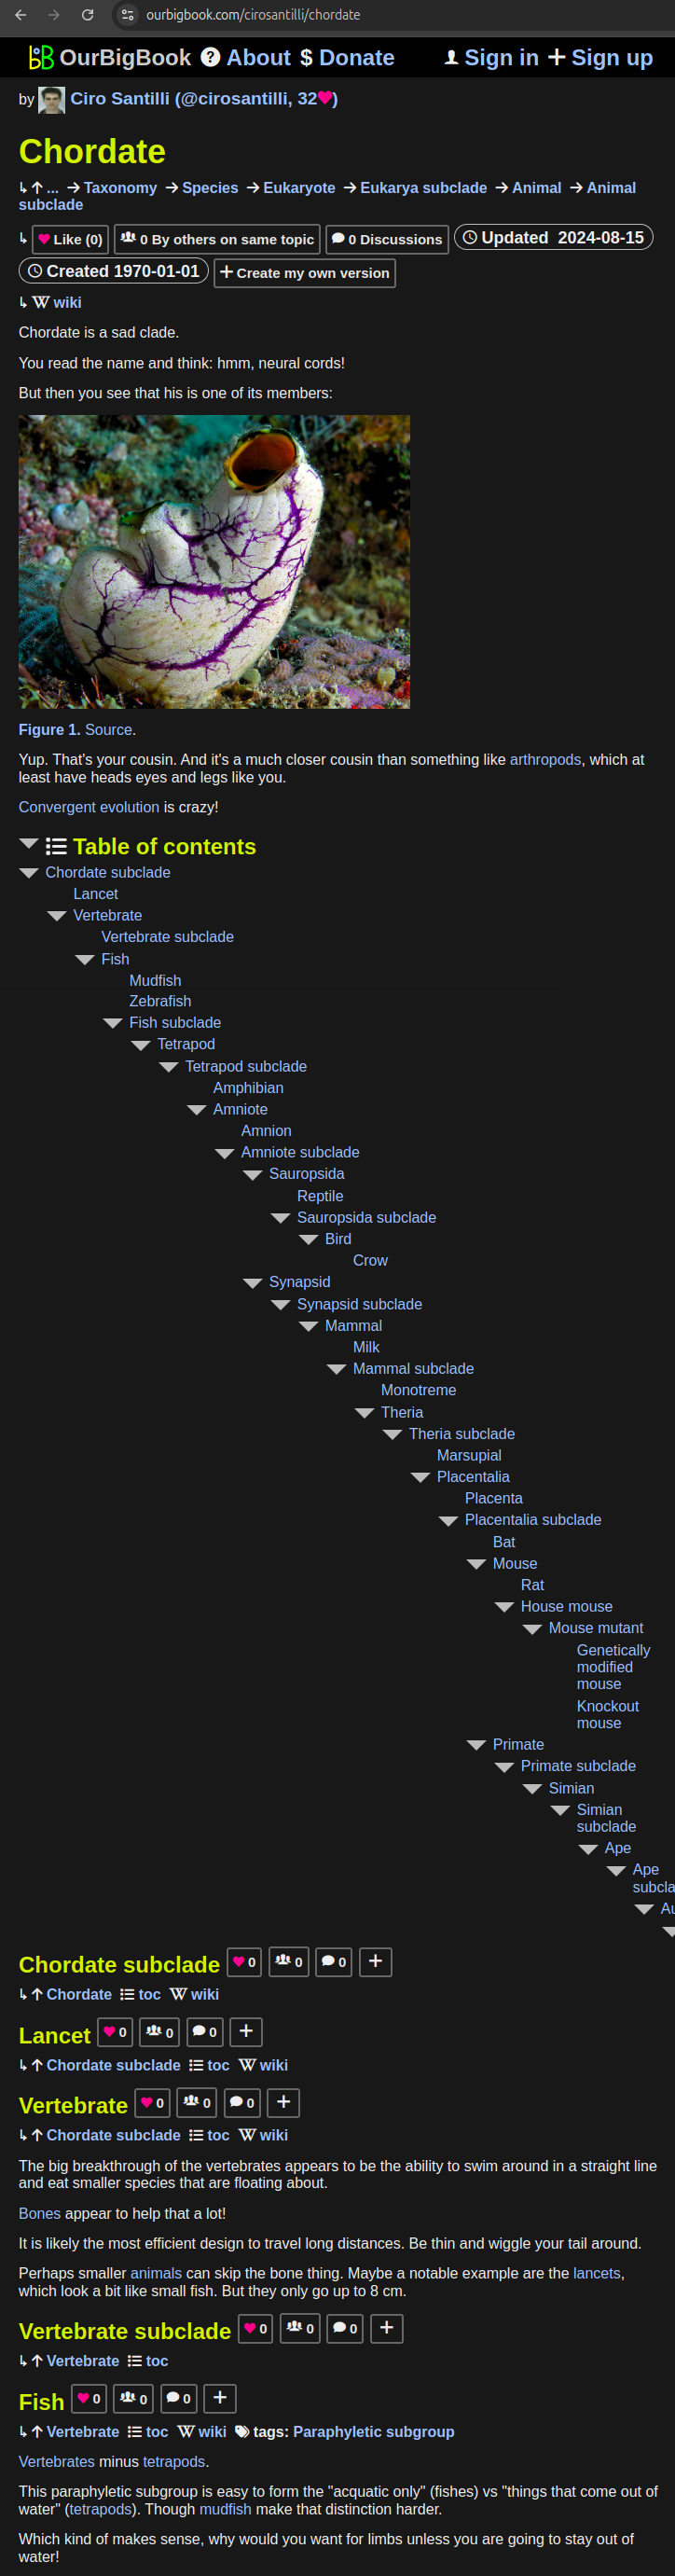
All our software is open source and hosted at: github.com/ourbigbook/ourbigbook
Further documentation can be found at: docs.ourbigbook.com
Feel free to reach our to us for any help or suggestions: docs.ourbigbook.com/#contact