Articles by others on the same topic

Infrared is electromagnetic radiation with wavelengths longer than the red end of ordinarily visible light. A useful named convention is the CIE range to ; the approximate visible range – used in some teaching texts puts the boundary nearer . [ref]
https://openstax.org/books/astronomy-2e/pages/5-2-the-electromagnetic-spectrum. Andrew Fraknoi, David Morrison and Sidney C. Wolff, Astronomy 2e, §5.2: approximate visible range
. Neither number is a sharp physical cutoff of human vision. The CIE divisions IR-A, IR-B and IR-C are respectively –, – and –; the boundaries of near-, middle- and far-infrared vary between applications. [ref]https://cie.co.at/eilvterm/17-21-004. CIE, International Lighting Vocabulary (2020), infrared radiation: ranges and boundary caveats
.Use vacuum wavelength when comparing these ranges. With frequency , speed of light , Planck constant and photon energy ,Thus the CIE infrared interval corresponds approximately to – and – per photon, with the smaller energy at the longer wavelength. A infrared photon has , whereas a ultraviolet photon has . These are calculations from , not measurements of a particular source. A television remote is a familiar approximately source; its information is carried by variations in the emitted radiant flux. [ref]
https://science.nasa.gov/ems/07_infraredwaves/. NASA Science Mission Directorate, Infrared Waves: remote controls and thermal imaging
.Detection and visual perception answer different questions. A photodetector can respond to infrared even when an observer perceives no light; a thermometer detects an increase in temperature after photon absorption. Conversely, a small readout can reflect a small spectral responsivity, rather than absence of incident electromagnetic radiation. Images made from infrared readouts use display colors chosen by the imaging system; those colors are not the colors of the incoming infrared.
The important microscopic mechanisms also differ. In infrared spectroscopy, photon absorption often increases the energy of a normal mode in which chemical bonds stretch or bend. The corresponding optical spectrum helps distinguish molecules by their motions. For the usual electric dipole mechanism, the motion must change the electric dipole moment; matching the frequency alone is not sufficient. [ref]
https://ocw.mit.edu/courses/5-35-introduction-to-experimental-chemistry-fall-2012/3f54ecef6f159a0a11dd60251491e075_MIT5_35F12_Mod1_Background.pdf. MIT 5.35, Fundamentals of Spectroscopy, p. 6: electric-dipole condition for infrared absorption
. Electronic processes can also emit or absorb infrared, so it is not exclusively radiation from molecular motion. [ref]https://openstax.org/books/organic-chemistry/pages/12-6-infrared-spectroscopy. John McMurry, Organic Chemistry, §12.6: molecular motions and infrared absorption
; [ref]https://openstax.org/books/college-physics-2e/pages/24-3-the-electromagnetic-spectrum. Paul Peter Urone and Roger Hinrichs, College Physics 2e, §24.3: sources of infrared radiation
.Infrared is especially useful for observing thermal radiation from objects near everyday temperatures. For an ideal blackbody, Wien's displacement law gives a wavelength peak near . A thermal camera's readout nevertheless depends on emissivity, reflected surroundings and transmission along the path, as well as temperature. [ref]
https://www.flir.com/discover/professional-tools/how-does-emissivity-affect-thermal-imaging/. Teledyne FLIR, How Does Emissivity Affect Thermal Imaging?: emitted and reflected contributions
. A source emitting infrared need not be hot: an infrared remote is useful precisely because a photodetector can distinguish its signal from a background. Visible light and ultraviolet can also cause heating when absorbed; “infrared” names a wavelength range, not a unique form of heat.Herschel's 1800 discovery made the distinction between sight and detection experimentally concrete. His report describes a optical prism spreading sunlight across a white, ruled receiving surface, with three thermometers at different positions near the end of the visible optical spectrum. He observed heating beyond the red edge where no visible color appeared. The result established that sunlight contained invisible radiation less strongly refracted by that optical prism than the visible red; it did not measure a photon energy or establish today's infrared boundaries. [ref]
https://makingscience.royalsociety.org/items/l-and-p_11_125/paper-experiments-on-the-refrangibility-of-the-invisible-rays-of-the-sun-by-william-herschel. William Herschel, Experiments on the refrangibility of the invisible rays of the sun (1800), Royal Society manuscript record
; [ref]https://en.wikisource.org/wiki/Page:Proceedings_of_the_Royal_Society_of_London_Vol_1.djvu/42. Royal Society proceedings, contemporary abstract of Herschel's experiment: apparatus and observations
.A documented modern version by Caltech/IPAC uses a glass optical prism, white paper in a shaded box and three blackened liquid-filled thermometers. Initial readings in shade provide each thermometer's baseline; subsequent readings compare blue, yellow and just beyond red after the bulbs have had time to warm. The measured quantity is the rise in temperature, not a “temperature of a color”. The lesson reports the expected largest rise beyond visible red and specifically discusses matching the bulb coatings and thermometer calibration. Clouds and changes in the projected optical spectrum affect the comparison. [ref]
https://coolcosmos.ipac.caltech.edu/page/lesson_herschel_experiment. Caltech/IPAC Cool Cosmos, The Herschel Experiment (2022): apparatus, readout and calibration controls
.For a stronger modern interpretation, an additional shaded thermometer would monitor ambient drift, exchanging bulbs between positions would test differences between thermometers, and blocking the incident beam would distinguish beam-dependent heating from warmed supports or air. These are suggested controls, not claims about Herschel's historical procedure. Thermal conduction through the mounting and convection can change the readout. A broad bulb also samples a range of wavelengths; the optical prism's transmission and optical dispersion, the bulb's absorption and heat loss all affect the position of the largest rise. In particular, the result does not show that an infrared photon carries more energy than a visible photon.
A simple analytical illustration makes those limitations explicit. Let be the bulb's excess temperature, its heat capacity, its effective heat-loss coefficient in , and the absorbed power. Assume one uniform bulb temperature, constant ambient temperature, constant , and losses linear in . Thenfor a beam switched on at with . After switching the beam off at , . The exponential function follows by solving this linear differential equation. The steady excess temperature measures ; it is not a direct measurement of the optical spectrum. With illustrative and , . Absorbed powers of and give steady rises of and , regardless of which wavelengths supplied that absorbed power.
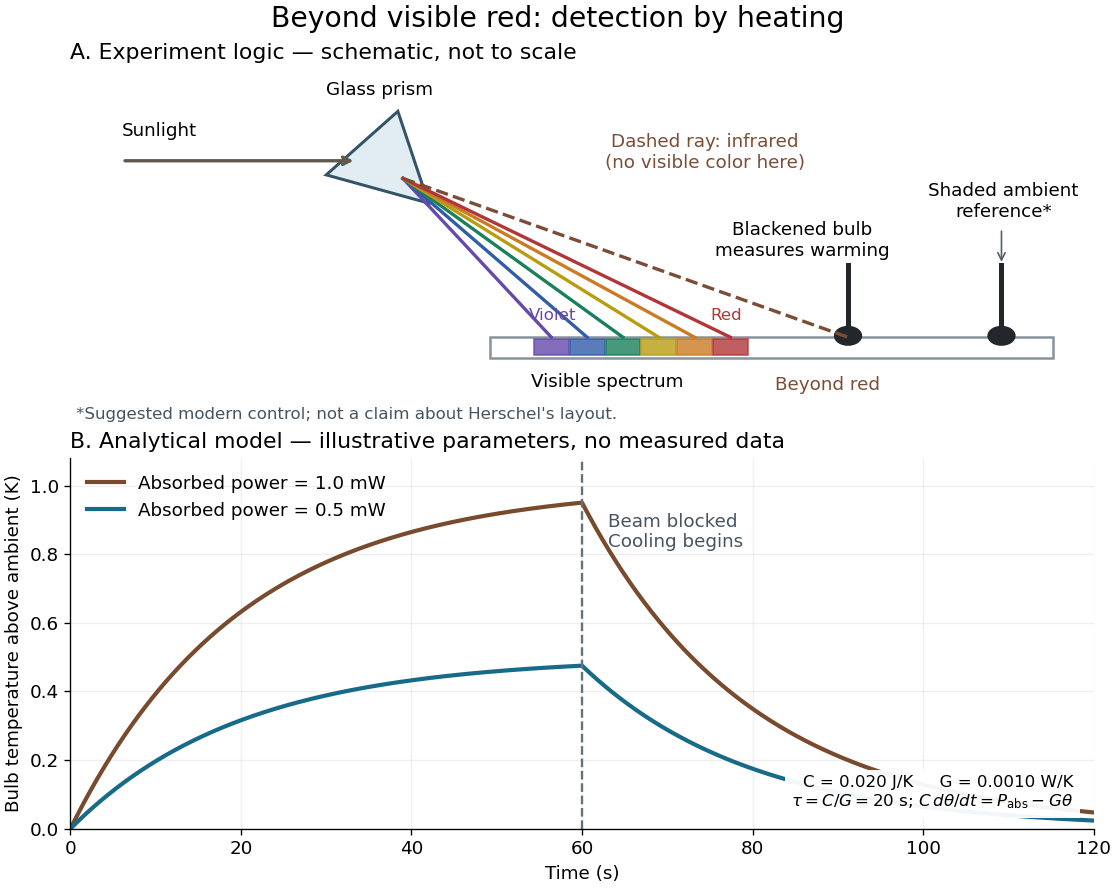
Detecting infrared by a temperature rise: a Herschel-style schematic and an analytical thermal-response model
. Details. 
The upper schematic represents the logic of the optical prism experiment; its light ray positions are not a calibrated wavelength scale. The lower curves use the illustrative heat-balance model, with the beam blocked at ; they are not historical or modern measured data. The beauty of the experiment is that a simple change of detector extends observation beyond what the eye can perceive.