Topics (194k) Articles (196k) Users (296) Discussions (237) Comments (383) Files (715) New article

Bootstrapping is a statistical resampling technique used to estimate the distribution of a sample statistic by repeatedly resampling with replacement from the data set. The central idea is to create multiple simulated samples (called "bootstrap samples"), allowing for the assessment of variability and confidence intervals of the statistic of interest without relying on strong parametric assumptions. ### Key Steps in Bootstrapping: 1. **Original Sample**: Start with an observed dataset of size \( n \).
The Bootstrap error-adjusted single-sample technique is a statistical method that combines bootstrap resampling with error adjustment to provide more reliable estimates from a single sample of data. Here's a breakdown of the key components and concepts involved: ### Bootstrap Resampling - **Bootstrap Method**: This is a resampling technique used to estimate the distribution of a statistic (like mean, median, variance, etc.) by repeatedly sampling, with replacement, from the observed data.
Bootstrap aggregating, commonly known as bagging, is an ensemble machine learning technique designed to improve the accuracy and robustness of model predictions. The primary idea behind bagging is to reduce variance and combat overfitting, especially in models that are highly sensitive to fluctuations in the training data, such as decision trees. Here’s how bagging works: 1. **Bootstrapping**: From the original training dataset, multiple subsets of data are created through a process called bootstrapping.
Bayesian inference using Gibbs sampling is a statistical technique used to estimate the posterior distribution of parameters in a Bayesian model. This approach is particularly useful when the posterior distribution is complex and difficult to sample from directly. Here's a breakdown of the components involved: ### Bayesian Inference Bayesian inference is based on Bayes' theorem, which updates the probability estimate for a hypothesis as additional evidence is available.
The auxiliary particle filter (APF) is an advanced version of the traditional particle filter, which is used for nonlinear and non-Gaussian state estimation problems, often in the context of dynamic systems. The particle filter represents the posterior distribution of a system's state using a set of weighted samples (particles). It is particularly useful in situations where the state transition and/or observation models are complex and cannot be easily linearized. **Key Characteristics of the Auxiliary Particle Filter:** 1.
ArviZ is an open-source library in Python primarily used for exploratory analysis of Bayesian models. It provides tools for analyzing and visualizing the results of probabilistic models that are typically estimated using libraries such as PyMC, Stan, or TensorFlow Probability. Key features of ArviZ include: 1. **Visualization**: It includes a variety of plotting functions to help users visualize posterior distributions, compare models, and assess convergence through tools like trace plots, pair plots, and posterior predictive checks.
"Artificial precision" is not a widely recognized term in the fields of technology, mathematics, or artificial intelligence. However, based on the components of the phrase, it could refer to the following concepts: 1. **Inaccuracy in Precision**: It might describe a situation where systems, models, or algorithms are overly precise in their outputs or calculations, leading to misleading interpretations or results.
An Artificial Neural Network (ANN) is a computational model inspired by the way biological neural networks in the human brain process information. ANNs are a core component of machine learning and artificial intelligence, particularly in the field of deep learning. Key components of an ANN include: 1. **Neurons**: The basic unit of an ANN, analogous to biological neurons. Each neuron receives input, processes it, and produces an output.
Antithetic variates is a variance reduction technique used in the context of Monte Carlo simulation. The main purpose of this technique is to improve the efficiency of the simulation by reducing the variance of the estimator. The idea behind antithetic variates is to generate pairs of dependent random variables that are negatively correlated. This negation helps to balance out the fluctuations that might occur in the estimated outcomes.
Variance reduction is a statistical technique used to decrease the variability of an estimator or a simulation output, thereby increasing the precision of the estimate of a parameter or the accuracy of a simulation. It is commonly applied in the contexts of statistics, machine learning, and simulation modeling to improve the reliability of results.
Statistical software refers to computer programs and applications designed to perform statistical analysis, data management, and data visualization. These tools allow users to analyze data effectively, interpret results, and make informed decisions based on statistical findings. Statistical software can handle a variety of tasks, including: 1. **Data Entry and Management**: Facilitating the organization, manipulation, and preparation of datasets for analysis.
A statistical database is a type of database that is specifically designed to store, manage, and provide access to statistical data. These databases are often used by researchers, analysts, and policymakers to extract insights, perform statistical analyses, and generate reports based on aggregated data. Here are some key characteristics and components of statistical databases: 1. **Data Structure**: Statistical databases typically store data in structured formats, often in tables, where data entries correspond to specific variables.
Non-uniform random numbers are random numbers that do not have a uniform distribution over a specified range. In a uniform distribution, every number within the defined interval has an equal probability of being selected. In contrast, non-uniform random numbers are generated according to a specific probability distribution, which means some values have a higher likelihood of being chosen than others.
Data mining is the process of discovering patterns, trends, and knowledge from large sets of data using a variety of techniques. It combines principles from fields such as statistics, machine learning, artificial intelligence, and database systems to extract useful information and transform it into an understandable structure for further use. Key components of data mining include: 1. **Data Collection**: Gathering large amounts of data from various sources, which can include databases, data warehouses, or online sources.
Computational statistics journals are academic publications that focus on the development and application of computational methods and algorithms for statistical analysis. These journals typically cover a wide range of topics, including: 1. **Statistical Methods**: The creation and evaluation of new statistical methodologies, particularly those that leverage computational techniques. 2. **Simulation Studies**: Research that involves simulation methods to explore statistical problems or validate statistical models.
Artificial Neural Networks (ANNs) are computational models inspired by the way biological neural networks in the human brain operate. They consist of interconnected groups of artificial neurons, where each neuron acts as a processing unit that takes in input, applies a transformation, and produces an output. Here are the key components and concepts related to ANNs: ### Key Components 1. **Neurons**: The basic processing units in an ANN, analogous to biological neurons.
Algorithmic inference refers to a systematic approach used to draw conclusions or make predictions based on data using algorithms. It combines elements of statistical inference, machine learning, and computational methods to analyze data and extract meaningful patterns or insights. Here are some key concepts related to algorithmic inference: 1. **Data-Driven Decision Making**: It leverages available datasets to inform decision-making processes, allowing for more objective and data-supported conclusions.
William Sealy Gosset (1876–1937) was an influential Irish statistician known primarily for developing the concept of the t-distribution, which is widely used in statistical inference. He worked at the Guinness Brewery in Dublin, where he applied statistical methods to improve the quality control of brewing processes. Gosset published under the pseudonym "Student," which is how the t-distribution is often referred to as the "Student's t-distribution.
Robert Gentleman is an Australian statistician and a prominent figure in the development of statistical software, particularly in relation to the R programming language. He is known for co-founding the R project along with Ross Ihaka. R has become one of the most widely used programming languages for statistical computing and data analysis. Robert Gentleman has contributed to various aspects of statistical methodologies and applications, and he has also been involved in bioinformatics, where he has worked on techniques for analyzing biological data.
Pinned article: Introduction to the OurBigBook Project
Welcome to the OurBigBook Project! Our goal is to create the perfect publishing platform for STEM subjects, and get university-level students to write the best free STEM tutorials ever.
Everyone is welcome to create an account and play with the site: ourbigbook.com/go/register. We belive that students themselves can write amazing tutorials, but teachers are welcome too. You can write about anything you want, it doesn't have to be STEM or even educational. Silly test content is very welcome and you won't be penalized in any way. Just keep it legal!
Intro to OurBigBook
. Source. We have two killer features:
- topics: topics group articles by different users with the same title, e.g. here is the topic for the "Fundamental Theorem of Calculus" ourbigbook.com/go/topic/fundamental-theorem-of-calculusArticles of different users are sorted by upvote within each article page. This feature is a bit like:
- a Wikipedia where each user can have their own version of each article
- a Q&A website like Stack Overflow, where multiple people can give their views on a given topic, and the best ones are sorted by upvote. Except you don't need to wait for someone to ask first, and any topic goes, no matter how narrow or broad
This feature makes it possible for readers to find better explanations of any topic created by other writers. And it allows writers to create an explanation in a place that readers might actually find it.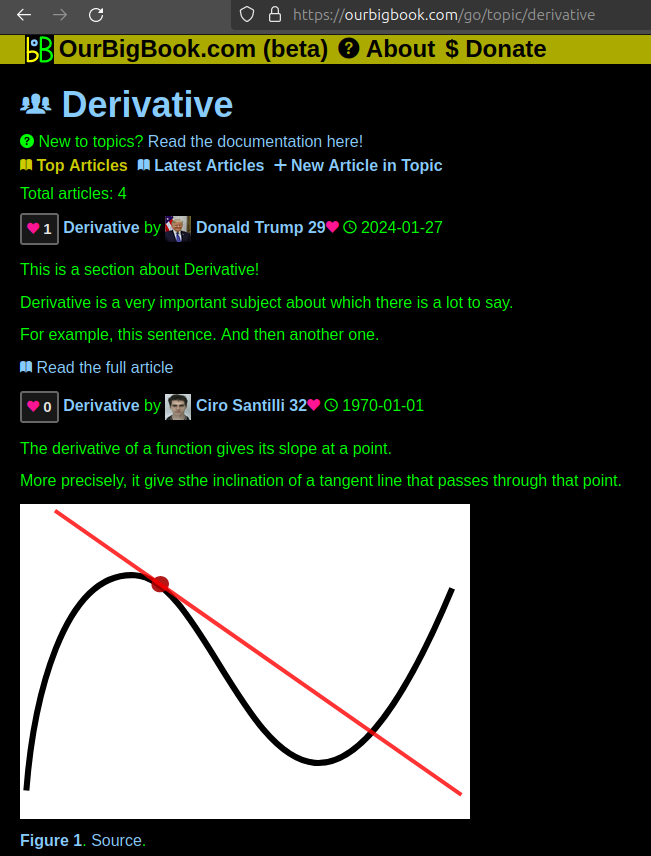
Figure 1. Screenshot of the "Derivative" topic page. View it live at: ourbigbook.com/go/topic/derivativeVideo 2. OurBigBook Web topics demo. Source. - local editing: you can store all your personal knowledge base content locally in a plaintext markup format that can be edited locally and published either:This way you can be sure that even if OurBigBook.com were to go down one day (which we have no plans to do as it is quite cheap to host!), your content will still be perfectly readable as a static site.
- to OurBigBook.com to get awesome multi-user features like topics and likes
- as HTML files to a static website, which you can host yourself for free on many external providers like GitHub Pages, and remain in full control
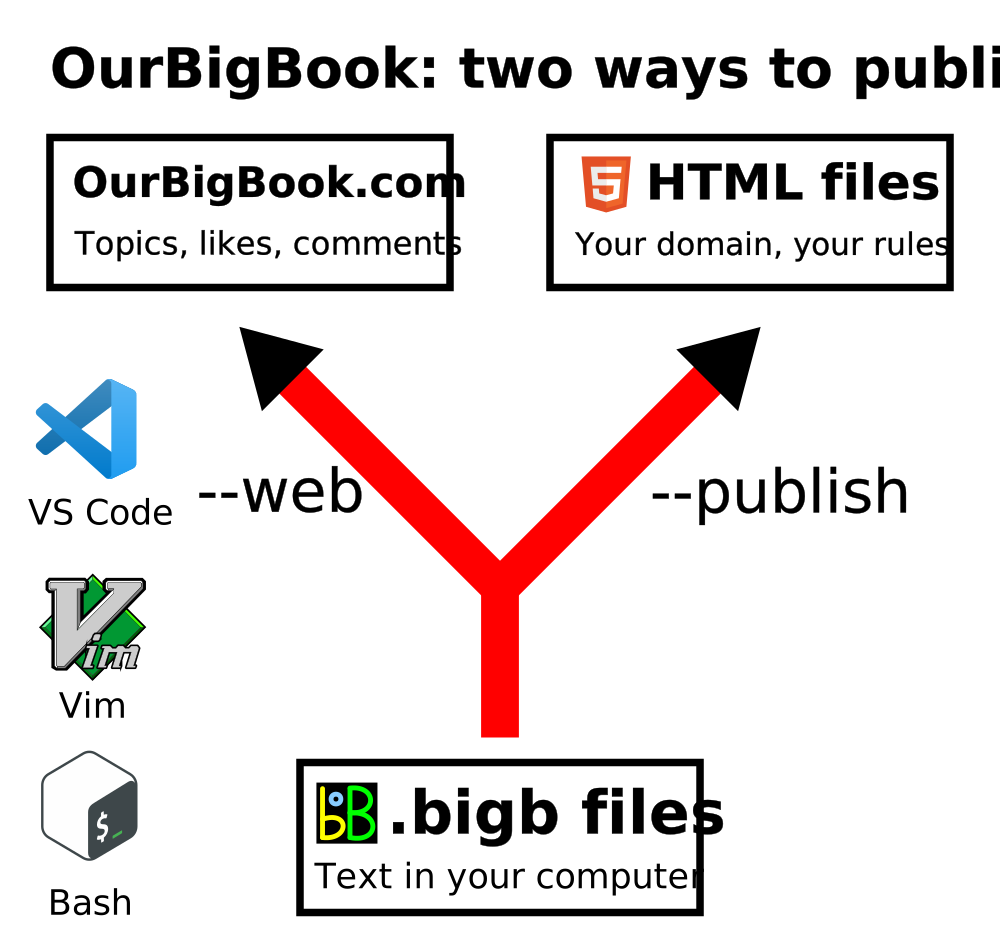
Figure 2. You can publish local OurBigBook lightweight markup files to either OurBigBook.com or as a static website.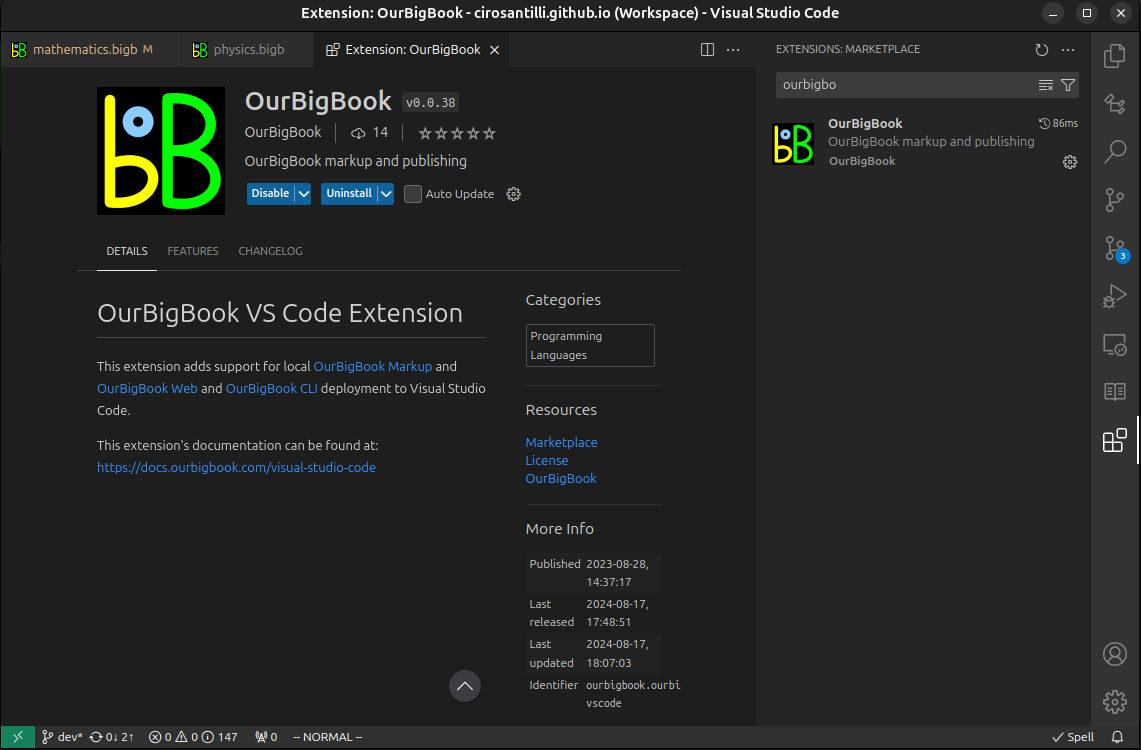
Figure 3. Visual Studio Code extension installation.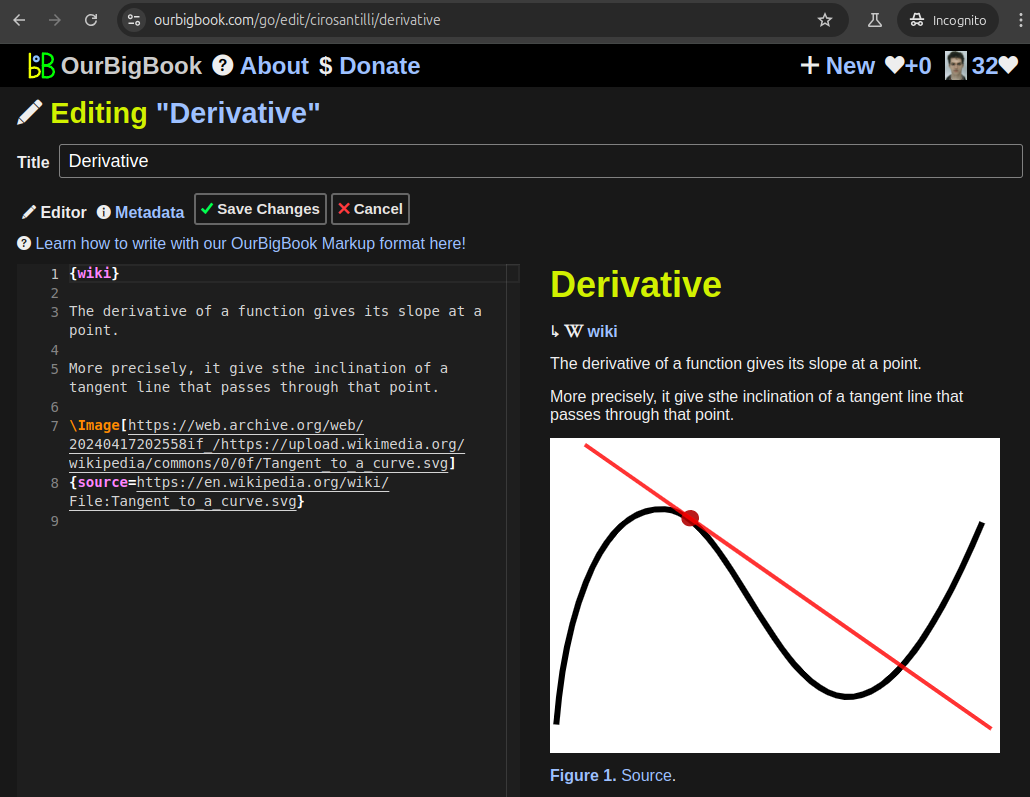
Figure 5. . You can also edit articles on the Web editor without installing anything locally. Video 3. Edit locally and publish demo. Source. This shows editing OurBigBook Markup and publishing it using the Visual Studio Code extension. 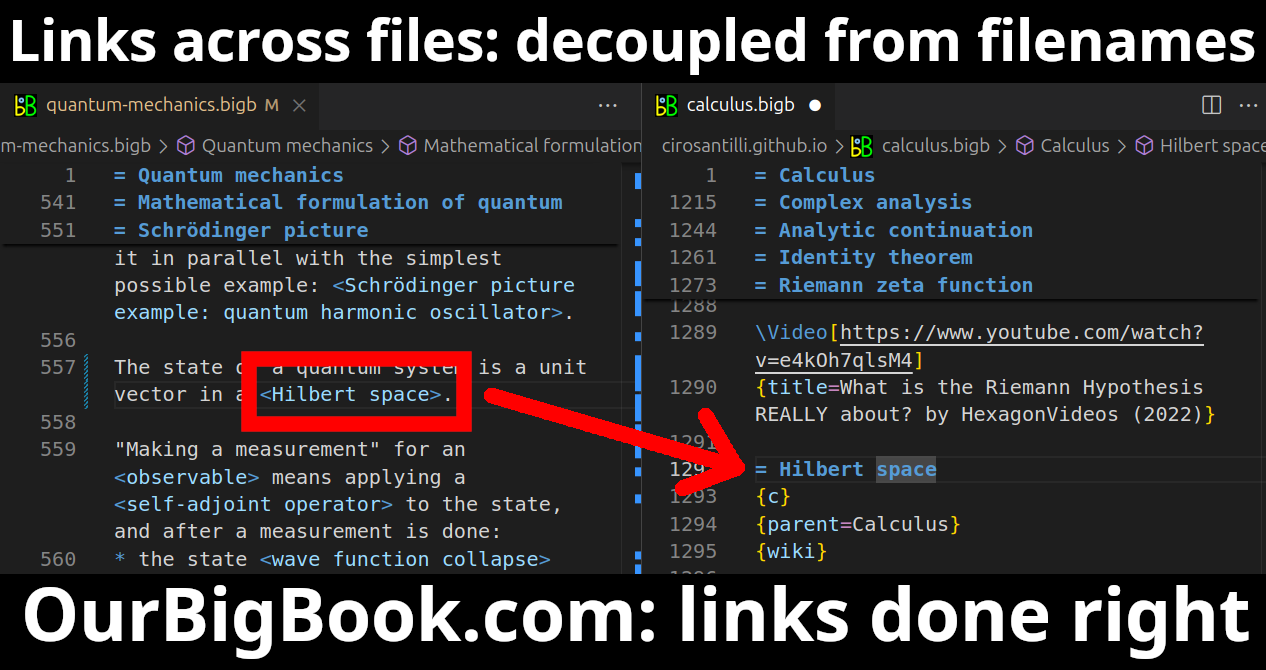
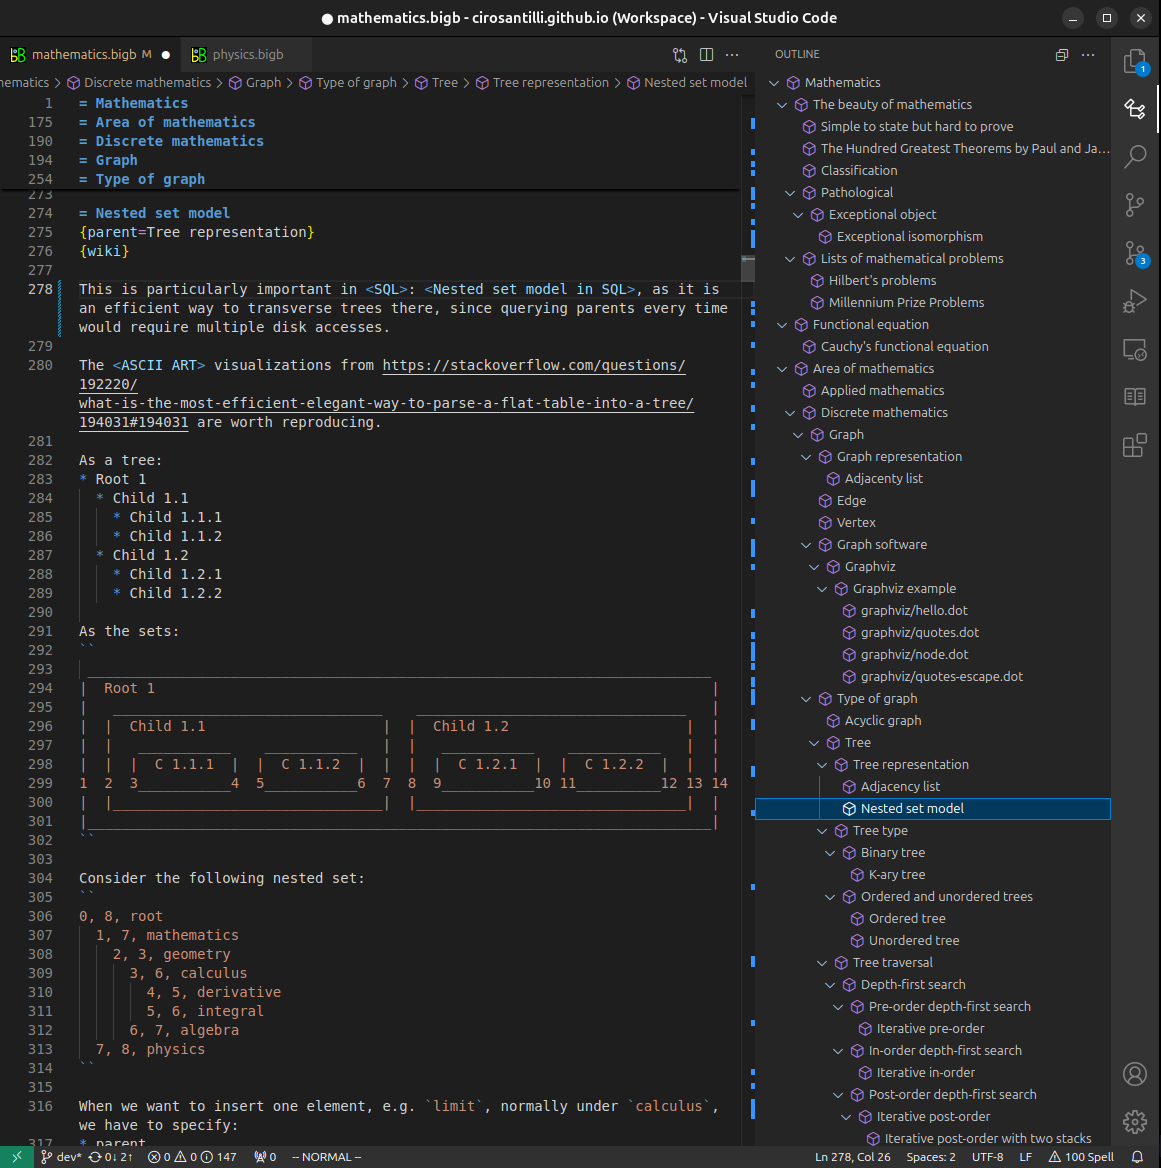
- Infinitely deep tables of contents:

All our software is open source and hosted at: github.com/ourbigbook/ourbigbook
Further documentation can be found at: docs.ourbigbook.com
Feel free to reach our to us for any help or suggestions: docs.ourbigbook.com/#contact