Topics (203k) Articles (205k) Users (298) Discussions (237) Comments (383) Files (715) New article

The Ingredient-Flavor Network is a concept that explores the relationships between various food ingredients and their associated flavors. It is often represented as a network where ingredients serve as nodes and their flavor characteristics or pairings are represented as edges connecting these nodes. This network can help chefs, food scientists, and food enthusiasts to understand which ingredients complement each other based on shared flavor compounds or culinary traditions.
A Graph-Structured Stack is a data structure that extends the traditional stack concept by organizing data elements in a graph format rather than a linear sequence. In a traditional stack, elements are added and removed in a Last-In-First-Out (LIFO) manner, where each element only has a single predecessor and successor. In contrast, a graph-structured stack allows for more complex relationships between elements.
A factor graph is a type of bipartite graph used in statistics, probability, and machine learning to represent the factorization of a probability distribution. It provides a visual and structural way to denote how variables and factors (functions that define relationships between variables) are interconnected. ### Key Components: 1. **Variables**: These are typically represented as nodes on one side of the graph. Each variable can be a random variable in a probabilistic model.
Evolutionary graph theory is a subfield of mathematics that applies concepts from graph theory to understand the dynamics of evolutionary processes, particularly how populations evolve over time within structured environments. It combines elements of population genetics, evolutionary biology, and network theory. In evolutionary graph theory, individuals in a population are represented as vertices (or nodes) in a graph, and the edges (connections between nodes) represent the interactions or relationships between these individuals.
"Eodermdrome" does not appear to be a recognized term in the medical community or in scientific literature as of my last update. It may be a misspelling or a combination of terms related to dermatology, such as "derm" (skin) and "drome" (which often refers to a running or a syndrome).
A disjunctive graph is a concept often encountered in the fields of graph theory and computer science, particularly in relation to representation and analysis of logical expressions, automata, and certain types of optimization problems. However, the term "disjunctive graph" is not universally defined, and its meaning can vary based on the context.
A control-flow graph (CFG) is a representation used in computer science and software engineering to model the flow of control within a program or a function. It is particularly useful in the fields of compiler design, static analysis, and program optimization. ### Key Characteristics of a Control-flow Graph: 1. **Nodes**: Each node in a CFG represents a basic block of code, which is a straight-line sequence of instructions with no control transfers (like jumps or branches) except at the start and end.
A constraint graph is a graphical representation used in various fields such as computer science, mathematics, and operational research, particularly in the context of constraint satisfaction problems (CSPs) and layout problems. In the realm of layout design—such as for electronic circuits, user interfaces, or other spatial arrangements—a constraint graph helps illustrate the relationships and restrictions between different elements or components.
A **constraint graph** is a graphical representation of a set of variables and the constraints that exist between them. It is particularly useful in fields like artificial intelligence, operations research, and computer science, especially for problems involving constraint satisfaction. ### Components of a Constraint Graph: 1. **Nodes (Vertices)**: Each node represents a variable in the problem. For example, if you are solving a scheduling problem, each variable could represent a specific task that needs to be scheduled.
A configuration graph is a type of graph used to represent the states and transitions of a system, particularly in the context of distributed systems, robotics, or combinatorial problems. In general, configuration graphs help visualize how different configurations (or states) of a system can transition from one to another based on certain rules or actions.
A conceptual graph is a form of knowledge representation that is used to describe and visualize concepts and their relationships in a structured way. Developed by Roger Schank and later refined by others, conceptual graphs are particularly useful in artificial intelligence, natural language processing, and cognitive science. ### Components of Conceptual Graphs 1. **Nodes**: Represent concepts, entities, or objects. Each node can describe a specific concept or a category in the graph.
A collaboration graph is a type of visual representation that illustrates the relationships and interactions between individuals or entities involved in a collaborative effort or network. This can apply to various contexts, such as: 1. **Social Networks**: In social media or professional networking, a collaboration graph might show how different users or groups connect and interact with each other, highlighting relationships, common interactions, and the flow of information or resources.
The Code Property Graph (CPG) is a data structure that combines elements from abstract syntax trees (AST), control flow graphs (CFG), and call graphs to provide a comprehensive representation of source code. It is primarily used in the field of static analysis and program analysis to facilitate various tasks such as vulnerability detection, code quality assessment, and automated program verification. Key features of the Code Property Graph include: 1. **Unified Representation**: CPG integrates different representations of code into a single graph.
As of my last knowledge update in October 2021, there was no well-known entity specifically referred to as the "Co-stardom network." It's possible that it's a new or niche initiative, organization, or platform that has emerged since then. If the term is related to a specific context, like entertainment, social media, or a particular community, additional details could help clarify its meaning.
A citation graph is a directed graph that represents the relationship between academic papers, articles, patents, or other scholarly works based on citations. In a citation graph: - **Nodes**: Each node corresponds to a publication or scholarly work. - **Edges**: A directed edge from node A to node B indicates that publication A cites publication B. This means that A references or relies on B in its content.
The Bratteli–Vershik diagram is a combinatorial and graphical representation used primarily in the study of dynamical systems, particularly in the context of partitioning and representing the structure of infinite-dimensional objects, such as representing the flow of certain dynamical systems or the actions of groups on spaces.
A Bratteli diagram is a graphical representation used in the study of certain types of mathematical structures, particularly in the fields of operator algebras and dynamical systems. It is named after the mathematician Ole Bratteli, who introduced this concept. ### Key Features of Bratteli Diagrams: 1. **Structure**: A Bratteli diagram is a directed graph comprised of vertices and edges.
In computer science, a **tree** is a widely-used data structure that simulates a hierarchical organization of data. It consists of nodes connected by edges and has the following key characteristics: 1. **Roots and Nodes**: - The topmost node is called the *root*. - Each node can have zero or more child nodes (subsequent nodes branching from it). - A node that does not have any children is termed a *leaf* node.
Graph data structures are a mathematical representation used to capture relationships between pairs of objects. A graph consists of two fundamental components: 1. **Vertices (or Nodes)**: These are the individual entities or points in the graph. Each vertex represents an object in the data set. 2. **Edges**: These are the connections or relationships between the vertices. An edge can connect two vertices and may represent various types of associations, such as friendship in social networks, pathways in maps, or relationships in databases.
Zero-configuration networking (Zeroconf) is a set of technologies that automatically creates a usable network infrastructure without manual intervention or the need for configuration. It allows devices to discover each other, assign IP addresses, and establish services on a local network seamlessly and typically without user involvement.
Pinned article: Introduction to the OurBigBook Project
Welcome to the OurBigBook Project! Our goal is to create the perfect publishing platform for STEM subjects, and get university-level students to write the best free STEM tutorials ever.
Everyone is welcome to create an account and play with the site: ourbigbook.com/go/register. We belive that students themselves can write amazing tutorials, but teachers are welcome too. You can write about anything you want, it doesn't have to be STEM or even educational. Silly test content is very welcome and you won't be penalized in any way. Just keep it legal!
Intro to OurBigBook
. Source. We have two killer features:
- topics: topics group articles by different users with the same title, e.g. here is the topic for the "Fundamental Theorem of Calculus" ourbigbook.com/go/topic/fundamental-theorem-of-calculusArticles of different users are sorted by upvote within each article page. This feature is a bit like:
- a Wikipedia where each user can have their own version of each article
- a Q&A website like Stack Overflow, where multiple people can give their views on a given topic, and the best ones are sorted by upvote. Except you don't need to wait for someone to ask first, and any topic goes, no matter how narrow or broad
This feature makes it possible for readers to find better explanations of any topic created by other writers. And it allows writers to create an explanation in a place that readers might actually find it.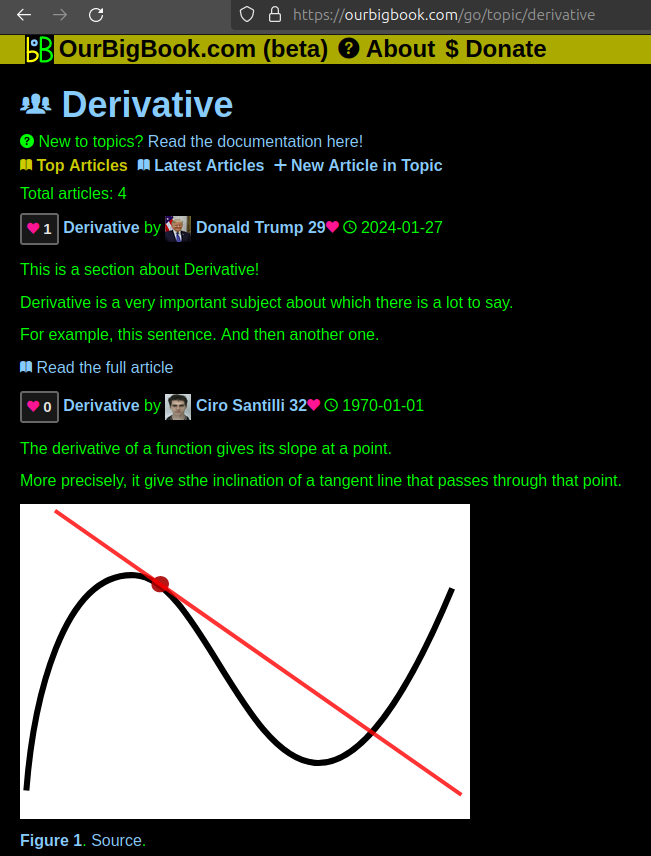
Figure 1. Screenshot of the "Derivative" topic page. View it live at: ourbigbook.com/go/topic/derivativeVideo 2. OurBigBook Web topics demo. Source. - local editing: you can store all your personal knowledge base content locally in a plaintext markup format that can be edited locally and published either:This way you can be sure that even if OurBigBook.com were to go down one day (which we have no plans to do as it is quite cheap to host!), your content will still be perfectly readable as a static site.
- to OurBigBook.com to get awesome multi-user features like topics and likes
- as HTML files to a static website, which you can host yourself for free on many external providers like GitHub Pages, and remain in full control
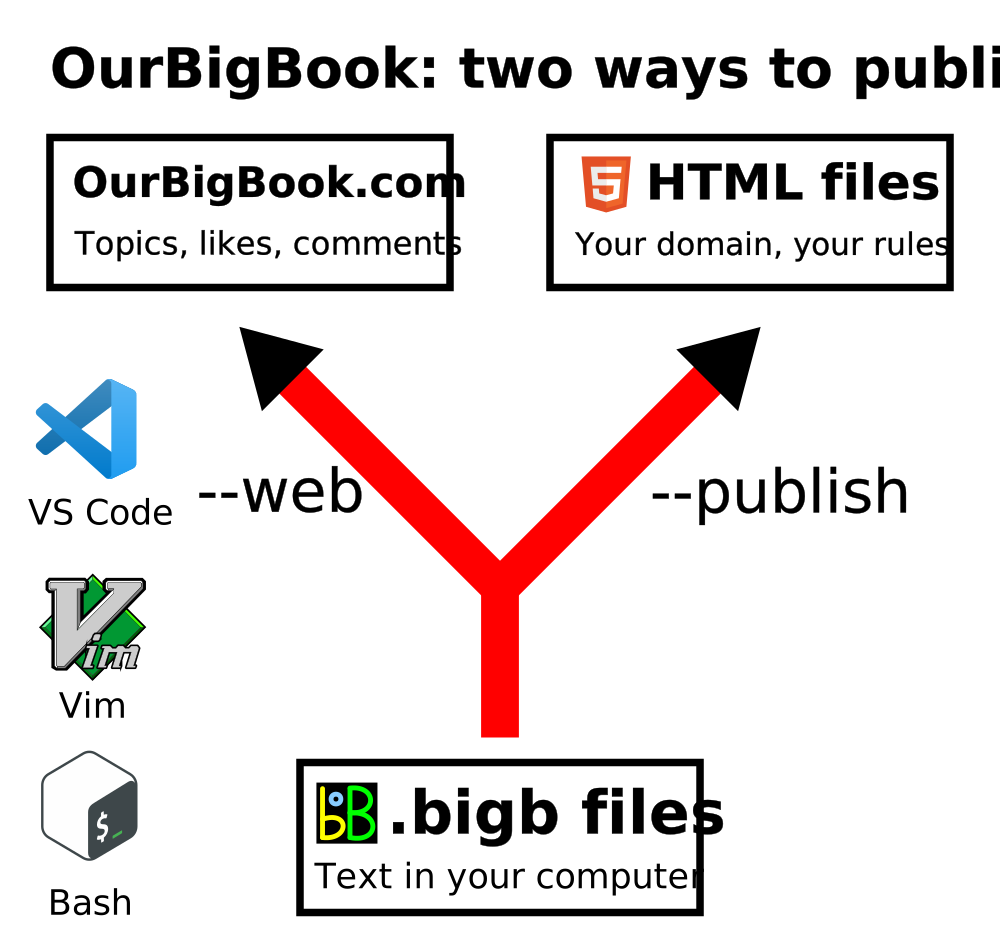
Figure 2. You can publish local OurBigBook lightweight markup files to either OurBigBook.com or as a static website.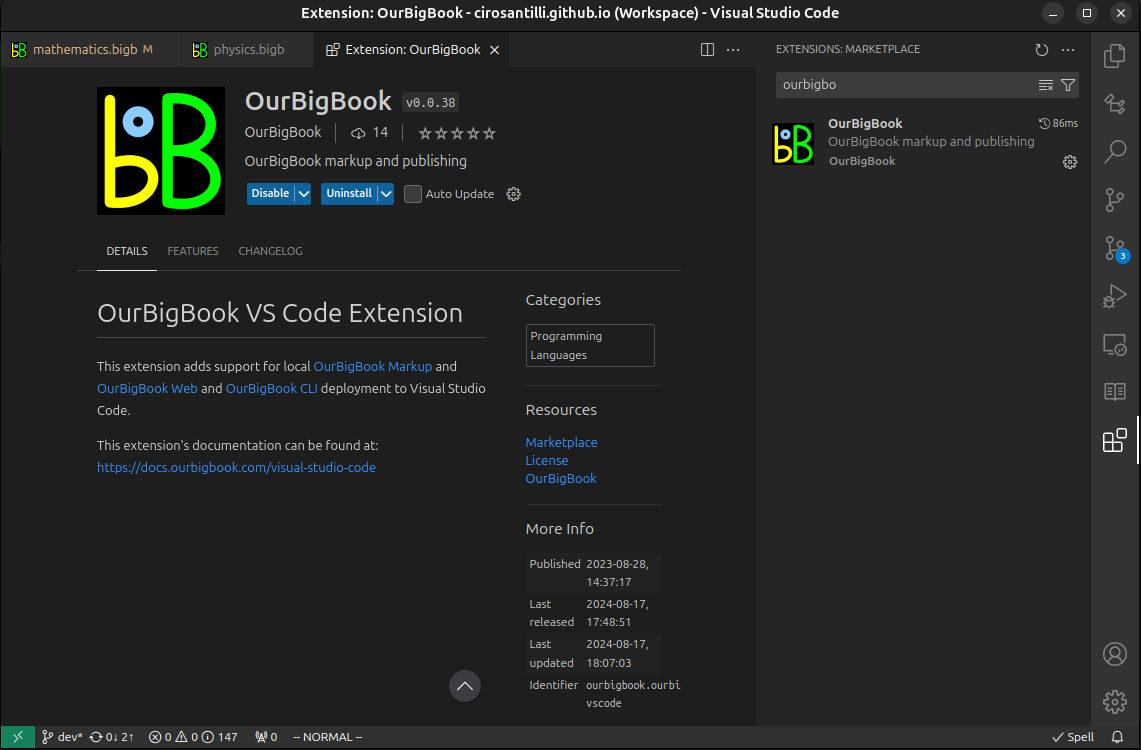
Figure 3. Visual Studio Code extension installation.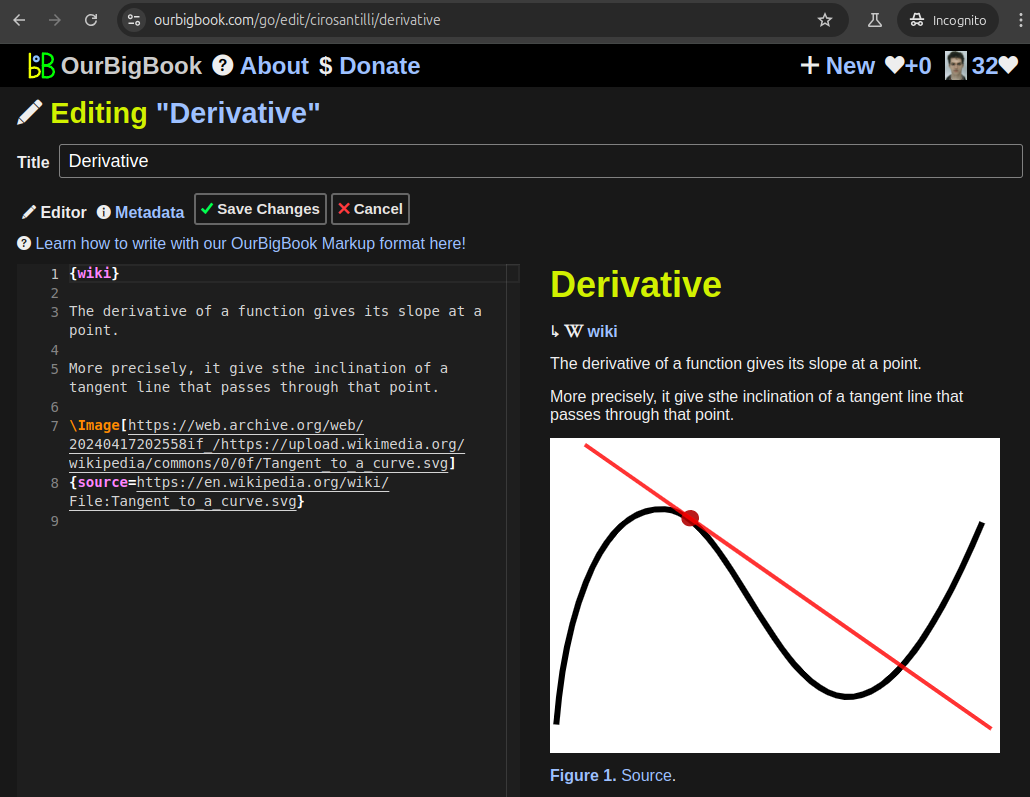
Figure 5. . You can also edit articles on the Web editor without installing anything locally. Video 3. Edit locally and publish demo. Source. This shows editing OurBigBook Markup and publishing it using the Visual Studio Code extension. 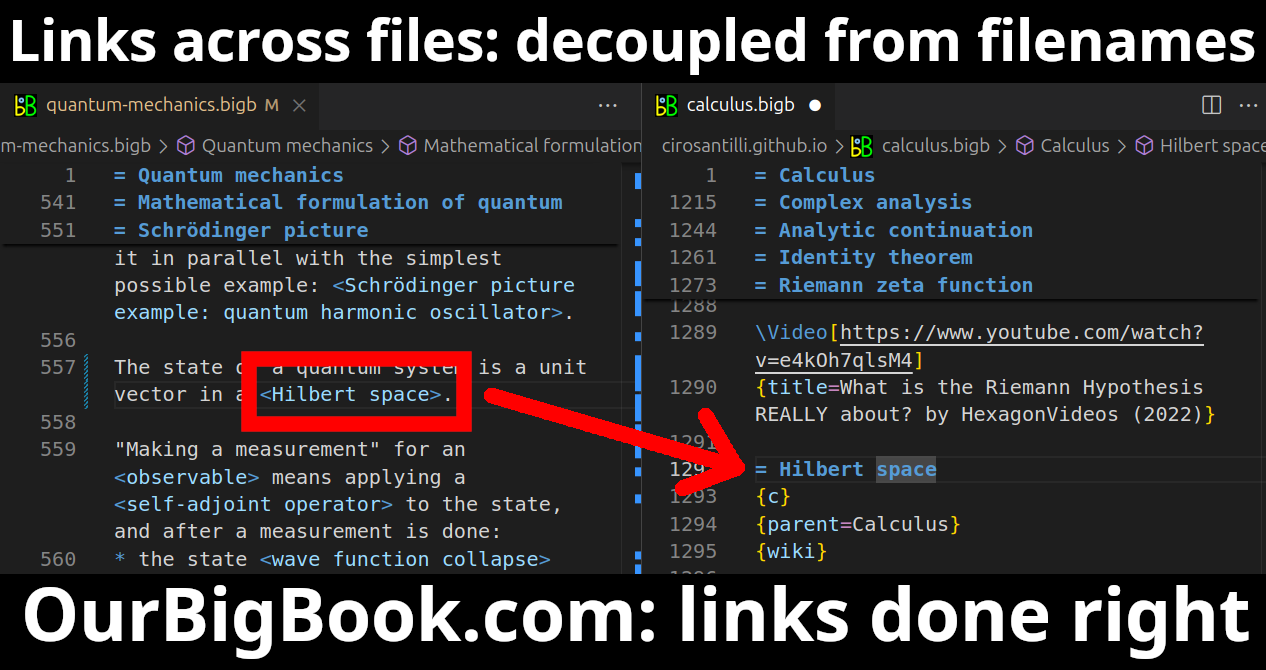
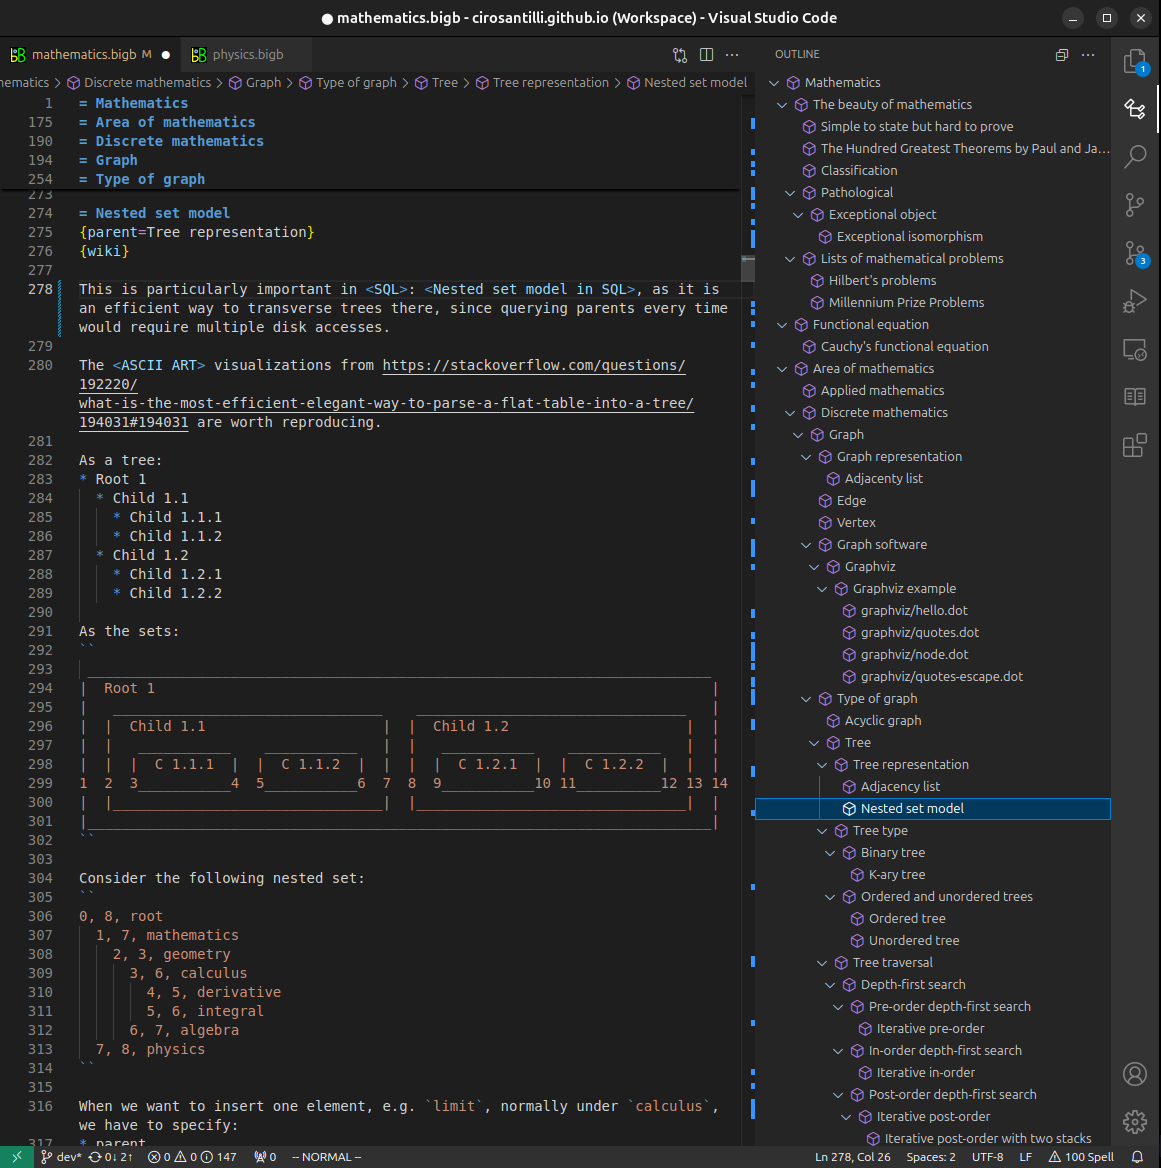
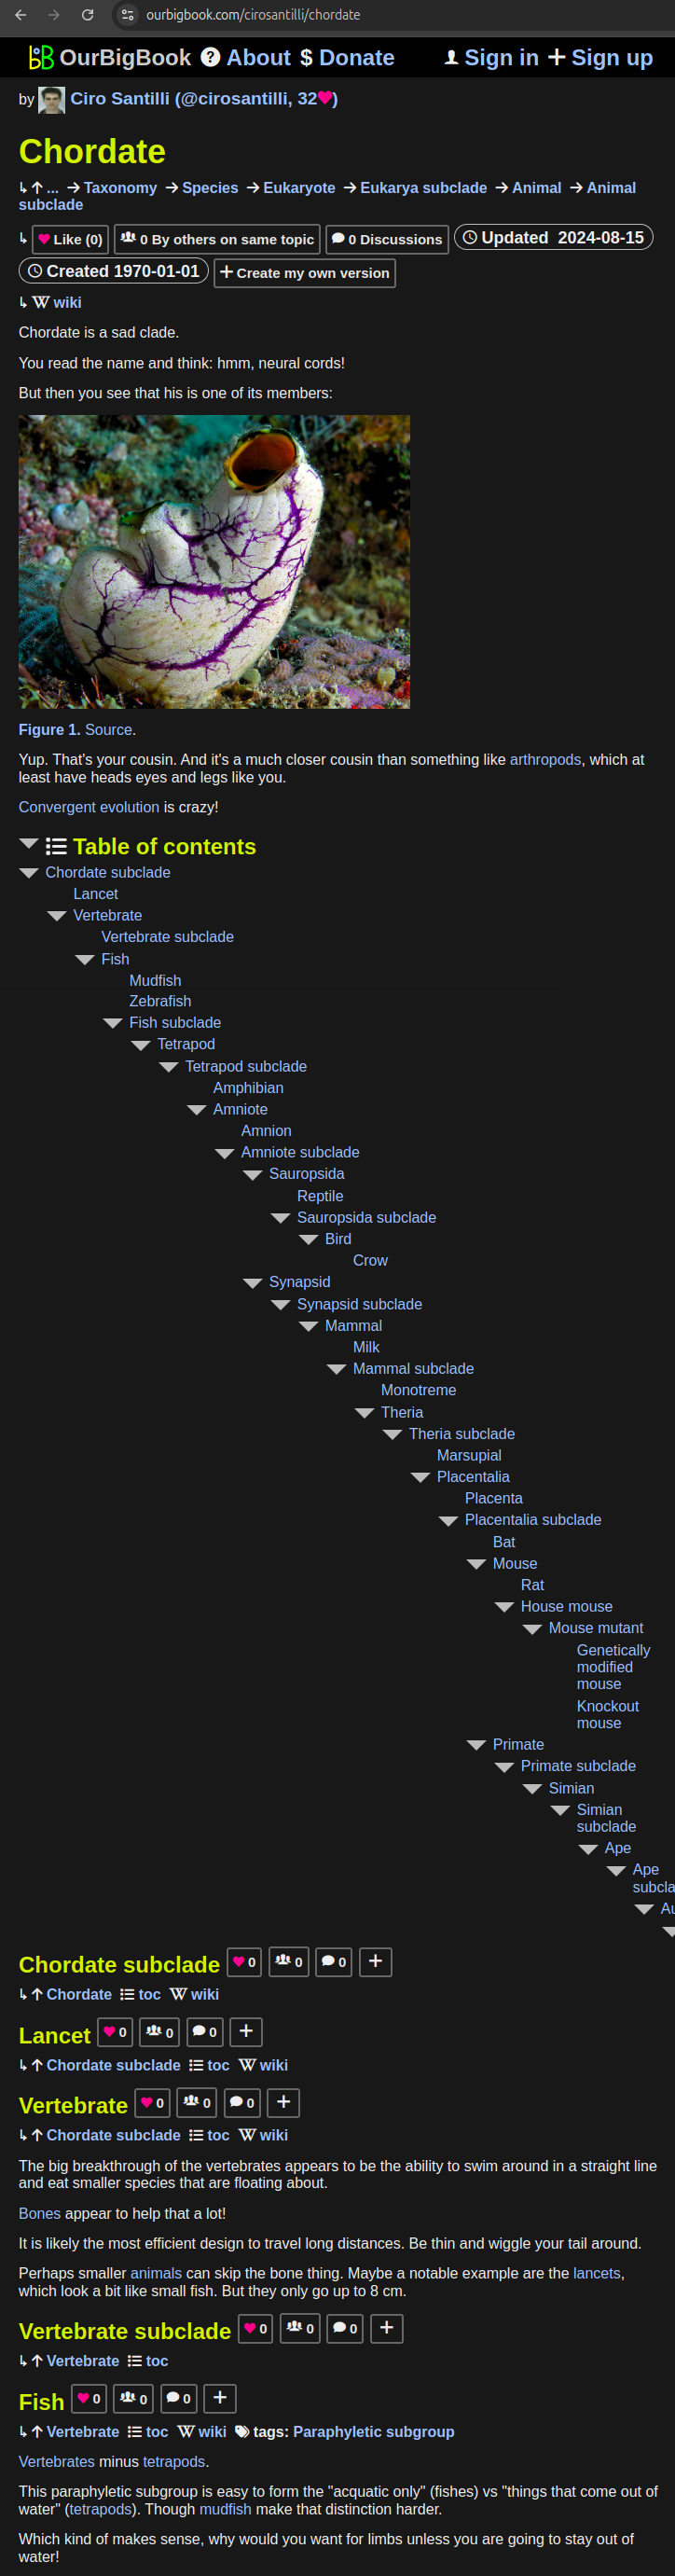
- Infinitely deep tables of contents:
All our software is open source and hosted at: github.com/ourbigbook/ourbigbook
Further documentation can be found at: docs.ourbigbook.com
Feel free to reach our to us for any help or suggestions: docs.ourbigbook.com/#contact