Discrete quantum effect observed in superconductors with a small insulating layer, a device known as a Josephson junction.
To understand the behaviour effect, it is important to look at the Josephson equations consider the following Josephson effect regimes separately:
Bibliography:
- www.youtube.com/watch?v=cnZ6exn2CkE "Superconductivity: Professor Brian Josephson". Several random excerpts from Cambridge people talking about the Josephson effect
In 1962 Brian Josephson published his inaugural paper predicting the effect as Section "Possible new effects in superconductive tunnelling".
In 1963 Philip W. Anderson and John M. Rowell published their paper that first observed the effect as Section "Possible new effects in superconductive tunnelling".
Some golden notes can be found at True Genius: The Life and Science of John Bardeen page 224 and around. Philip W. Anderson commented:
As part of the course Anderson had introduced the concept of broken symmetry in superconductors. Josephson "was fascinated by the idea of broken symmetry, and wondered whether there could be any way of observing it experimentally."
The inaugural that predicted the Josephson effect.
Published on Physics Letters, then a new journal, before they split into Physics Letters A and Physics Letters B. True Genius: The Life and Science of John Bardeen mentions that this choice was made rather than the more prestigious Physical Review Letters because they were not yet so confident about the results.
Paper by Philip W. Anderson and John M. Rowell that first (?) experimentally observed the Josephson effect.
Paywalled by the American Physical Society as of 2023 at: journals.aps.org/prl/abstract/10.1103/PhysRevLett.10.230
They used tin-oxide-lead tunnel at 1.5 K. TODO oxide of what? Why two different metals? They say that both films are 200 nm thick, so maybe it is:
   -----+------+------+-----
...  Sn | SnO2 | PbO2 | Pb  ...
   -----+------+------------
          100nm 100nm
A reconstruction of their circuit in Ciro's ASCII art circuit diagram notation TODO:
DC---R_10---X---GThere are not details of the physical construction of course. Reproducibility lol.
It is called "AC effect" because when we apply a DC voltage, it produces an alternating current on the device.
By looking at the Josephson equations, we see that a positive constant, then just increases linearly without bound.
Wikipedia mentions that this frequency is , so it is very very high, so we are not able to view individual points of the sine curve separately with our instruments.
Also it is likely not going to be very useful for many practical applications in this mode.
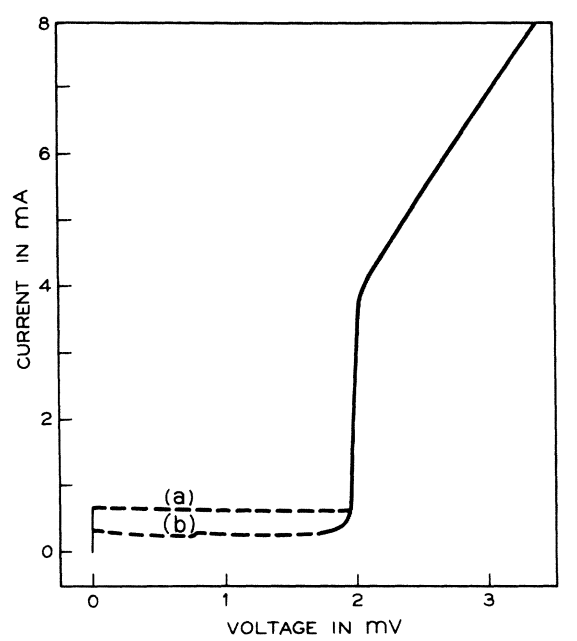
An I-V curve can also be seen at: Figure "Electron microscope image of a Josephson junction its I-V curve".
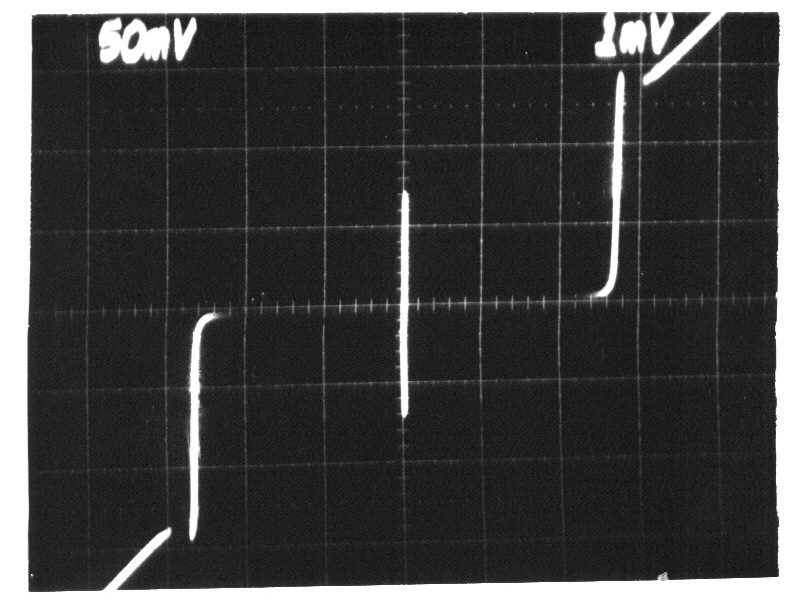
I-V curve of the AC Josephson effect
. Source. Voltage is horizontal, current vertical. The vertical bar in the middle is the effect of interest: the current is going up and down very quickly between , the Josephson current of the device. Because it is too quick for the oscilloscope, we just see a solid vertical bar.
Superconducting Transition of Josephson junction by Christina Wicker (2016)
Source. Amazing video that presumably shows the screen of a digital oscilloscope doing a voltage sweep as temperature is reduced and superconductivity is reached.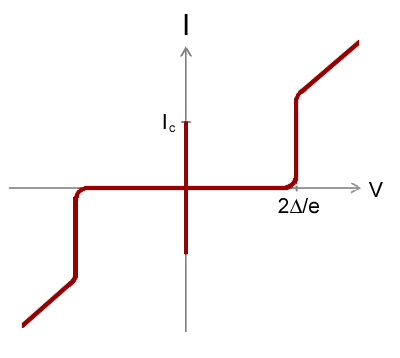
If you shine microwave radiation on a Josephson junction, it produces a fixed average voltage that depends only on the frequency of the microwave. TODO how is that done more precisely? How to you produce and inject microwaves into the thing?
The Wiki page gives the formula: en.wikipedia.org/wiki/Josephson_effect#The_inverse_AC_Josephson_effect You get several sinusoidal harmonics, so the output is not a perfect sine. But the infinite sum of the harmonics has a fixed average voltage value.
And en.wikipedia.org/wiki/Josephson_voltage_standard#Josephson_effect mentions that the effect is independent of the junction material, physical dimension or temperature.
All of the above, compounded with the fact that we are able to generate microwaves with extremely precise frequency with an atomic clock, makes this phenomenon perfect as a Volt standard, the Josephson voltage standard.
TODO understand how/why it works better.
Two equations derived from first principles by Brian Josephson that characterize the device, somewhat like an I-V curve:where:
- : Josephson current
- : the Josephson phase, a function defined by the second equation plus initial conditions
- : input voltage of the system
- : current across the junction, determined by the input voltage
Note how these equations are not a typical I-V curve, as they are not an instantaneous dependency between voltage and current: the history of the voltage matters! Or in other words, the system has an internal state, represented by the Josephson phase at a given point in time.
To understand them better, it is important to look at some important cases separately:
- AC Josephson effect: V is a fixed DC voltage
Maximum current that can flow across a Josephson junction, as can be directly seen from the Josephson equations.
Is a fixed characteristic value of the physical construction of the junction.
It represents an internal state of the junction.
A device that exhibits the Josephson effect.

TODO is there any relationship between this and the Josephson effect?
Experimental observation published as Experimental Evidence for Quantized Flux in Superconducting Cylinders.
This appears to happen to any superconducting loop, because the superconducting wave function has to be continuous.
Video "Superconducting Qubit by NTT SCL (2015)" suggests that anything in between gets cancelled out by a superposition of current in both directions.
Paywalled at: journals.aps.org/prl/abstract/10.1103/PhysRevLett.7.43
The paper that follows it in the journal is also of interest, "Theoretical Considerations Concerning Quantized Magnetic Flux In Superconducting Cylinders" by N. Byers and C. N. Yang, it starts:So there was some previous confusion about the flux quantum due to the presence of Cooper pairs or not.
In a recent experiment, the magnetic flux through a superconducting ring has been found to be quantized in units of ch/2e. Quantization in twice this unit has been briefly discussed by London' and by Onsager. ' Onsager' has also considered the possibility of quantization in units ch/2e due to pairs of electrons forming quasi-bosons.
Dumping the fitures at: archive.org/details/experimental-evidence-for-quantized-flux-in-superconducting-cylinders One day we can also dump the paper scans when it goes into the public domain in 2056! Public domain scientific paper by year.

(Upper) Trapped flux in cylinder No. 1 as a function of magnetic field in which the cylinder was cooled below the superconducting transition. temperature. The open circles are individual data points. The solid circles represent th, e average value of all data points at a particular value of applied field including all the points plotted and additional data which could not be plotted due to severe overlapping of points. Approximately two hundred data points are represented. The lines are drawn at multiples of hc/2e.(Lower) Net flux in cylinder No. 1 before turning off the applied field in which it was cooled as a function of the applied field. Open and solid circles have the same significance as above. The lower line is the diamagnetic calibration to which all runs have been normalized. The other lines are translated vertically by successive steps of hc/2e.

(Upper) Trapped flux in cylinder No. 2 as a function of magnetic field in which the cylinder was cooled below the superconducting transition temperature. The circles and triangles indicate points for oppositely directed applied fields. Lines are drawn at multiples of hc/2e.(Lower) Net flux in cylinder No. 2 before turning off the applied field as a function of the applied field. The circles and triangles are points for oppositely directed applied fields. The lower line is the diamagnetic calibration to which all runs have The other been normalized. lines are translated vertically by successive steps of hc/2e.
The inverse of the magnetic flux quantum.
As mentioned in True Genius: The Life and Science of John Bardeen page 224, the idea of symmetry breaking was a major motivation in Josephson's study of the Josephson effect.
- the basis for the most promising 2019 quantum computing implementation: superconducting quantum computer
- Josephson voltage standard: the most practical/precise Volt standard, which motivated the definition of the ampere in the 2019 redefinition of the SI base units
- SQUID devices, which are:
- very precise magnetometer
- the basis for superconducting quantum computers
The most practical/precise volt standard.
It motivated the definition of the ampere in the 2019 redefinition of the SI base units
The wiki page en.wikipedia.org/wiki/Josephson_voltage_standard contains amazing schematics of the device, apparently made by the US Government.

Schematic of a typical Josephson voltage standard chip
. Source. 
- youtu.be/VoRab8U2eS0?t=354 the desired output voltage is 10V
- youtu.be/VoRab8U2eS0?t=475 lists the three most commonly used 10V implementations currently:
- youtu.be/6pgGNJby1lw?t=296 gives the experimental setup used to compare two different references. Notably it involves a nanovoltmeter
Superconducting Quantum Interference Device by Felipe Contipelli (2019)
Source. Good intuiotionistic video. Some points deserved a bit more detail.Mishmash of SQUID interviews and talks by Bartek Glowaki
. Source. The videos come from: www.ascg.msm.cam.ac.uk/lectures/. Vintage.
One of the segments is by John Clarke.
An experimental lab video for COVID-19 lockdown. Thanks, COVID-19. Presented by a cute and awkward Adam Stewart.
Uses a SQUID device and control system made by STAR Cryoelectronics. We can see Mr. SQUID EB-03 written on the probe and control box, that is their educational product.
As mentioned on the Mr. SQUID specs, it is a high-temperature superconductor, so liquid nitrogen is used.
He then measures the I-V curve on an Agilent Technologies oscilloscope.
Unfortunately, the video doesn't explain very well what is happening behind the scenes, e.g. with a circuit diagram. That is the curse of university laboratory videos: some of them assume that students will have material from other internal sources.
- youtu.be/ql2Yo5LgU8M?t=211 shows the classic voltage oscillations, presumably on a magnetic field sweep, and then he puts a magnet next to the device from outside the Dewar
- youtu.be/ql2Yo5LgU8M?t=253 demonstrates the formation of Shapiro steps. Inserts a Rohde & Schwarz signal generator into the Dewar to vary the flux. The result is not amazing, but they are visible somewhat.
Two parallel Josephson junctions.
In Ciro's ASCII art circuit diagram notation:
  |
+-+-+
|   |
X   X
|   |
+-+-+
| Articles by others on the same topic
The Josephson effect is a quantum mechanical phenomenon observed in superconductors, where a supercurrent flows between two superconductors separated by a thin layer of insulator or a nonsuperconducting material, often referred to as a Josephson junction. This effect was first predicted by the physicist Brian D. Josephson in 1962 and has since become fundamental to various applications in superconducting electronics.