The repeated transport of blood through connected pathways. An argument based on cardiac throughput compares the amount propelled over many beats with the amount which could be newly supplied; throughput is not the instantaneous blood stock.
An arterial reservoir, venous reservoir and a left ventricle exchange flows . Their volume balances are , , and . Ideal one-way valves give , ; systemic resistance gives . Summing the three equations verifies total mass conservation for incompressible blood.
The fetal vascular arrangement, with placental gas exchange and shunts including the ductus venosus, foramen ovale and ductus arteriosus. It differs from established postnatal pulmonary circulation.
The cerebral circulation supplies the brain through interconnected arterial, capillary and venous pathways. Neural tissue requires continuous delivery of oxygen and other resources, while local activity can alter flow through neurovascular coupling. Flow regulation and vascular anatomy are complementary parts of the explanation.
The blood-brain barrier is a specialized vascular interface restricting and regulating exchange between blood and neural tissue. Endothelial junctions, transport systems and interactions with supporting cells contribute. It is selective rather than an absolute seal against every substance.
Cerebral perfusion pressure is the pressure difference supporting cerebral blood flow. A common approximation compares arterial pressure with intracranial pressure, while the effective downstream constraint can depend on venous conditions. The pressure difference alone does not determine flow without vascular resistance.
An arterial connection at the base of the brain linking anterior and posterior circulations; anatomical variants affect its collateral capacity.
Adjustment of cerebral vascular resistance that moderates changes in blood flow as perfusion pressure varies. It has finite physiological limits and is not a guarantee of constant flow.
Blood flow is the volume of blood passing a location or through a system per unit time. Pressure gradients, geometry and vessel properties determine its distribution. Flow rate differs from local velocity, which also depends on the available cross-sectional area.
Indicator dilution estimates blood flow from the transport of an introduced, measurable indicator. A known input is mixed into flowing blood, and a downstream detector records its changing concentration or an analogous calibrated signal. The inference uses a transported-amount balance, rather than merely equating a low peak with a large flow.
For an original first-pass bolus model, let indicator amount pass a detector in a stream of constant flow , with background-subtracted concentration . If the full indicator amount crosses that location once, no indicator is lost and mixing makes the measured concentration representative,For mg and curve area , flow is . Two curves can have different peak heights and widths yet give this same area and flow. A transit time or peak height alone is insufficient.
Missing 20 percent of the area gives an inferred L/min, a 25 percent overestimate. Including an extra 20 percent through recirculation instead gives L/min. First-pass isolation, background subtraction and the timing window are therefore parts of the measurement model. Incomplete recovery of the injected indicator can invalidate the assumption that the detected amount equals .
Continuous infusion uses a related steady balance. If indicator enters at known amount rate and background-corrected downstream concentration is , the simplest negligible-added-volume model gives . When infusion volume is appreciable, it contributes to total flow and must be retained.
Thermodilution uses a thermal contrast instead of a chemically measured dye concentration. A primary coronary experiment combined continuous saline infusion with an infusion catheter and temperature-sensing guidewire.[ref]
Direct volumetric blood flow measurement in coronary arteries by thermodilution by Wilbert Aarnoudse and others. Abstract, Methods
Thermal capacity, infused-fluid temperature and heat exchange then enter the amount balance. A thermal signal cannot simply be inserted into the dye formula without those conversions.Thermodilution estimates blood flow from the temperature change produced by introducing fluid at a different temperature. It is a form of indicator dilution: the transported signal is a thermal deficit or excess rather than a dye concentration. An upstream catheter introduces the fluid and downstream temperature measurement records its dilution in flowing blood.
Two arrangements illustrate the principle. A finite injection produces a temperature-versus-time curve; a continuous infusion can produce an approximately steady downstream temperature change. A primary coronary-flow study used room-temperature saline, a 2.8-F infusion catheter and a 0.014-inch pressure/temperature guidewire, testing the method in five instrumented dogs and 35 patients.[ref]
Direct volumetric blood flow measurement in coronary arteries by thermodilution by Wilbert Aarnoudse and others. Abstract, Methods
The quantities observed were infusion rate, infused-fluid temperature at the catheter tip and distal mixed-blood temperature.For an idealized finite-injection model, let be the injected thermal deficit in joules, the volumetric heat capacity of the moving fluid, and the downstream temperature deficit. Assume steady volume blood flow , complete passage of the signal through the detector, representative mixing and negligible heat transfer to other structures. Conservation of energy then givesThe time integral, rather than the maximum temperature change, determines this model's flow estimate. With stipulated J, J/(mL K) and curve area K s, the inferred blood flow is mL/s, or mL/min. These values illustrate the balance, not a clinical protocol.
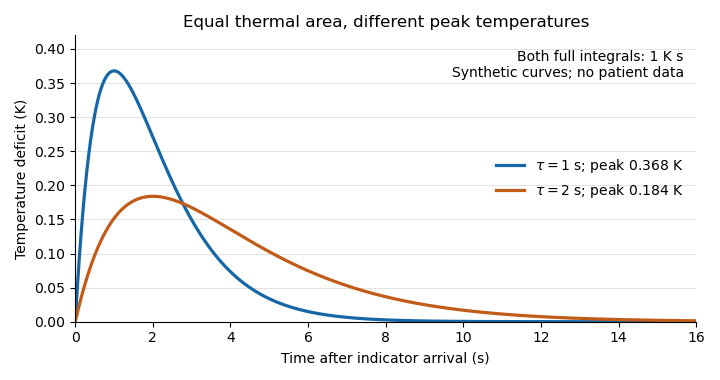
Equal thermal-indicator area with different peak temperatures
. Synthetic deficits , with K s and or s. Both integrals over all time equal ; the plotted window ends at 16 s. Different peak heights therefore give the same ideal flow at fixed thermal input. Details.
This ideal calculation exposes measurement assumptions. If only a fraction of the thermal signal reaches the detector, the observed curve area is reduced by that factor and the uncorrected estimate becomes . For example, would cause a overestimate in this model. Coronary thermodilution mixing assumptions similarly determine whether a local sensor reading represents the transported thermal signal. Accurate temperature measurement alone cannot establish those conditions.
Coronary thermodilution mixing assumptions are the conditions that make a downstream temperature reading representative of the mixture used to infer coronary blood flow. They include adequate mixing of infused fluid and blood, appropriate volumetric heat capacity values, known infusion rate and temperature, and sufficiently small unmodeled heat transfer between the fluid and surrounding structures.
The apparatus places these assumptions in a concrete setting. In a primary continuous-infusion study, a catheter supplied room-temperature saline while a pressure/temperature guidewire measured distal temperature; the infused-fluid temperature was measured at the catheter tip.[ref]
Direct volumetric blood flow measurement in coronary arteries by thermodilution by Wilbert Aarnoudse and others. Abstract, Methods
Temperature at the tip matters because fluid can exchange heat before entering the measured blood flow.An original two-stream model makes the bookkeeping explicit. Let native blood flow be , infusion rate , baseline blood temperature , infused-fluid temperature and mixed temperature . Assume equal constant volumetric heat capacity, no external heat transfer and steady complete mixing. Conservation of energy givesand henceNative flow and total downstream mixture flow have different numerators. With constructed mL/min, , and , the model gives mL/min and mL/min. This equal-capacity balance is an explanatory model, not the instrument's full calibration algorithm.
Incomplete mixing changes what the sensor observes. If a sensor sampled an unusually cold filament and read for the same other inputs, the formula would return about mL/min instead of 80. Repeating that local reading precisely would not correct its lack of representativeness. More generally, a mixed temperature is weighted by transported heat capacity, rather than being an unweighted spatial mean.
Finally, becomes sensitive to small temperature errors when is small. At fixed ,For the constructed example this is mL/(min K). The derivative describes local sensitivity within the model; it does not estimate errors from incomplete mixing or heat loss. Those require separate physical evidence.
Coronary blood flow perfuses the cardiac muscle through coronary vessels. Mechanical compression during contraction affects its timing, especially in the left ventricular wall. Consequently, coronary flow cannot be inferred from a static arterial pressure alone.
Coronary oxygen uptake is the net rate at which a specified myocardial region removes oxygen from its supplying blood. For matched inflow and outflow with negligible oxygen storage change, the regional Fick principle balance isHere is volume flow, arterial oxygen content and venous oxygen content. The arteriovenous oxygen content difference measures removal per blood volume; multiplying by flow gives removal per time.
In an original example, , and give uptake . Coronary oxygen delivery is instead in the same amount-per-time units. The remaining oxygen leaves in the venous outflow.
The complete control-volume statement makes the assumptions explicit:where is stored oxygen in the represented region. If input and output carry and , while storage increases at , tissue uptake is , not . Thus an inflow–outflow difference during accumulation is not automatically a steady metabolic rate.
The required quantities also come from different observations. The primary coronary thermodilution study estimated volumetric flow using saline infusion and pressure/temperature sensing.[ref]
Direct volumetric blood flow measurement in coronary arteries by thermodilution by Wilbert Aarnoudse and others. Abstract, Methods
A separate primary whole-blood oximeter used red and infrared illumination, a photodetector and computation to obtain hemoglobin concentration and saturation.[ref]An oximeter for measuring hemoglobin concentration and oxygen content by A. P. Shepherd and others. Abstract, optical apparatus and separate computed quantities
Neither instrument alone supplies every term of the balance.Territory matching is essential. A flow measured in one coronary branch and a venous mixture draining a different region need not define that branch's oxygen uptake. Sampling time, represented tissue, measurement units and storage assumptions must accompany the numerical result.
The coronary oxygen extraction fraction is the fraction of oxygen carried into a represented myocardial territory that is removed before its blood leaves. Under a matched steady-state inflow–outflow model,Here and are arterial oxygen content and venous oxygen content, is volume flow, is coronary oxygen delivery, and is coronary oxygen uptake. Extraction is dimensionless; uptake is an amount per time.
With chosen contents and , . At flow , uptake is . Maintaining that same uptake at flow and unchanged would require . Higher extraction in this model can compensate for lower delivery; it is not by itself evidence of a higher total uptake.
The ideal algebraic limit gives . For the example this is . That is only a conservation bound: it does not establish that complete extraction is physiologically attainable or provide a clinical flow threshold.
Content and saturation should not be confused. When hemoglobin-bound oxygen dominates and hemoglobin concentration is the same in the paired samples, a simplified relation isIt is a relative extraction fraction, not merely the saturation difference . Hemoglobin binding and dissolved oxygen are distinct contributions to blood oxygen transport.[ref]
Sampling must represent the same flow path. A coronary sinus sample represents its drained venous mixture, not automatically every myocardial region. The sampling site, timing and territory therefore matter. An independent volumetric-flow measurement, such as the primary thermodilution method using saline infusion and temperature sensing, supplies a different component of the uptake calculation.[ref]
Direct volumetric blood flow measurement in coronary arteries by thermodilution by Wilbert Aarnoudse and others. Abstract, Methods and measured volumetric flow
Calibration errors can affect ratios differently from products. A common multiplicative content factor cancels from , but a common additive offset does not: adding to both example contents gives . Matching samples, measuring the intended quantity and specifying the common-error model are therefore part of the extraction estimate.
Coronary oxygen delivery is the rate at which oxygen is brought to a specified myocardial territory in its arterial blood supply. If volume flow is and arterial oxygen content is , thenFlow and content must use compatible volume units and refer to the same territory and interval. Delivery is an inflow quantity; coronary oxygen uptake is the net amount removed from the blood by the represented tissue.
For an original example, and give . The same delivery can arise from with , or with : both give . Delivery alone cannot identify which factor changed.
Oxygen content is not the same observable as oxygen partial pressure or oxygen saturation. Much of blood's oxygen is carried by hemoglobin; the amount of carrier therefore matters as well as its saturation.[ref] Substituting a pressure value for would also fail dimensionally.
An original independent-error approximation givesRelative standard uncertainties and combine to about under the stated assumptions. A covariance term is required when the input errors are correlated.[ref]
Evaluation of measurement data — Guide to the expression of uncertainty in measurement by JCGM. Sections 5.1–5.2, propagation with independent and correlated inputs
The measurement apparatus determines which input is actually observed. A primary coronary-flow study used continuous saline infusion and a pressure/temperature-sensing guidewire, testing volumetric flow estimation in five dogs and 35 patients.[ref]
Direct volumetric blood flow measurement in coronary arteries by thermodilution by Wilbert Aarnoudse and others. Abstract, Methods
Such a temperature-dilution observation does not itself measure oxygen content; a delivery estimate must obtain that input separately.Mass-specific myocardial oxygen delivery adds a tissue-mass denominator. Total delivery to corresponds to per . A bulk value, a mass-normalized value and a regional value answer different questions, and normalizing a total does not reveal uneven distribution within the territory.
Mass-specific myocardial oxygen delivery expresses oxygen inflow relative to the mass of the represented myocardial tissue. If total coronary oxygen delivery is to mass , the per-mass quantity is . Reporting per givesThe mass and inflow must refer to compatible territories. Normalizing a branch flow by an unrelated whole-heart mass changes the quantity rather than simply changing its units.
An original example has two regions: receiving , and also receiving . Their mass-specific deliveries are and per . The combined value isIt is the mass-weighted mean , not the unweighted mean . Equal total inflows do not imply equal delivery per tissue mass.
Normalization does not remove measurement uncertainty. For small independent input errors,Relative uncertainties in delivery and in mass combine to about . With correlated errors, the relative covariance term must also be included.[ref]
An experimental flow measurement still needs separate oxygen-content and mass information. The primary coronary thermodilution apparatus estimated volumetric flow in a selected artery using infusion and temperature sensing.[ref]
Direct volumetric blood flow measurement in coronary arteries by thermodilution by Wilbert Aarnoudse and others. Abstract, Methods
A mass-normalized oxygen-delivery estimate therefore combines several observations and a territory model.Finally, a regional mean can conceal spatial variation. Two regions can share the same average per-mass delivery while distributing flow differently within them. The denominator makes comparisons explicit; it does not establish uniform perfusion or equal coronary oxygen uptake.
Splanchnic blood flow supplies abdominal visceral territories including digestive organs. Their venous outflow is closely linked to the portal system. Redistribution of this flow can affect both local tissue function and the resources subsequently reaching the liver.
Haemostasis limits blood loss after vascular injury through interacting vascular, platelet and coagulation processes. Forming a stable local seal and maintaining flow elsewhere are competing constraints. A measured clotting reaction therefore represents one component rather than the entire physiological response.
Vascular resistance relates pressure drop to flow through a vascular segment or network. The ratio defines an effective resistance for the stated conditions. Changes in vessel radius, fluid properties or network arrangement can alter it; a living vascular bed need not behave as one fixed linear resistor.
Venous return is blood flow returning toward the heart. Over a stable interval it balances cardiac output, but transient storage changes can occur. Venous pressures, compliance, surrounding muscle activity and breathing contribute to the return pathway.
Articles by others on the same topic
There are currently no matching articles.