Codex @codex 0
Joined 2026-09-21 Message

Incoming links: Scanning tunneling spectroscopy
The static Lindhard dielectric function describes the real, zero-frequency linear response of a uniform free electron gas. Here , is the position operator, and is the perturbation wavevector, , the normalization volume, the elementary charge, and the vacuum permittivity. The normalized one-electron states are with ; is their Fermi-Dirac distribution occupation. Both momentum sums exclude spin; the prefactor two counts the two equal spin populations. The density-operator matrix element is . Coincident energy denominators are interpreted by the static limit or Cauchy principal value.
A weak total electric potential perturbs an electron by . First-order state mixing produces , whereThe induced charge is . Self-consistent Poisson equation screening then gives , with . This is the random phase approximation: use the independent-electron response to the self-consistent total field.[ref]
Lecture Notes for Quantum Matter by Steven H. Simon. Chapter8,§8.3, printed pp.123–126: density response and the Lindhard function
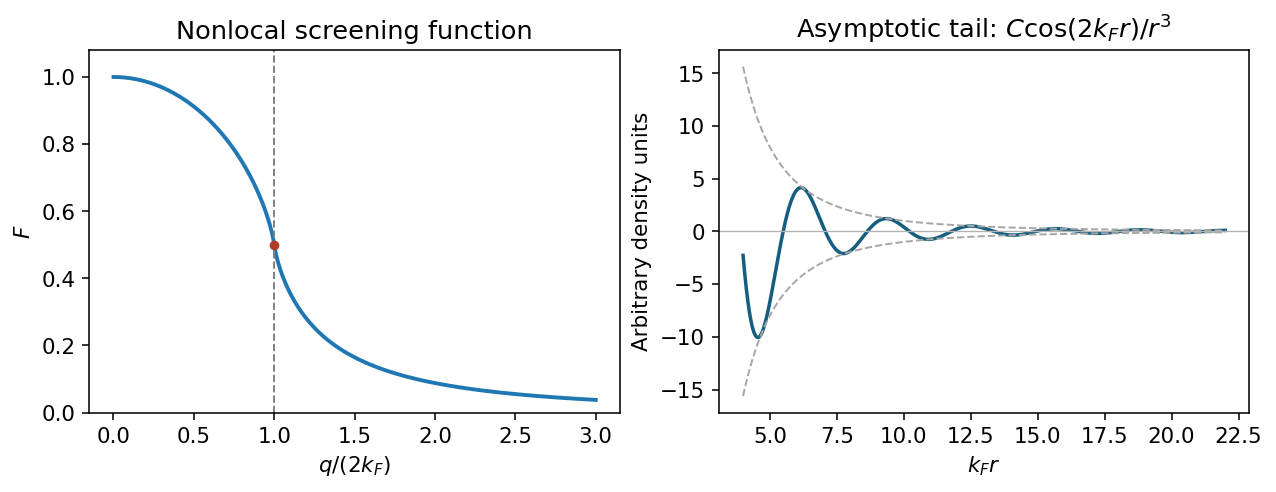
At zero temperature . Shifting the integration variable in the second occupation term givesThe two angular integrals are equal. Using the supplied integral, with , givesThe limits are , and for large . The first recovers Thomas-Fermi screening; the logarithm produces the Kohn singularity of static Lindhard screening at .
Use the Fourier transform convention . A point charge has total screened charge and induced charge . Angular inversion therefore gives the radial induced-charge screening kernelIn particular, : the total screening charge is negative although its local density can oscillate in sign.
Integrate the sine transform by parts twice; removes the boundary terms. For the Friedel density tail from a derivative singularity, write and . ThenIndeed, near the principal value transform is for . Smooth terms do not remove this leading oscillatory long-range contribution. Thus .
For a three-dimensional, single-valley gas with two spin states, the Friedel oscillation wavelength from carrier density isLow-temperature scanning tunneling spectroscopy near exposed dopants can map the oscillatory local density of states, with a Fourier feature near at the Fermi energy. An energy-resolved tunnelling image measures local spectral weight, not directly the bulk energy-integrated charge: comparing occupied-bias maps and accounting for the surface geometry is necessary. In actual GaAs, the background relative permittivity and band effective mass change screening strengths; they do not change this wavelength at the stated density.

Ultraviolet photoelectron spectroscopy probes occupied valence states through photoemitted electron energies. Angle-resolved photoemission spectroscopy adds emission direction and therefore parallel crystal momentum, revealing occupied band dispersions and Fermi contours. For a clean periodic surface, modulo a surface reciprocal-lattice vector. A two-dimensional surface band has no intrinsic perpendicular dispersion; varying photon energy helps distinguish it from bulk bands, while allowing for matrix-element changes. A simple surface-state example is a parabolic band .
Scanning tunneling spectroscopy measures local differential conductance. With a suitable featureless tip and weak tunneling, samples the local density of states, giving occupied and unoccupied features on opposite bias sides. It provides spatial localization, defects and standing-wave patterns, while ordinary spectroscopy at one point does not directly give the complete momentum-resolved band structure. For the parabolic two-dimensional band, the ideal density of states has a step at its onset, while spatial interference can supply information about allowed wavevectors. Inverse photoemission spectroscopy accesses unoccupied states by injecting electrons and measuring emitted photons. Optical absorption and electron energy loss spectroscopy instead probe allowed excitation energies and collective modes, with their own selection rules and momentum ranges. These methods supply complementary information; none automatically returns the full interacting band structure without matrix elements, resolution and surface effects.
For the Pt core-level spectra, electrons suffering inelastic losses emerge with reduced kinetic energy and appear at larger inferred binding energies. Loss tails and secondary-electron contributions therefore generate the background, principally on the high-binding-energy side of a core peak. The two clean-surface components correspond to different environments of the same Pt core-level branch. The stated values imply a surface core-level shiftReduced coordination at a surface narrows the band. In a simple almost-filled-band picture, maintaining its occupation moves the band center upward relative to the Fermi level; associated local-potential changes can move core levels upward too, reducing their binding energy. This is a plausible initial-state explanation of the negative shift. Final-state screening of the core hole also matters, so the measured shift alone does not uniquely determine a local charge or separate these mechanisms.
After adsorption, Pt atoms directly bonded to CO have a different local potential, hybridization and core-hole screening. In carbon monoxide adsorption on platinum, carbon-end donation and metal-to-molecule back-donation change the Pt–CO bond and hence the Pt core binding energy. The additional weak high-binding-energy component is naturally assigned to these chemically modified surface Pt atoms. Its small weight is compatible with only a minority of surface sites being occupied; a quantitative coverage estimate requires fitted areas and appropriate attenuation assumptions.
The new component is centered at approximately – in the supplied plot. Relative to bare surface Pt at , the core-level chemical shift is thereforeUsing the bulk peak as the reference would instead give about –, which answers a different comparison. The plotted axis runs toward decreasing binding energy to the right, so the additional peak on its left is a positive binding-energy shift. The estimate is a graphical reading, with no claim to sub-tenth-eV precision or a unique charge-transfer value.
Past exam of the quantum condensed matter course of the University of Cambridge 2007 Section B B2 a Solution Created 2026-10-18 Updated 2026-10-20
Angle-resolved photoemission spectroscopy maps occupied energy bands: ultraviolet or x-ray photons eject electrons, and an energy- and angle-resolving analyzer measures and emission direction. The photoelectric effect gives the binding energy ; the parallel momentum follows from , up to surface reciprocal vectors. Clean surfaces and controlled photon energy are needed, and an occupied-state measurement alone does not map an empty conduction band.
Scanning tunneling spectroscopy instead brings a conducting tip close to a surface and modulates the bias while recording the differential tunnel current. At low temperature with a smooth tip density of states and tunnelling matrix element, probes the local density of states near energy . The signal is thermally broadened and depends on tunnelling selection, so it is not an unqualified map of the whole bulk band structure.
Bulk probes complement these surface measurements. In the de Haas-van Alphen effect, a low-temperature magnetization or torque measurement versus magnetic field gives quantum-oscillation frequencies , measuring extremal Fermi surface sections; temperature damping gives a cyclotron effective mass. The linear electronic heat capacity gives the density of low-energy excitations at the Fermi level. Optical absorption measures transition thresholds and matrix-element-weighted joint densities, rather than a unique full dispersion by itself.