
An initially localized escaping electron occupies a superposition of lead momentum states. In a uniform free one-dimensional lead,A packet centered at moves with group velocity and generally spreads because its components have different velocities. For an initially unchirped minimum-uncertainty Gaussian wave packet,This illustrates dispersive evolution; the actual emission contact determines and whether only outward-propagating components are appreciable. It does not instantaneously become a single lead plane wave.
A single-electron transistor used as a sensitive electrometer exploits Coulomb blockade: a nearby charge shifts the offset and therefore the conductance peaks. This requires stable calibrated capacitances and low charge noise, rather than merely a small conductor.
A larger source–drain bias opens an energy window between reservoir electrochemical potentials. When a charge-addition/removal transition enters that window, sequential tunnelling becomes allowed even away from a zero-bias degeneracy. The low-conductance regions in a gate/bias map are Coulomb diamonds.
For an illustrative symmetric device with reservoir potentials , let and . In the charge- interval, the classical blockade domain isIt shrinks to zero at . Unequal capacitances change edge slopes and voltage division; the figure's symmetry is a chosen model, not a universal device property.
Quantum confinement adds discrete single-particle levels and spin structure. In a constant-interaction approximation, successive addition energies contain plus the relevant orbital spacing, so diamond sizes need not all match. Excited-state tunnelling can produce extra conductance lines. At stronger coupling, cotunnelling and charge fluctuations can give leakage beyond a simple sequential classical model. Thus temperature and coupling must be small enough to resolve the charging and level structure separately.
Let be the island's total electrostatic capacitance and the charge offset induced by gates, reservoir potentials and fixed background charges. In the constant-capacitance model,Taking the difference givesChanging gate voltage changes approximately linearly, for example through .
For fixed , is a parabola. At small temperature/bias, the preferred integer is the one nearest ; the equilibrium energy follows the lower envelope of these parabolas. Adjacent charge states become degenerate at , allowing small-bias sequential current when the two barriers are transmissive.
The excess-electron charge is a staircase. If “net charge” includes the induced compensating charge, define ; that residual charge is a sawtooth between and in equilibrium. The opposite sign convention reverses the sawtooth. State the charge convention: an integer electron-charge staircase and a residual electrostatic-charge sawtooth describe different quantities.
A common implementation uses a gallium arsenide/aluminium gallium arsenide heterostructure with a two-dimensional electron gas near the interface. electrons supplied by remote donors occupy quantized normal-direction states, while an undoped spacer reduces ionized-impurity scattering. Surface metallic gates, insulated from the conducting layer, deplete selected regions when negatively biased.
Leave a small conducting island bounded by depleted regions and connect it weakly to source and drain reservoirs through two tunable constrictions. A plunger gate controls the island potential/population; barrier gates control tunnel coupling. Ohmic contacts connect the reservoirs to the measurement circuit. Vertical heterostructure confinement plus lateral depletion force defines the dot. A 2DEG without lateral gates would remain extended in its plane.
The original device diagram labels the gates, island, tunnel barriers and reservoirs. Charge stability and spectroscopy versus gate/bias should verify that an isolated weakly coupled island has actually formed; a lithographic outline alone is insufficient.
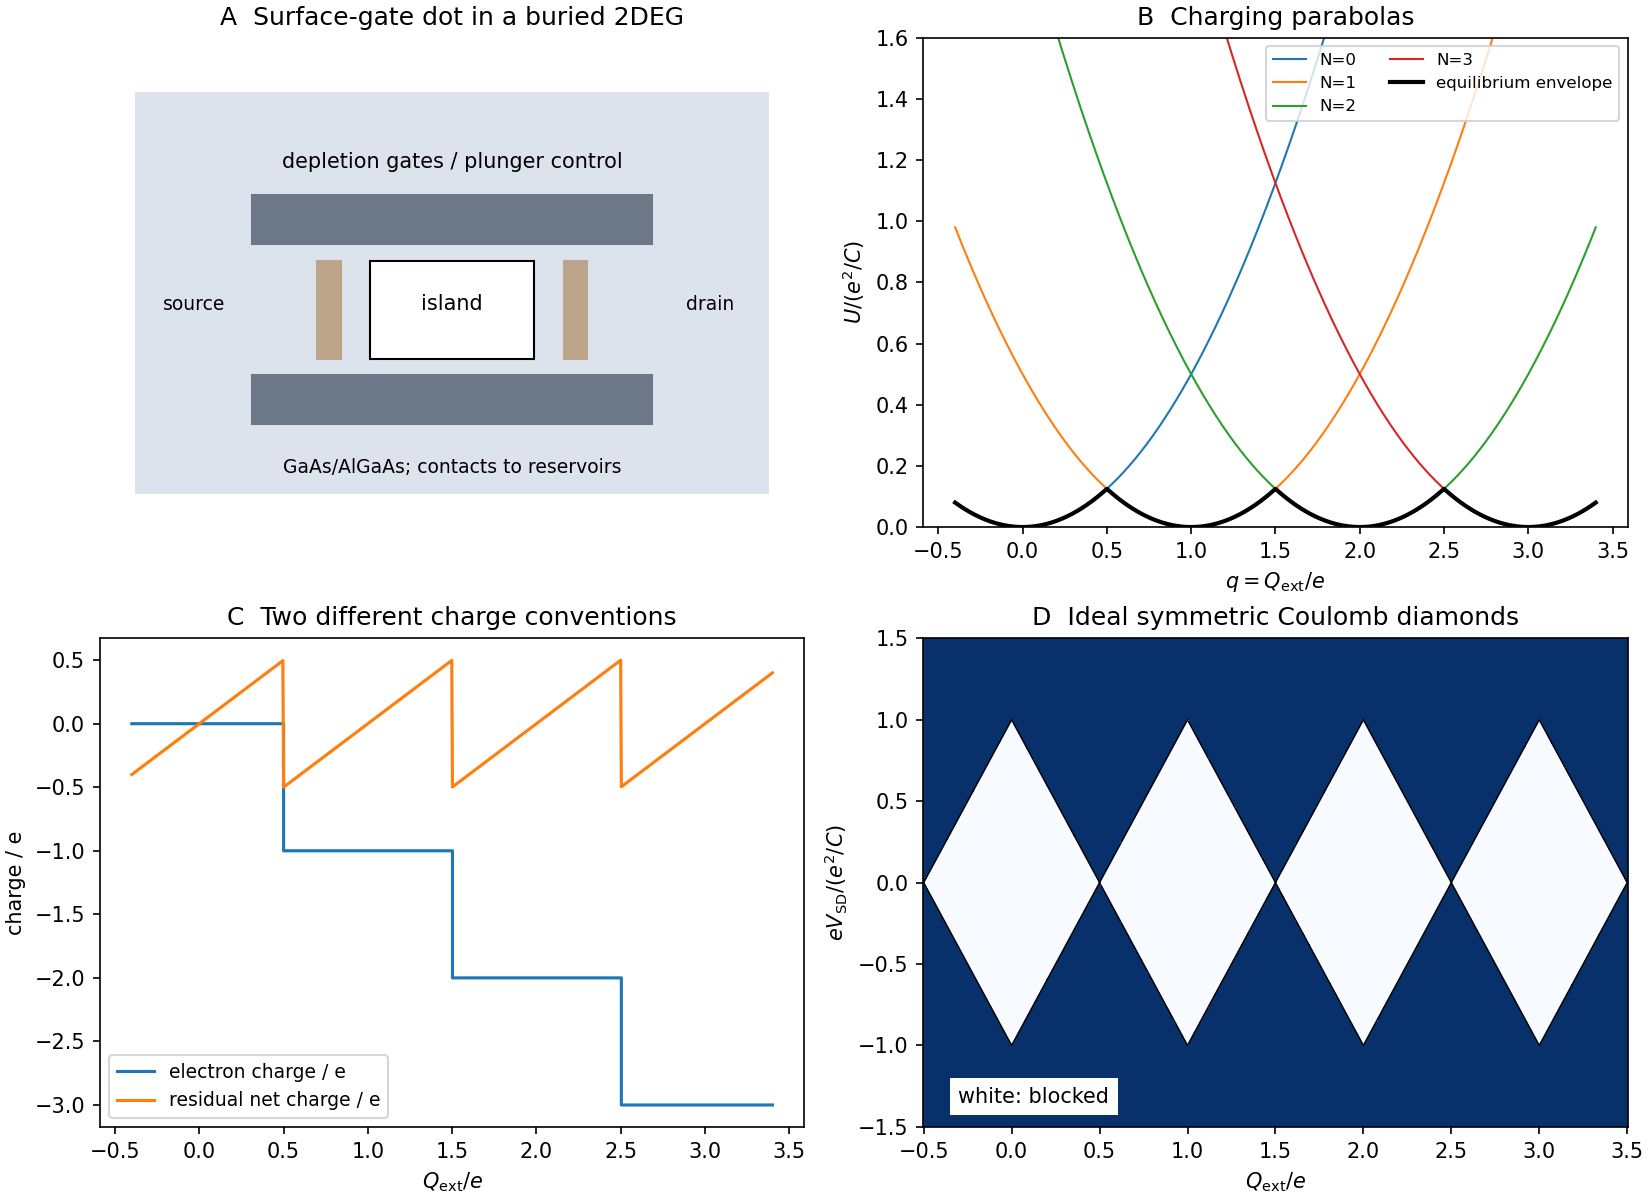
Gate-defined dot, charging parabolas, charge steps and Coulomb diamonds
. Original schematic and constant-capacitance model plots. The conductance map is an idealized symmetric-bias cartoon, not experimental data or a microscopic tunnelling calculation. Details.
One possible cause is a different indium gallium nitride thickness or indium content that shifts this wire's emission away from 420 nm. The detected intensity at one wavelength then falls even if its integrated radiative efficiency is unchanged. Since , composition, strain, confinement and internal fields can all move the transition relative to that detection energy.
A second physically different possibility is poor active-layer quality: roughness, composition segregation or strain relaxation can introduce defects and nonradiative recombination. Locally thinner or discontinuous shell regions may also permit carrier leakage.
Measure the full spectrum and integrated emission, rather than one spectral channel. Time-resolved luminescence, excitation-dependent measurements and local structural/compositional characterization can distinguish a spectral shift, changed carrier injection and an increased nonradiative rate. The single-wavelength observation alone does not uniquely identify lower internal quantum efficiency or one growth defect.
Two suitable epitaxial techniques are metalorganic vapour-phase epitaxy and molecular beam epitaxy.
MOVPE supplies metalorganic group-III precursors and a reactive nitrogen source in a flowing gas. Surface reactions, mass transport and selective nucleation control growth; it is well suited to conformal radial growth and relatively high throughput. molecular beam epitaxy supplies molecular/atomic beams in high vacuum, with beam fluxes and shutters controlling delivery. It offers precise flux switching and in-situ surface monitoring, but flux, geometry and nitrogen activation can limit growth rate and conformality. Neither method automatically gives identical growth on all wire crystal facets.
For an overall target near , MOVPE is a natural choice. This is a practical selection, not a theorem that molecular beam epitaxy cannot attain that rate.
Prepare the substrate/buffer and patterned SiN growth mask; grow donor-doped gallium nitride cores with controlled axial morphology; change conditions to favor radial deposition and incorporate indium for the thin indium gallium nitride active shell; then overgrow acceptor-doped p-GaN without degrading the active layer. Finally expose/contact the core and shell appropriately. Monitor facet-dependent thickness and indium content, and characterize the interfaces. If the active-layer normal rate itself were , 5 nm would take 7.5 s; the stated overall rate does not establish that the alloy shell actually grows at that same rate.
Across a radial section, the narrow-gap indium gallium nitride layer lies between wider-gap n-GaN and p-GaN. A suitable type-I band alignment has a downward conduction-band offset and upward valence-band offset in the indium gallium nitride, confining electrons and holes to the active layer. The original band sketch isolates those offsets; the complete junction also has doping-induced band bending.
At thermal equilibrium the Fermi level is common throughout. Forward bias separates the electron and hole quasi-Fermi levels, injects carriers from the n- and p-regions and permits electron-hole recombination in the thin active layer. A full radial line through the wire crosses two copies of the shell well; a core-to-exterior radial coordinate crosses one.
The 5 nm indium gallium nitride shell is the quantum well active region, not a metallic contact. Finite band offsets, confinement and polarization fields affect its transition energy; the bulk gap alone is insufficient.
A plausible role for the SiN mask is selective-area growth: restrict nucleation to exposed windows and suppress parasitic deposition between wires. Retained insulating material can also help prevent unwanted electrical paths during later processing. Which role dominates depends on the actual fabrication sequence. The cited source concerns core-shell single-wire LEDs and contact engineering, so a qualitative band sketch does not reproduce its complete device model.[ref]
InGaN/GaN Core-Shell Single Nanowire Light Emitting Diodes with Graphene-Based P-Contact by Maria Tchernycheva and others. 2014, pp.2456–2465, device/material system and contact architecture
For a no-slip spherical tracer of radius in an isotropic incompressible elastic continuum, a small translation produces restoring force . ThusCombining this with the equilibrium three-dimensional positional variance givesEquivalently, if is the stationary three-dimensional displacement-MSD plateau, . For a single measured coordinate, and .
This is passive microrheology. Calibrate bead radius, position sensitivity, temperature and localization noise; subtract drift and test that a plateau is resolved. The continuum must be meaningful on the bead scale, the bead must couple without slip, and thermal equilibrium must hold. Boundaries, compressibility, active motion, probe attachment and unresolved relaxation can change the inferred response. An imposed optical trap adds stiffness and must be removed or independently calibrated rather than mistaken for material elasticity.
Interpret the given noise correlation as the three-dimensional dot-product correlation. Each Cartesian component then has . For the usual Gaussian thermal-noise idealization, each coordinate is an Ornstein-Uhlenbeck process. With ,For a particle initially at ,Hence its long-time displacement about the trap/elastic equilibrium hasThis also follows from equipartition theorem: each of three quadratic coordinates contributes .
A different common experimental quantity is the stationary time-lag displacement. It obeyswith long-lag RMS . The factor of two distinguishes fluctuations about a mean position from differences between two decorrelated positions. The observation convention must be stated rather than silently interchanged.
For large positive dimensionless surface potential , use the nonlinear Boltzmann distribution rather than their linear expansion:The counterions become strongly enriched near the wall and co-ions strongly depleted. A planar mean-field solution isIt approaches the linear screening form far from the wall. Nonlinearity preserves positive densities and produces a much stronger near-wall asymmetry; an extrapolated linear co-ion profile could incorrectly become negative. The total local ion density is , no longer constant.
The original figure compares weak- and strong-potential profiles. At very large local concentrations, finite ion size, specific adsorption and ion correlations limit this ideal point-ion mean-field model; it does not predict unlimited physically realizable counterion packing.
Take a positive surface potential , so positive ions are co-ions and negative ions counterions. With ,The counterion density is slightly enhanced at the surface, the co-ion density slightly depleted, and both approach over a Debye length. To first order their sum is , while their difference supplies the screening charge. Reverse the surface sign and the ionic roles interchange. These are number-density profiles, not trajectories of individual ions.
The dimensionally meaningful small-potential condition is , not a comparison of volts directly with energy. Expanding gives the physical linearized equationFor a single plane with bulk boundary condition , . At fixed temperature and permittivity, : the curve decreases with increasing density, diverging in the ideal zero-salt limit.
Literal expansion of the printed minus-sign equation instead gives , with sine/cosine solutions. A nonzero such solution cannot decay to zero at infinity. That literal equation does not describe a Debye length. The figure and following ion profiles use the physically derived plus-sign equation, with this correction explicit.
Let be the electrostatic potential in volts, relative to the bulk value, and the distance normal to the surface. The positive quantity is the elementary charge; the monovalent ions carry . The bulk number density refers to each ionic species in a symmetric electrolyte, so the total bulk ion density is . is vacuum permittivity, relative permittivity, the Boltzmann constant and absolute temperature. The hyperbolic sine acts on the dimensionless potential .
The printed sign is inconsistent with physical Poisson–Boltzmann screening under these usual definitions. Indeed,and Poisson's equation gives , with a plus sign. The literal printed equation and the physical screened solution must therefore be distinguished.
There are unlisted articles, also show them or only show them.