
Risk function Created 2026-09-24 Updated 2026-10-14
Bootstrapping (statistics) Created 2026-09-24 Updated 2026-10-18
The bootstrap approximates a sampling distribution by repeatedly sampling with replacement from the empirical measure of the observed data. In the ordinary nonparametric version, observations are assumed independent and identically distributed; a bootstrap sample has the same size as the original statistical sample. A statistic, such as a sample mean or sample median, is recomputed on each resample. Its variation across resamples estimates how the original statistic would vary across repeated sampling from the unknown probability distribution.[ref]
Lecture 12: The Bootstrap. UW STAT 535: Statistical Machine Learning, Autumn 2026; The Bootstrap, resampling procedure; High level idea of how bootstrap works, conditional empirical sampling law
The key distinction is between the observed statistical sample and its still-unknown source probability distribution. Condition on the observed values and form the empirical measureHere is a Dirac measure. Draw independent indices from the uniform distribution on a finite set and set . Each observed slot has probability on every draw. If equal values occupy several slots, their total probability is the sum of those slot probabilities; distinct observed values need not be equally likely. A star denotes this conditional resampling experiment. There are equally likely ordered index sequences, although bootstrap count vectors and statistics can combine many such sequences.
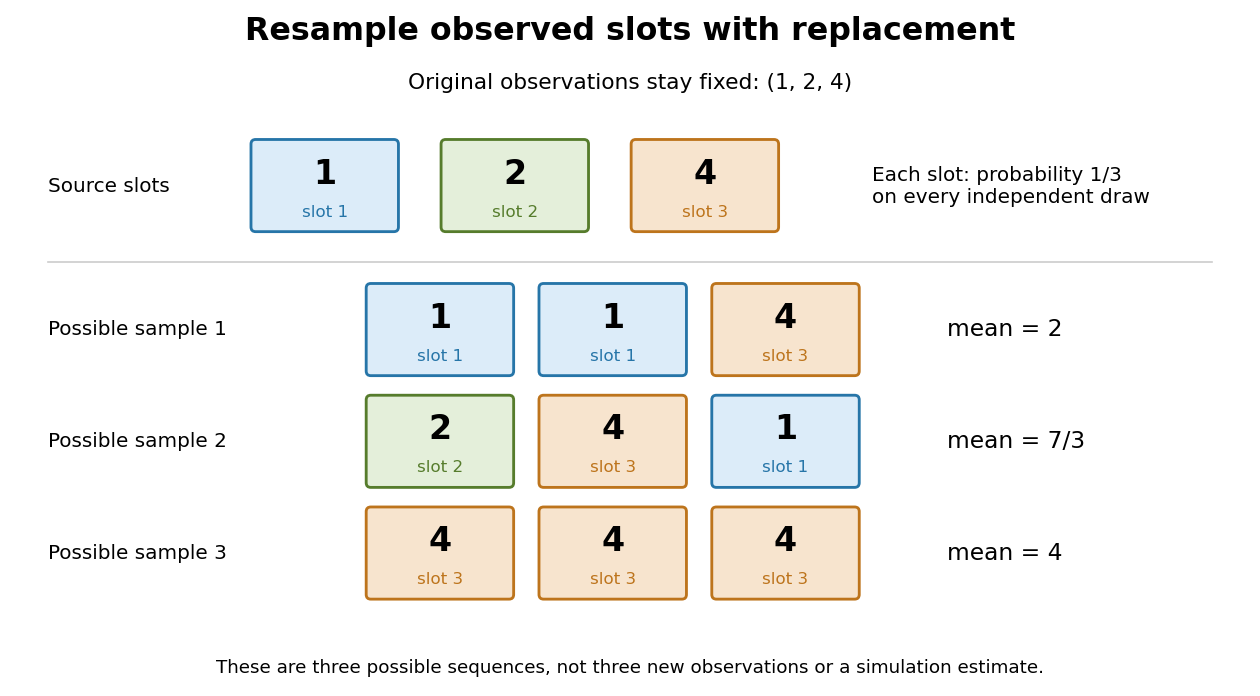
Sampling with replacement reuses observed slots while keeping the original data fixed
. Original schematic for observations . Three possible ordered bootstrap samples have different sample means. Their colors identify source slots; none of these samples is new evidence about the unknown probability distribution. Details.A complicated sampling distribution need not stop statistical inference when recomputing the statistic is easy. The bootstrap reuses that calculation on simulated datasets. The plug-in estimator principle replaces the unknown probability measure by in the whole repeated-sampling experiment. Whether that substitution approximates the target sampling distribution needs an appropriate bootstrap consistency theorem for the sample mean or a result for the particular statistic. A larger number of resamples reduces Monte Carlo error; it cannot repair the bootstrap failure for a uniform endpoint, an unrepresentative statistical sample or ignored statistical dependence.[ref]
Lecture 12: The Bootstrap. UW STAT 535: Statistical Machine Learning, Autumn 2026; High level idea of how bootstrap works; Bootstrap and Statistical Functionals, conditional variance and bootstrap variance consistency; Failure of the bootstrap, uniform-endpoint counterexample
Quadratic discriminant analysis Created 2026-09-24 Updated 2026-09-24
Quadratic discriminant analysis uses class-conditional Gaussian distributions with class-dependent covariance matrices. Their log density ratio is a quadratic polynomial in the observation.
Linear discriminant analysis Created 2026-09-24 Updated 2026-10-03
LDA assumes class-conditional Gaussian distributions with a shared covariance matrix, producing affine log odds.
Gaussian conditional expectation Created 2026-09-24 Updated 2026-10-03
Logistic distribution Created 2026-09-24 Updated 2026-09-24
Maximum-likelihood estimator Created 2026-09-24 Updated 2026-10-14
A maximum-likelihood estimator is an estimator whose value maximizes the likelihood function for each sample where a finite maximizer exists. Before observation, is a random variable (the choice of maximizer must be a measurable function); after observation, is the numerical maximum-likelihood estimate. A formula must specify the allowed parameter set, including whether its endpoints belong to it.
For ten independent Bernoulli trials, write . On the closed parameter interval , the binomial proportion maximum-likelihood estimator is . Eight successes give the estimate . If , the likelihood is and has its unique maximum at ; if , it is and has its unique maximum at . On the open interval these two samples have no maximum-likelihood estimate: the supremum is one, but it is not attained. This is the same issue as likelihood supremum at an excluded boundary.
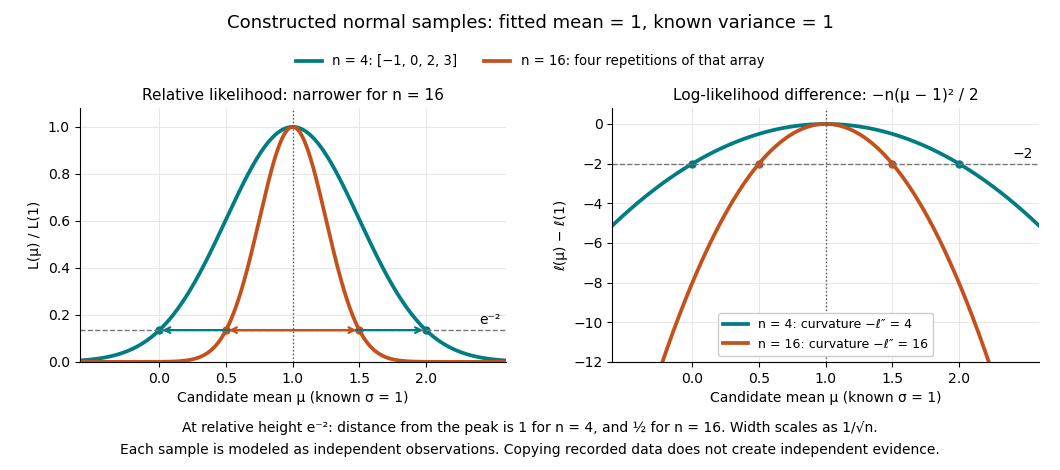
A complete continuous example uses independent and identically distributed random variables with unknown mean and known standard deviation one. Their likelihood function and log-likelihood areThe sum of squared deviations separates asbecause . The first term is fixed in , so the unique maximum-likelihood estimator is the sample mean . This also proves the equivalence with ordinary least squares for this model. With the constructed observations , the sample mean is one and the residual sum of squares is ten; henceAt or , the log-likelihood is two below its peak, so the likelihood ratio to the fitted value is . The absolute likelihood at the peak is , a joint density value, not the probability of observing exactly those four real numbers.
The following figure compares that sample with a constructed sixteen-observation sample consisting of four repetitions of the displayed four values, modeled as sixteen independent draws. Both fits have sample mean one, butThus the observed information is four times as large for as for . The distance from the peak at relative height decreases from one to : the width scales as . This is a comparison of two stipulated samples; merely copying recorded observations would not create new independent evidence.


Even uniqueness needs checking. If the Bernoulli distribution success parameter is written with , eight successes give two maximum-likelihood estimates, , because both give the same probability distribution. The problem is a failure of identifiability. The special cases below show other ways an MLE can have bias or fail the usual asymptotic normality.
Log-linear model Created 2026-09-24 Updated 2026-09-24
Additive main effects encode mutual independence in contingency-table Poisson models. An interaction permits association of its factors.
Odds ratio Created 2026-09-24 Updated 2026-09-24
The odds ratio is the ratio of two event odds. For rare events it is close to the corresponding risk ratio, because when is small.
Risk ratio Created 2026-09-24 Updated 2026-10-03
Regression leverage Created 2026-09-24 Updated 2026-10-14
Normal linear model Created 2026-09-24 Updated 2026-10-14
, , and full-rank gives .
Independent Poisson conditioning Created 2026-09-24 Updated 2026-09-24
Independent Poisson variables conditioned on their sum are multinomial, with cell probabilities proportional to their rates.
Generalized linear model Created 2026-09-24 Updated 2026-10-14
A generalized linear model takes independent responses from an exponential dispersion family and relates their means to linear predictors by . The response distribution, systematic component, link, dispersion, and known observation weights together specify the model.
Exponential family Created 2026-09-24 Updated 2026-09-28
Shape parameter Created 2026-09-24 Updated 2026-10-03
A shape parameter changes the form of a probability distribution without merely translating it or rescaling its random variable.
Akaike information criterion Created 2026-09-24 Updated 2026-10-14
Heteroscedastic Created 2026-09-24 Updated 2026-10-14
A model is heteroscedastic if its conditional error variance is not constant across observations; this is the variable-variance case of homoscedasticity and heteroscedasticity.
Unbiased estimator Created 2026-09-24 Updated 2026-10-03
Statistical learning Created 2026-09-24 Updated 2026-10-14
Statistical learning constructs predictive rules from data and studies their prediction error, generalization, and computational fitting. In supervised learning, training data contain inputs and a response variable : regression analysis predicts a numerical response, while classification in statistical learning predicts a label. Unsupervised learning instead seeks structure without supplied responses, as in cluster analysis and principal component analysis. These tasks connect learning to probability and mathematical optimization. [ref]
https://web.stanford.edu/~hastie/ISLR2/Slides/Ch2_Statistical_Learning.pdf. James, Witten, Hastie and Tibshirani, ISLR chapter 2 slides
For a fitted rule and loss function , the predictive goal iswhere is a fresh observation, independent of the training data , from the intended target probability distribution. This prediction error fixes the fitted rule and averages over future observations; averaging again over training data gives the learning procedure's average performance. Its practical beauty is that a rule compresses past observations into useful future predictions. Its central difficulty is that excellent training error need not imply good generalization: cross-validation supports model selection, and a reserved test set assesses the resulting choice.
There are unlisted articles, also show them or only show them.