The nail plate is the firm, keratinized material of a nail that lies over the nail bed and projects as the free edge. Its densely packed dead keratinocytes are produced through the growth process associated with the nail matrix. The plate protects the fingertip and supplies a backing surface during manipulation of small objects.[ref]
The distinction between produced material and producing tissue makes a direct growth measurement intelligible. A mark embedded in the plate moves distally as new material is produced proximally; the exposed material does not lengthen by its own cells dividing. Measuring the current free edge alone mixes growth with clipping and wear.
An original mark-displacement example observes positions 2 and 8 mm from a fixed reference fold, sixty days apart. The mean advance is mm/day. If the reference landmark moves or the mark is worn away, that calculation no longer measures the same displacement. Repeated measurements should preserve both the mark and the anatomical reference.
A primary growth study used supplied nail files to mark nails in 22 healthy young adults and measured displacement again one to three months later.[ref]
Growth rate of human fingernails and toenails in healthy American young adults by S. Yaemsiri and others. Abstract, Methods
It exemplifies following material rather than assuming that the free edge records all growth.Nail-plate material age from growth marks needs more than dividing distance by a single population-average rate. If advance varies with time, a material element's displacement is the integral of its growth history. A clipping can also contain material formed over an interval. Measurements of chemicals in a clipping therefore require position, growth and external-contamination information before being interpreted as a precisely dated exposure record.
The plate, nail bed and nail matrix are complementary parts of one apparatus: transported material, supporting tissue and the region producing much of that material. Keeping them distinct avoids assigning vascular colour or proliferative activity to the exposed plate itself.
Collection geometry in nail-transmission measurements specifies which light emerging from a nail plate reaches the detector. A narrow forward detector and an integrating sphere can report different signals from the same specimen because light scattering redistributes directions. The reported transmittance must identify its collection conditions.
The primary 1983 nail study measured total transmitted radiation at fifteen wavelengths from 300 to 600 nm through thirteen autopsy toenails, using a monochromator, integrating sphere and photodiode.[ref]
The transmission of optical radiation through human nails by S. G. Parker and B. L. Diffey. Abstract, specimen set and apparatus
The angular collection is part of the measurement, alongside the wavelength and the separate correction for fluorescence.An original angular model separates on-axis direct transmission from a diffuse transmitted fraction . Suppose the diffuse component has constant radiance over the outgoing hemisphere. A detector accepting all azimuths up to angle from the surface normal collects the fractionThe cosine accounts for projected emitting area. Assuming the direct beam is entirely collected, . This is a constructed angular distribution, not a measured scattering law for nails.
At stipulated , and degrees, and the detected fraction is 0.06 although total transmission is 0.12. Aperture-dependent diffuse transmission in nail measurements also depends on distance. For a small emitting region facing a circular aperture of radius at distance , in this model. With mm, distances 10 and 20 mm give approximately 0.0560 and 0.0447 for measured transmission, respectively, without a specimen change.
An integrating sphere collects a much broader angular distribution, but its ports, coating and detector coupling still require characterization. A useful comparison holds the specimen, incidence and spectral band fixed while changing collection aperture or recording angular response. Correcting fluorescence does not recover scattered light that was never collected, and a calibration made in one geometry does not automatically apply in another.
Aperture-dependent diffuse transmission in nail measurements is the change in measured transmittance caused by accepting different outgoing directions from a nail plate. The material can remain unchanged while the collected fraction changes. The relevant quantity is the optical acceptance, not aperture area alone.
For an original geometric model, take a small emitting region with constant diffuse radiance, viewed by a coaxial circular opening of radius at distance . Its limiting angle obeys . Projected-area weighting gives the accepted diffuse fractionIf the direct beam is fully collected, a direct fraction and a total diffuse fraction produce . This assumes geometric propagation and negligible finite-source and diffraction effects. In particular, the direct-beam assumption is not valid for an arbitrarily small physical opening.
At stipulated mm, and , openings of radius 5 and 10 mm collect and 0.50. The respective measured fractions are 0.056 and 0.080, although total transmittance is 0.12 in both cases. Doubling the aperture radius quadruples its area but does not quadruple the collected diffuse fraction.
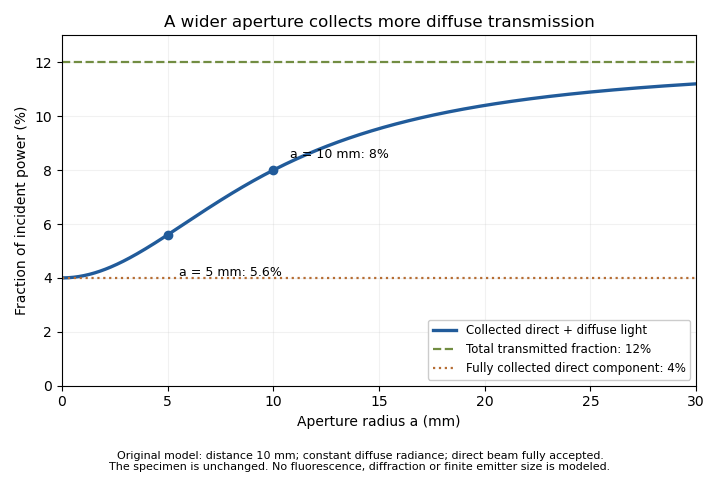
An unchanged hypothetical nail specimen gives different measured transmission as collection radius changes
. Original constant-radiance geometric model at distance 10 mm. The direct fraction is 4 percent and the diffuse fraction is 8 percent. These are stipulated values, not measured human-nail data. Details.
An aperture-scan separation of direct and diffuse nail transmission needs distinct acceptances and a stable angular model. In the ideal two-aperture case,For the stated values, the two measurements recover 0.08 and 0.04. Nearly equal acceptances amplify measurement differences by a large factor. Changing distance or source size during the scan would change the model as well as the acceptance.
The primary nail experiment used an integrating sphere with a monochromator and photodiode to measure transmitted radiation.[ref]
The transmission of optical radiation through human nails by S. G. Parker and B. L. Diffey. Abstract, collection apparatus
The sphere provides a different angular collection arrangement from this opening model; it does not establish the assumed diffuse radiance law. A useful comparison characterizes each detector geometry before interpreting a signal difference as a change in the nail plate.Aperture-scan separation of direct and diffuse nail transmission estimates the directly collected and diffusely transmitted fractions of light by changing detector acceptance while keeping the nail plate and illumination fixed. Separation depends on a stated angular model: a change in aperture is an experimental control, not a direct label attached to every photon.
In the original constant-diffuse-radiance model, let , where is the fully accepted direct fraction, the total diffuse fraction and the known diffuse acceptance. For a coaxial circular opening, the geometric approximation gives . Two distinct acceptances giveThe distinction between these components is identifiable within this model only when the acceptances differ.
Suppose , , and . The fitted fractions are and . If independent signal errors each have standard uncertainty , with acceptance uncertainty temporarily neglected, linear propagation givesandThe resulting uncertainties are about 0.00943 and 0.00359. Their negative covariance matters when adding the components: the total-transmission uncertainty is about 0.00629, rather than the value obtained by incorrectly treating the fitted components as independent.[ref]
Guide to the expression of uncertainty in measurement by JCGM. §5.2.2, equation 13, covariance in propagation
Additional apertures give a straight-line fit of against , with intercept and slope . Weighted least squares can use independently characterized signal uncertainties. Systematic curvature would challenge the assumed angular law or fixed direct-beam acceptance. A plausible line alone does not prove that a finite source, changing geometry or residual fluorescence has been modeled correctly.
The primary nail-transmission study collected transmitted light using an integrating sphere, monochromator and photodiode.[ref]
The transmission of optical radiation through human nails by S. G. Parker and B. L. Diffey. Abstract, collection apparatus
The aperture scan here is an original proposed comparison, not a procedure or angular scattering law reported in that experiment.Fluorescence contamination in nail-transmission measurements occurs when light emitted by a specimen contributes to a detector signal intended to quantify transmitted illumination. Emission can reach the detector at wavelengths different from the selected illumination wavelength, where detector spectral responsivity may also differ. Total current therefore need not be proportional to the desired transmitted power alone.
The primary human-nail experiment explicitly included a correction for nail fluorescence in its monochromator, integrating sphere and photodiode measurement.[ref]
The transmission of optical radiation through human nails by S. G. Parker and B. L. Diffey. Abstract, fluorescence correction
It supplies an experimental motivation for distinguishing optical transmission from all detected light.An original two-channel calibration model makes the separation explicit. Let be transmitted excitation-band power and an emitted component with a specified spectral shape. After dark-signal subtraction, calibrated channel readings satisfyThe coefficients incorporate filters, detector spectral responsivity and collection efficiency. Separation requires ; two identical mixtures provide no additional information.
For stipulated dimensionless coefficients and , power-equivalent readings 0.100 and 0.024 mW giveAt incident power 1 mW, the corrected excitation-band transmittance is 8%; treating the first channel as transmission alone gives 10%. These are illustrative signals, not reported nail data.
Excitation-band selectivity in nail fluorescence corrections can be tested by changing the detection spectral band while keeping excitation and geometry fixed. The calibration still depends on the assumed emission spectrum: a different spectral shape can change the coefficients. A filter can also reject some desired transmitted light, requiring its own calibration.
Separate dark current, stray excitation light and specimen emission in the measurement equation. A correction is useful only for the component it actually constrains; it should not be interpreted as identifying the chemical origin of all remaining optical changes.
Excitation-band selectivity in nail fluorescence corrections describes how well the detection system distinguishes transmitted illumination from light emitted by the nail plate. Selecting the illumination with a monochromator does not force every detected photon to remain in that spectral band: fluorescence can contribute at other wavelengths.
For an original linear detection model, write the transmitted and emitted spectral powers as and , where both spectral shapes integrate to one. If an optical filter has transmission and a detector has spectral responsivity , its current after subtraction of dark current isThe coefficients are spectrum-weighted responsivities, with units of amperes per watt. A selective filter can reduce while also reducing , so an uncorrected smaller current does not establish lower specimen transmittance.
For stipulated , , and , current is . Assigning all of it to transmitted illumination gives , a 1.67% relative overestimate. These chosen coefficients illustrate leakage; they are not measured filter characteristics for nails.
Emission-spectrum mismatch in nail fluorescence subtraction matters when the assumed differs from the specimen's emission. If analysis subtracts while the true coefficient is , thenAt the same powers and , using instead of 0.020 leaves a positive bias. A precisely known total emitted power would not eliminate this spectral mismatch.
The historical nail-transmission experiment explicitly corrected for fluorescence.[ref]
The transmission of optical radiation through human nails by S. G. Parker and B. L. Diffey. Abstract, fluorescence correction
The integral above is an explanatory extension, not a reconstruction of its unpublished correction coefficients. An experimental test would characterize detector/filter response and compare detection bands while keeping illumination and collection geometry in nail-transmission measurements fixed. Spectral rejection and angular collection constrain different parts of the measurement.Emission-spectrum mismatch in nail fluorescence subtraction is the error caused by correcting a detector reading with an assumed fluorescence spectrum that differs from the actual emitted spectral shape. Knowing total fluorescent power does not generally determine fluorescent detector current, because the detector/filter response varies with wavelength.
Let be the true normalized emission spectrum, the assumed normalized spectrum and the product of spectral responsivity and optical filter transmission. DefineFor a current , subtraction of givesAlthough , the response-weighted integral need not vanish. Equal total emitted powers can therefore require different corrections.
An original two-band example makes the effect visible. Suppose the effective responsivity is and in two nonoverlapping bands. If fraction of fluorescent power lies in the first band, . The assumed fraction gives , whereas the true gives . At and transmitted-band responsivity , the transmitted-power estimate is biased by . A true would be reported as after that excessive subtraction.
These are stipulated spectral shapes and coefficients, not measured nail spectra. If were constant over the entire emission band, normalization would make this particular shape error vanish. A selective system generally sacrifices that invariance to distinguish transmitted excitation light from emission. Responsivity characterization and spectral measurement must therefore accompany a proposed subtraction.
The primary nail experiment explicitly included a correction for fluorescence while measuring transmission with a monochromator, integrating sphere and photodiode.[ref]
The transmission of optical radiation through human nails by S. G. Parker and B. L. Diffey. Abstract, fluorescence correction and apparatus
That observation motivates the distinction between emitted power and detected current; it does not specify the two-band correction model above. Fixing an assumed spectrum in software does not establish that the specimen actually has that spectrum.Nail-plate material age from growth marks estimates how long a marked part of the nail plate has travelled since crossing a specified reference. It is a transport clock, not a direct observation of the instant when the material first formed in the nail matrix. The anatomical reference and any hidden travel before reaching it must be specified.
In a primary growth experiment, 22 young adults made file marks near the proximal fold, recorded their positions and repeated the measurements one to three months later.[ref]
Growth rate of human fingernails and toenails in healthy American young adults by S. Yaemsiri and others. Abstract, Methods
This measures average displacement during the observation interval; it does not by itself recover every earlier growth rate.For an original one-dimensional advection model, let a material element cross the reference at time . If plate advance is spatially uniform with speed , its later position isA known growth history permits inversion for . A current speed alone need not. For example, 30 days at mm/day followed by 30 days at mm/day gives displacement 6 mm and age 60 days. Dividing by the final speed gives only 50 days, because it substitutes today's speed for the earlier history.
If only bounds are justified throughout the travel, thenFor 6 mm and stipulated speeds between 0.08 and 0.12 mm/day, the reference-crossing age lies between 50 and 75 days. These bounds describe an original model, not published population limits.
A clipping also spans material positions. Even at a perfectly known constant speed of 0.10 mm/day, a 3 mm longitudinal segment spans 30 days of reference-crossing times. Temporal averaging in nail clippings therefore remains after instrument precision improves. External contamination or chemical exchange can further separate a measured chemical signal from the time of matrix production. Record mark position, reference fold, clipping extent and observation dates before treating a nail plate sample as a dated exposure record.
Temporal averaging in nail clippings is the mixing of material formed or transported at different times into one measured sample. A clipping has finite length, width and thickness. Even perfect chemical measurement of the whole sample need not resolve the timing of a short exposure.
A primary nail-growth experiment followed file marks near the proximal fold in 22 young adults over one to three months.[ref]
Growth rate of human fingernails and toenails in healthy American young adults by S. Yaemsiri and others. Abstract, Methods
Such displacement measurements constrain the transport clock. Relating a chemical concentration to an earlier exposure requires additional assumptions about incorporation, retention and contamination.For an original ideal advection model, let material cross a reference at time with concentration , thereafter retained unchanged. At constant speed , a segment between positions and at collection time contains reference-crossing times from to . If mass per unit length is uniform, its measured concentration isThis is a shifted moving average, equivalently a convolution with a rectangular window. Its clock is reference crossing; formation in the hidden nail matrix may precede that crossing.
For a 3 mm segment at stipulated speed 0.10 mm/day, days. If a hypothetical incorporated concentration equals for only five days and zero otherwise, the largest possible clipping average is . A broad, low measured peak can therefore result from a short, high input without any chemical decay. These values illustrate the model rather than an observed exposure record.
Spatial weighting of nail-clipping exposure records becomes important when thickness, width or density varies: the average is weighted by material mass, not distance alone. Variable growth further distorts the time window. A wider segment generally mixes a longer history, while repeated analyses of the same segment improve analytical precision without shortening that history.
Record clipping extent, material orientation, collection date and how growth was measured. Comparing several separately retained segments can provide more time information than pooling them, but recovering a unique exposure history remains an inverse problem unless the transport and retention model is sufficiently constrained.
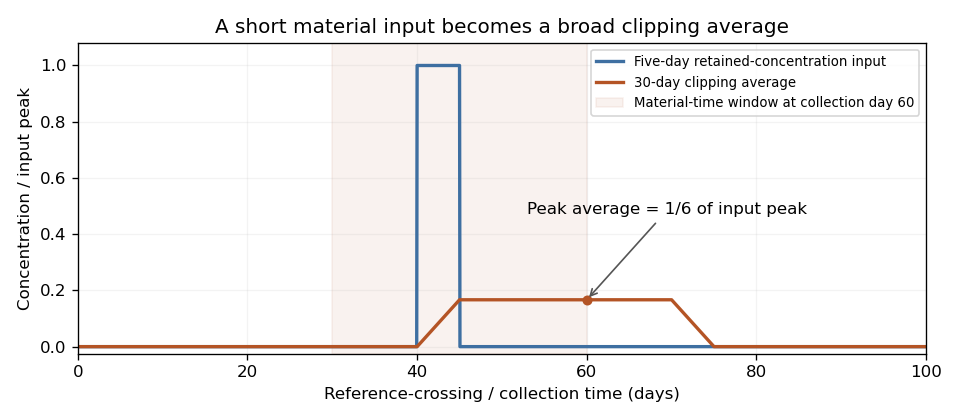
An original ideal clipping model spreads a five-day retained-concentration input across a thirty-day material window. The peak clipping average is one sixth of the input peak, even without chemical decay.
Details. 
Spatial weighting of nail-clipping exposure records determines how much each region of a clipping contributes to a pooled chemical measurement. A concentration reported per unit nail mass is a mass-weighted average. Equal lengths of nail plate need not supply equal amounts of material if width, thickness or density differs.
Let be mass per unit length at collection and the retained concentration per unit material mass. For a clipping spanning , an original ideal recovery model givesThis assumes complete, composition-independent recovery by the assay. If recovery varies spatially, the measurement equation requires that additional weighting.
For two equal-length regions with masses 1 and 3 mg and stipulated concentrations 0 and 100 units per mg, the pooled concentration is units per mg. A length-weighted average would give 50 and answer a different question. The numerical example illustrates geometry and normalization, not an observed exposure.
Mass-normalized temporal kernels for nail clippings arise when positions are converted into earlier reference-crossing times. If is the material map at collection, the normalized time weighting isAt constant advance speed and uniform line density, the kernel is rectangular, recovering temporal averaging in nail clippings. Variable material geometry or speed changes its shape. A growth experiment following file marks measures displacement over a known interval, not this entire weighting function.[ref]
A practical study retains segment orientation and measures the material amount used in each assay. Pooling several digits introduces further weights and potentially different growth histories. Wet-mass and structural-mass normalization also differ when water content changes, connecting the issue to hydration versus production in nail mass balance. Specify the denominator and material-to-time map before assigning a pooled concentration to one exposure date.
Mass-normalized temporal kernels for nail clippings assign each earlier material time its fraction of the analyzed sample's mass. They convert a finite clipping into an averaging operator on a time-dependent retained concentration. The weighting is normalized by the assayed material amount, rather than by elapsed time alone.
For an original one-dimensional advection model, let be the time when a material element crossed a defined anatomical reference, and collect at time . With spatially uniform positive advance speed ,Suppose the clipping's retained elements correspond to . Let be structural mass per unit length at collection, and assume the marker's concentration per structural mass is preserved along each element. ThenThe kernel has units of inverse time, is nonnegative and integrates to one. It can be treated mathematically like a probability density function for the reference-crossing time of material selected in proportion to its mass. This is a material-accounting interpretation, not a claim that the biological transport is random.
For a stipulated 20-day window, take line density 1 mg/mm, advance 0.10 mm/day in the earlier ten days and 0.20 mm/day in the recent ten days. The two intervals contribute 1 and 2 mg, respectively. Their kernel heights are and per day. A retained concentration of 90 ng/mg only in the earlier interval gives ng/mg; a uniform time average would give 45. A constant 30 ng/mg history gives the same sample result. Thus one pooled measurement does not identify a unique history.
A centroid date of a mass-normalized nail kernel summarizes the weighting, while the kernel's spread records its finite time resolution. Neither removes the difference between reference crossing and earlier formation in the hidden nail matrix. The primary nail-marking experiment measures displacement over observation intervals, not the complete kernel or marker retention law.[ref]
Growth rate of human fingernails and toenails in healthy American young adults by S. Yaemsiri and others. Abstract, Methods
Measuring segment mass, geometry and growth history constrains separate parts of this model.The centroid date of a mass-normalized nail kernel is the weighted mean of the reference-crossing times represented by the analyzed nail material. If is normalized so that , its centroid isAt collection time , the corresponding mean material age is . This summarizes a distribution of material times; it is not automatically the date of an exposure or the instant of formation in the nail matrix.
For an original pooled-sample example, suppose equal structural mass comes from two material-age intervals, 0–2 and 18–20 days before collection. Age density is 0.25 per day in each interval and zero between them. Their interval means are 1 and 19 days, so the mean age is 10 days. Yet no sampled material has age 10 days. A single uniform kernel over 0–20 days has the same mean age, with a very different distribution.
The age variance makes part of the difference explicit. A uniform interval of width 2 days has variance . The separated mixture therefore haswhereas a uniform 20-day interval has variance . Equal centroids do not imply equal temporal resolution.
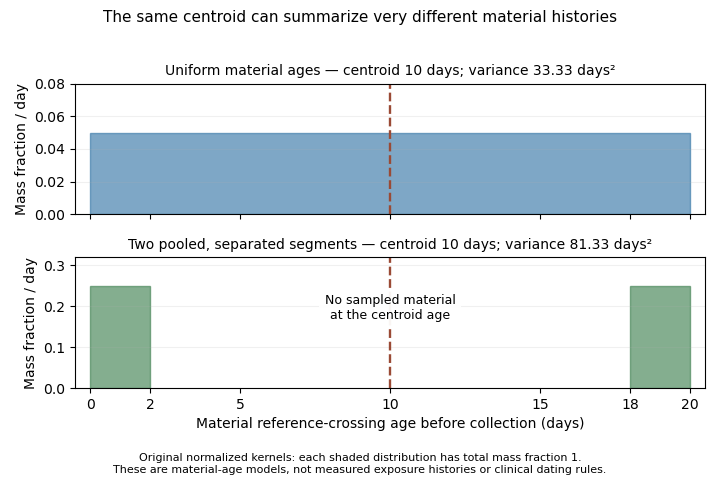
Two original material-age kernels have the same mean age but different spread and sampled intervals
. The lower kernel pools two separated segments of equal mass. Its mean age lies in a gap containing no sampled material. These are hypothetical reference-crossing ages, not observed exposure histories. Details.
The centroid has a precise averaging property. For any representative time ,It minimizes the mass-weighted squared timing discrepancy. Also, if retained concentration is affine in , its kernel average equals its value at . This equality generally fails for a nonlinear history: a quadratic averages to , not .
A primary growth experiment followed marks near the proximal nail fold over measured intervals.[ref]
Growth rate of human fingernails and toenails in healthy American young adults by S. Yaemsiri and others. Abstract, Methods
Such displacement observations help constrain the material clock. They do not establish the full kernel, marker retention or one unique exposure date. Report the reference, distributional width and pooling assumptions alongside a centroid date. Articles by others on the same topic
There are currently no matching articles.