An incident SEM probe undergoes elastic deflections by atomic potentials and inelastic interactions that excite or ionize the specimen. Repeated scattering generates an interaction volume wider and deeper than the incident probe. The measured resolution depends both on where a signal is generated and on whether it can escape.
| Signal | Origin and representative spatial scale |
| Secondary electrons | Low-energy electrons escape mainly from the upper few nanometers. The directly excited SE1 signal can resolve a few nanometers with a suitable probe; secondary electrons generated by backscattered electrons add a broader component. |
| Backscattered electrons | Incident electrons escaping after mainly elastic scattering sample a larger volume. Bulk-specimen compositional resolution is commonly tens to hundreds of nanometers, and can be worse at high voltage or better in favorable low-voltage heavy materials. |
| Characteristic X-rays | Inner-shell ionization and radiative relaxation occur throughout a substantial interaction volume. Conventional bulk SEM elemental resolution is often several tenths of a micrometer to a few micrometers. |
| Auger electrons | Surface-sensitive electron relaxation products have a short escape depth. Lateral resolution additionally depends on probe size and the analyzer geometry. |
| Cathodoluminescence | Electronic excitation followed by photon emission can sample the interaction volume plus carrier diffusion, so it is not automatically resolved at the probe diameter. |
Transmitted electrons from a sufficiently thin specimen can instead support scanning transmission electron microscopy. The values above are orders of magnitude, not intrinsic constants of the signal: beam energy, atomic number, specimen thickness, probe size and detector geometry all matter. The spatial origin explains why a fine topographic SEM image does not guarantee equally fine X-ray mapping.
Prepare a dilute dispersion of separated nanoparticles on an electron-transparent support, for example a thin carbon film on an electron-microscopy grid. A sparse deposited aliquot can be dried and the grid mounted over an open transmission aperture in the holder. The beam path must not be blocked by a bulk substrate.
Dilution and a thin, clean support reduce overlap, multiple scattering and background. Remove excess soluble residue where compatible with the particle surface chemistry, and ensure the support and mounting provide adequate electrical conduction. The desired object is an isolated, vacuum-compatible particle layer, rather than a thick dried droplet or an opaque slab.
Use a sufficiently high SEM acceleration voltage to transmit through the particle/support combination and provide useful diffracted intensity; operation near the high-voltage end of the SEM range is a reasonable starting point. The supplied wavelength is used directly for the camera-length calculation, rather than assigning a precise voltage from an approximate wavelength relation.
Choose the smallest beam current consistent with usable counting statistics, because the stated source-size contribution obeysHigher gun brightness permits more current at the same small probe. A relatively short working distance can give a larger convergence semiangle and reduce this term. In the specified fixed lens-to-detector geometry, shortening working distance also increases the specimen-to-detector camera length, reducing the detector's collection angles.
The objective aperture should be optimized, not made arbitrarily large: increasing reduces the source-size and diffraction contributions, but spherical/chromatic aberrations and angular broadening eventually worsen the probe or diffraction selectivity. A suitable aperture balances those effects while keeping the chosen diffraction rings within the annulus. Adjust specimen height to meet that angular condition, focus and align at the operating voltage, and control drift and contamination.
Low convergence favors angular discrimination of diffraction, whereas high convergence can favor probe size. The optimum therefore depends on whether spatial detail or sharply selected Bragg diffraction contrast is the limiting requirement.
For a face-centered cubic lattice, allowed reflections have indices all odd or all even. The first two are and , withFor first-order Bragg diffraction, . The detector intercepts the beam at the full scattering angle , givingThe inner detector radius supplies the minimum length for each ring:Thus both rings reach the annulus when . At this minimum the 200 ring is at roughly , well inside the outer radius. Both remain within the detector for approximatelyEquality at the inner edge gives vanishing acceptance for an ideal infinitely narrow ring, so practical operation requires a small margin. The calculation concerns ring positions; individual nanoparticle orientation and the finite probe convergence also affect observed diffraction contrast. Using the Bragg angle instead of the full scattering angle would introduce an erroneous factor of about two.
Molecular beam epitaxy is a suitable research-scale choice. Independently controlled elemental beams and shutters allow abrupt composition changes, controlled silicon donor incorporation and thin spacer layers. Growth can proceed sequentially from the GaAs substrate through the undoped GaAs, undoped AlGaAs spacer, doped AlGaAs supply layer and highly doped GaAs cap.
A clean crystalline surface and controlled substrate temperature support epitaxial interfaces; separating the donor layer from the channel is modulation doping. Metalorganic vapor-phase epitaxy can also grow such structures, but MBE's controllable research-scale layer sequence is a strong match to the stated task. Merely depositing the right total elemental amounts would not guarantee the required crystallinity and interface abruptness.
A suitable sequence isFirst pattern the source/drain resist, then deposit and lift off the corresponding metal. Anneal these contacts to produce the low-resistance source/drain interfaces. Remove the exposed cap layer before gate lithography, leaving the cap beneath the contact metal; this uses the contact pads as an etch mask, with suitable protection where required. Finally define and deposit the gate onto exposed AlGaAs and lift off.
The key dependencies are that source/drain metal lands on the n+ cap, the gate lands on AlGaAs after cap removal, and the contact anneal precedes formation of the sensitive Schottky gate. A gate-recess variant can put gate lithography before the local cap etch if that resist is deliberately used as its mask, but it must additionally specify how unwanted conducting cap elsewhere is removed or isolated. The sequence above directly matches the cap remaining only beneath the source/drain contacts in the diagram.
Choose process B, the citric-acid/peroxide wet etch. Its GaAs-to-AlGaAs etch selectivity is , giving strong protection of the underlying barrier and a controllable removal rate for the thin cap.
For comparison, A has selectivity one and therefore no useful etch stop. It is also extremely fast: a nominal GaAs layer would be removed in only . C has selectivity , useful but inferior to B, and clears the same cap in about . D has selectivity four, clears the cap in about and additionally risks plasma-induced surface damage or altered interface properties.
B clears the nominal cap in about . Its slower underlying etch permits a more forgiving endpoint or modest overetch, although actual rates must be checked for the relevant composition and conditions. Wet-etch lateral undercut and contact-metal compatibility still matter; selectivity alone does not make every mask geometry acceptable.
Higher donor concentration moves the semiconductor Fermi level toward the conduction band, reducing the semiconductor work function when these quantities are expressed as energies. Equilibration with the metal aligns electrochemical potentials and creates band bending.
For an ideal n-type Schottky interface the barrier energy is not automatically reduced merely by raising doping. The decisive change is the narrower depletion region:Large allows electrons to tunnel through the thin barrier, reducing the contact resistance and promoting an approximately Ohmic contact. Contact annealing can further modify the local interface and doping. This allows low-resistance source/drain injection while preserving a more rectifying gate contact; real interface-state pinning can modify the ideal work-function picture.
Use equal-width rectangular contact windows in a row with several different edge-to-edge spacings. For positive-resist lift-off, the future metal pads correspond to clear windows in an otherwise chrome-covered mask: exposure removes resist there, and the unexposed background retains resist beneath unwanted metal.
For ordinary ohmic transmission line contact measurement, a conducting strip or isolated mesa of width connects adjacent pads. Measure several spacings so thatThe intercept separates two contact contributions from the sheet-resistance slope. Large enough pad length relative to the transfer length is needed for the simplest contact-resistivity extraction.
Prepare separate arrays on the appropriate surfaces: annealed source/drain metal on the n+ cap, and gate metal on cap-removed AlGaAs. A Schottky gate is nonlinear, so its interface cannot be assigned an ohmic zero-bias contact resistivity merely by fitting the same straight line. Use bias-dependent current–voltage or differential-contact analysis, accounting for the two rectifying contacts.
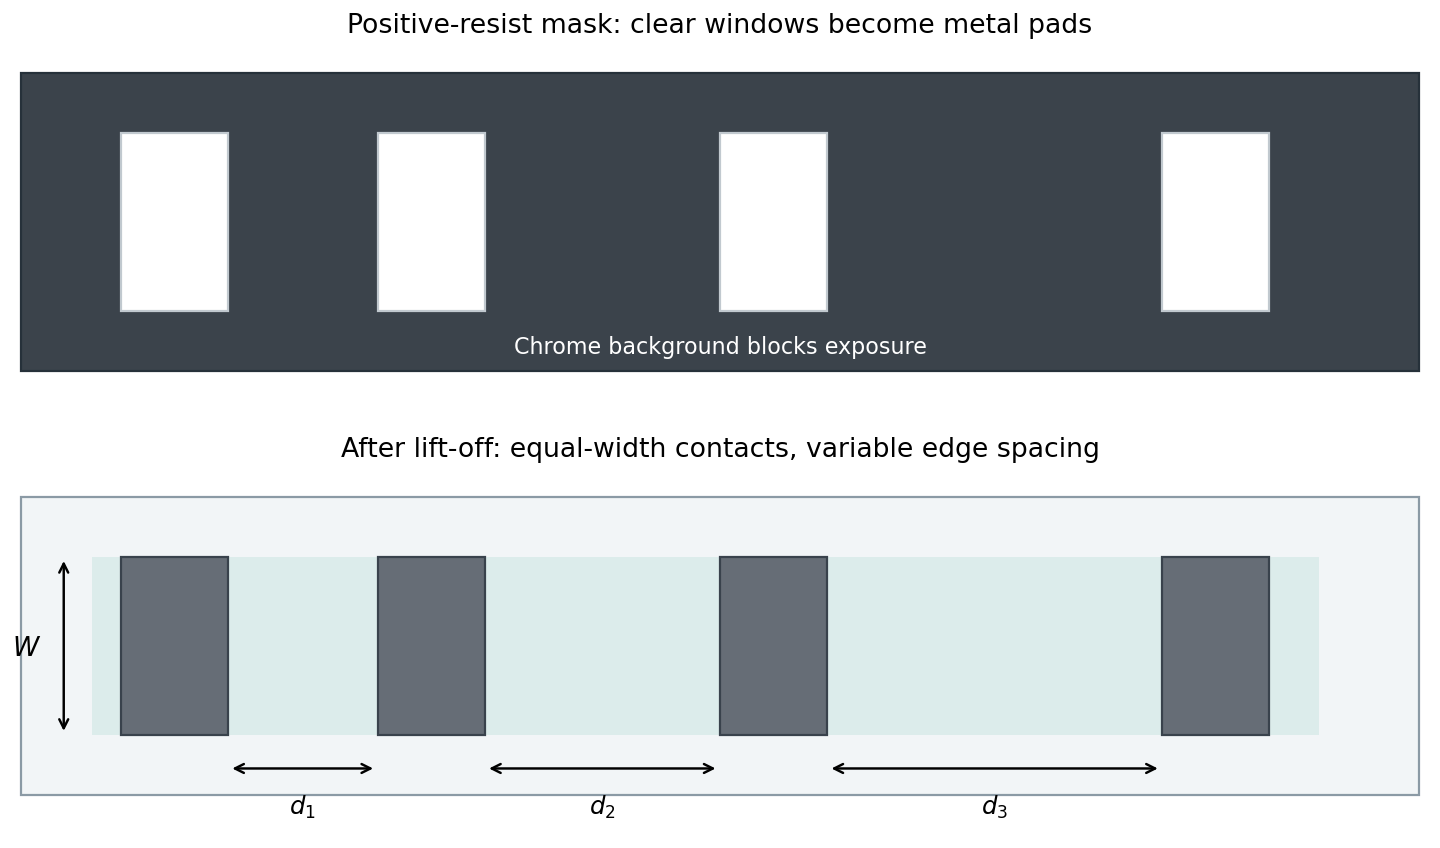
Positive-resist lift-off mask and variable-spacing contact array
. Original schematic. Pale windows in the dark chrome background define future metal pads. The resulting equal-width pads have different edge spacings. Ohmic TLM analysis and bias-dependent analysis of a Schottky contact require distinct electrical models. Details.
Starting from the clean wafer, dehydrate it and use an appropriate adhesion treatment if required. Spin coat the positive resist to obtain a uniform film, then soft bake to remove solvent and stabilize handling. Align the mask and expose the clear pad windows. Develop away the exposed resist, rinse and dry, leaving openings at future metal locations.
Inspect the openings and clear residual resist gently if needed. Perform a compatible surface preparation immediately before metallization so that an unintended oxide or contaminant film does not dominate the contact. Deposit metal with a resist profile and film thickness that leave an accessible discontinuity at the resist edge; an undercut or suitable lift-off stack helps prevent continuous sidewall coating.
Dissolve the sacrificial resist and lift off metal above it, leaving the pads on the exposed semiconductor. Rinse, dry and inspect for residues or bridges. For source/drain test contacts, apply the intended contact anneal; for gate test contacts, preserve the intended Schottky interface. An aggressive final resist hard bake or a fully conformal bridging metal film can defeat lift-off, so these are not automatic extra steps.
The surface carboxylic acid is less reactive toward direct nucleophilic acyl substitution: hydroxide is a poor leaving group, and an amine initially tends to form an ammonium carboxylate salt. An alcohol also does not normally give rapid, quantitative ester formation merely by mixing with the acid.
Conversion to an acyl chloride activates the carbonyl and provides chloride as a substantially better leaving group. Amine or alcohol attack can then form a tetrahedral intermediate followed by elimination and proton transfer, giving the grafted amide or ester. Other coupling or esterification methods are possible; acid-chloride activation supplies the efficient route used in this scheme. Surface functionalization with the corresponding alkylamine and diol was demonstrated in the underlying carbon-material study.[ref]
Controlled dispersion of carbon nanospheres through surface functionalization by Margaret J. Sobkowicz and others. Carbon 47 (2009), pp. 622–628; covalent alkylamine and diol surface grafting
CNS-DDA contains an amide linkage, . The amine nitrogen becomes bonded to the surface carbonyl carbon.
CNS-EG contains an ester linkage, . One alcohol group forms the ester while the other remains an outer hydroxyl group. The latter is not an ether linkage at the surface carbonyl.
Centrifuge the dispersion, separate the particle-rich sediment from the supernatant, wash the particles with a compatible solvent and repeat separation as necessary to remove soluble reagents and byproducts. Use conditions appropriate to the actual particle size and colloidal stability; the aim is particle separation rather than chemical decomposition.
A suitable membrane filtration process is another possibility if its pore size retains the particles. Simple solvent evaporation alone would leave soluble impurities together with the product, so it is not a selective isolation method.
The products areB retains the terminal alkyne and replaces the tertiary propargylic chlorine with ethoxy. D replaces the benzylic chlorine while retaining the aromatic chlorine; its meta arrangement follows from the drawn starting material, rather than from four aromatic protons alone.
| Product | Proton shift / ppm | Assignment |
|---|---|---|
| B | 1.21, 3H triplet | Ethoxy terminal methyl, coupled to the adjacent two protons. |
| B | 1.46, 6H singlet | Two equivalent methyl groups on the substituted carbon, with no neighboring proton to split them. |
| B | 2.66, 1H singlet | Terminal alkyne proton. |
| B | 3.59, 2H quartet | Ethoxy methylene next to oxygen, coupled to its methyl group. |
| D | 1.18, 3H triplet; 3.58, 2H quartet | The ethoxy group, with a common approximately 7 Hz coupling. |
| D | 4.80, 2H singlet | Benzylic methylene attached to oxygen, with no vicinal aliphatic proton. |
| D | Two aromatic multiplet regions, 4H total | The four remaining ring protons of the disubstituted aromatic ring. |
For B, the strong band is the terminal sp C–H stretch, the band is aliphatic C–H stretching, and the weak band is the alkyne stretch. The terminal proton and alkyne band together distinguish this from an alcohol interpretation of the high-frequency absorption.
For D, is aromatic C–H stretching, is aliphatic C–H stretching, and the and bands are aromatic skeletal stretches. The listed spectrum is a selected peak list, so omission of a C–O band is not evidence that the ether bond is absent.
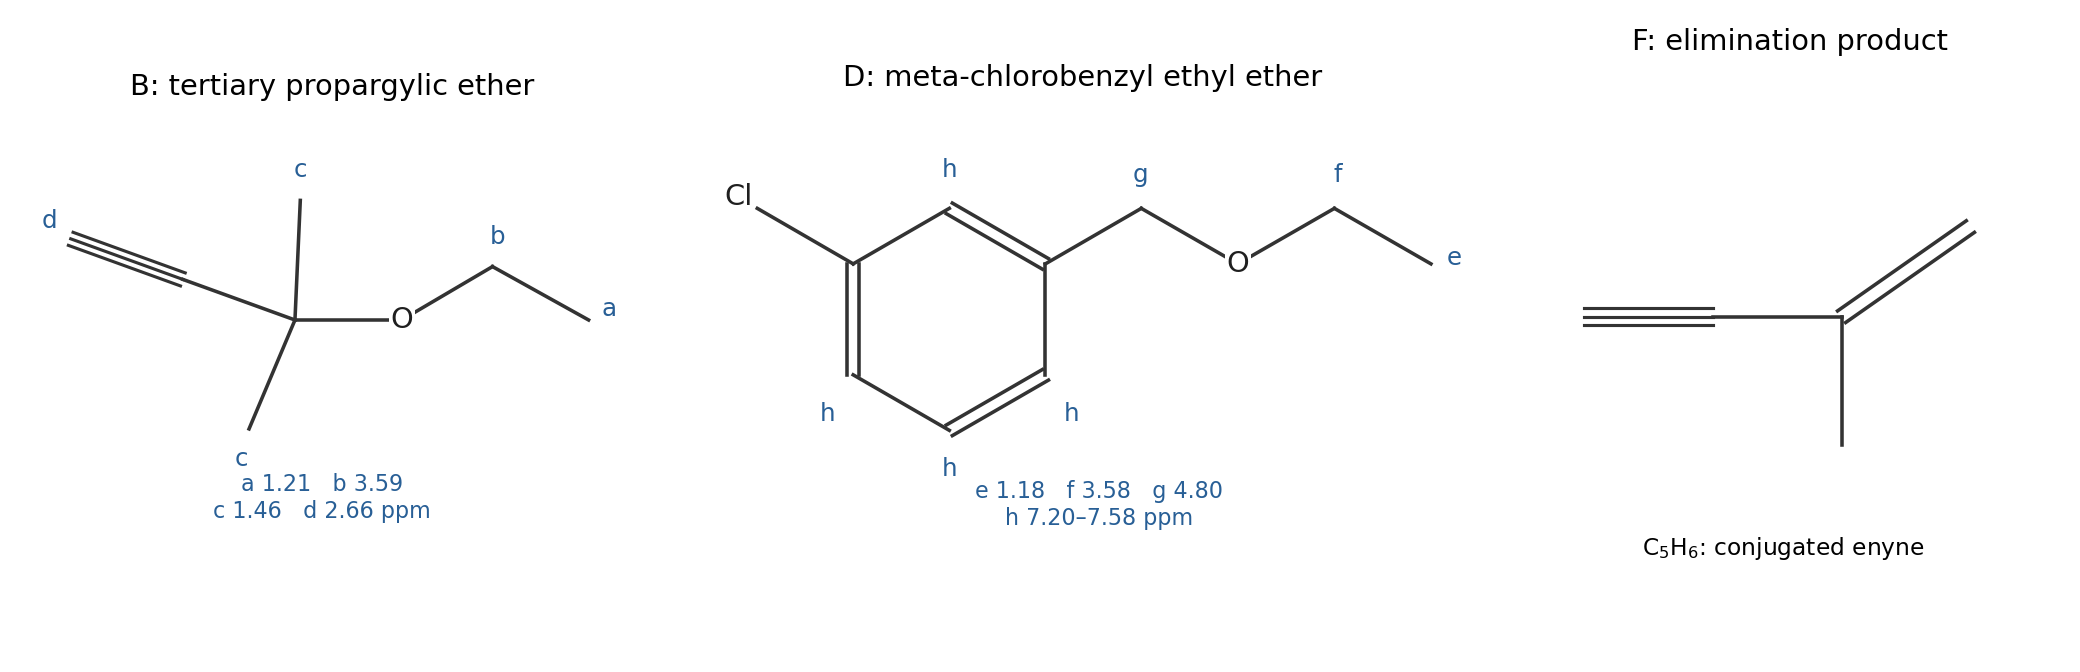
Derived ether products and the competing elimination product
. Original skeletal drawings of B, D and F. B and D retain the unsaturation indicated by the spectral data; F is the conjugated enyne formed by loss of hydrogen chloride from the tertiary propargylic substrate. Details.
For Reaction 1, doubling substrate concentration doubles the rate, while doubling ethanol concentration leaves it unchanged. ThusRate-limiting ionization of the tertiary propargylic chloride gives a carbocation stabilized by substitution and propargylic/allenylic resonance. The crowded reaction center disfavors backside attack, while neutral ethanol is a weaker nucleophile than ethoxide. Ethanol capture and deprotonation occur after the rate-determining step.
For Reaction 2, independently doubling either reactant doubles the rate, and doubling both gives a fourfold increase:The benzylic carbon is primary and accessible, and the strong nucleophile can displace chloride in a concerted step. The reacting bond is benzylic C–Cl, not the ring C–Cl bond. These kinetic orders support the proposed mechanisms in the stated model; the rate table alone would not identify every intermediate in a more complicated reaction network.
The drawn aryl dichloride is expected to undergo no analogous substitution under ordinary ethoxide conditions. Its chlorines are attached directly to sp2 aromatic carbons, rather than to the benzylic sp3 carbon of the previous substrate.
A normal SN2 reaction cannot follow the accessible backside geometry available at a primary benzylic carbon. A simple SN1 reaction would require a highly unfavorable aryl cation. Addition–elimination aromatic substitution would need suitable ring activation, such as a strong electron-withdrawing group in an appropriate position, which the drawing lacks. Forcing aryne chemistry cannot be inferred from ethoxide alone.
The conclusion addresses the actual E-plus-ethoxide scheme shown. The accompanying reference to replacing product B is inconsistent with the preceding substrate labels; interpreting it literally would not define the intended substitution comparison.
Elimination from A givesRemoving a beta hydrogen from either equivalent methyl group while losing chloride creates the same conjugated enyne. The strongly basic ethoxide, , promotes this E2 elimination from the tertiary substrate more strongly than neutral ethanol does. Ethanol instead favors the intended solvolytic capture, although some elimination can still compete.
The formula drawn and used in the rate table is ethoxide. The name “ethanoate” would mean acetate, , a different and resonance-stabilized anion; it should not be silently treated as the same base.
In Reaction 2 the primary benzylic carbon favors rapid substitution. The adjacent aromatic ipso carbon has no beta hydrogen for ordinary side-chain E2 elimination, so the analogous alkene-forming path is unavailable. This does not assert that all benzyl compounds are immune to every side reaction.
On discharge, lithium is oxidized at the negative electrode:At the positive electrode, carbon monofluoride is reduced:The net conversion reaction is thereforeFor general , replace Li, lithium ions, electrons and LiF by equivalents per carbon atom. The carbon–fluorine bonds are consumed in forming different solid phases, rather than lithium simply intercalating reversibly into an unchanged host.
One mole of CF consumes one mole of electrons, so the equilibrium electrical work givesInterpreting the measured OCV as assumes an equilibrated cell and the appropriate standard-state activities; pure solid reactants and products make the ideal activity correction simple. A nonequilibrium or composition-dependent OCV would instead determine the corresponding reaction free energy under those conditions.
The temperature coefficient isThe net reaction involves condensed phases and no gas, so one expects a more modest entropy-driven voltage change than for a reaction creating or consuming substantial gas. However, it is not exactly zero, and its magnitude or sign cannot be calculated from the single OCV value without entropy or temperature-dependent data. This should be separated from potentially strong temperature effects on loaded-cell kinetics and resistance.
Make a composite positive electrode containing the active graphite fluoride, a connected conductive-carbon network and a binder, supported on a suitable current collector. Carbon black provides electronic pathways to distributed reaction sites; the binder maintains cohesion and contact.
Electrolyte-filled porosity provides ionic access, while particle dimensions and intimate mixing limit the distance electrons and lithium ions must traverse. Excess conductive additive or binder dilutes the capacity per gram of composite. The reaction can also alter the electronic network as carbon forms, but that does not remove the need for adequate initial connectivity or prevent insulating LiF from obstructing transport.
This is a primary battery with a strongly reconstructive conversion electrode. Discharge produces stable LiF and a carbon phase while breaking the original carbon–fluorine framework. Charging would have to separate and reorganize those products, restore the fluorinated carbon structure and recover the initial lithium electrode.
LiF is highly stable and poorly conducting, the phase distribution and electrical contacts have changed, and the reverse pathway can require a large overpotential. Electrolyte oxidation or other side reactions can occur before efficient reconstruction is achieved. Thermodynamic reversibility of an overall reaction equation therefore does not guarantee a practical rechargeable electrode.
Graphite starts with approximately planar sp2-bonded carbon sheets and delocalized pi electrons. Increasing fluorination introduces carbon–fluorine bonding, disrupts the extended pi system and increasingly produces puckered, more sp3-like local carbon environments. Layer structure and spacing change rather than remaining those of pristine graphite.
The loss of connected graphitic electronic states generally lowers electronic conductivity and can open a large gap as highly fluorinated material is approached. Low-fluorine arrangements can show more complicated doping and defect effects, so a strictly monotonic conductivity curve for every composition is not implied.
Ratios above one fluorine per carbon require attention to edge, defect and multiply fluorinated environments such as CF2 or CF3; they should not be pictured as adding more than one fluorine to every intact carbon in an otherwise unchanged three-neighbor basal network. The variable empirical composition averages over the actual carbon structure.
Each formula unit of accepts electrons. Using the supplied Faraday constant and the periodic-table masses,The factor converts coulombs to mAh. This value is per gram of the active fluorinated carbon, not per gram of the entire electrode.
The composite value is underdetermined: the mass of active CF₀.₈ is not supplied. If that mass is grams, and the carbon black and binder are inactive in the stated conversion reaction, thenThis uses cathode composite mass and excludes the lithium counterelectrode and hardware. No unique numerical composite capacity follows from the two additive masses alone; assuming an unprovided active mass would change the requested quantity.
Absorption generates electrons and holes in the perovskite. After relaxation toward the band edges, their nonequilibrium populations are described by separate electron and hole quasi-Fermi levels. Selective contacts collect electrons through an electron-transport layer and holes through a hole-transport layer, while suppressing the opposite carriers.
For ideal contacts at open circuit,This quasi-Fermi-level splitting is not the band gap itself or simply the equilibrium built-in voltage. At equilibrium there is one common Fermi level and no extractable photovoltage. Under illumination at open circuit, generation is balanced by recombination while a nonzero population splitting persists.
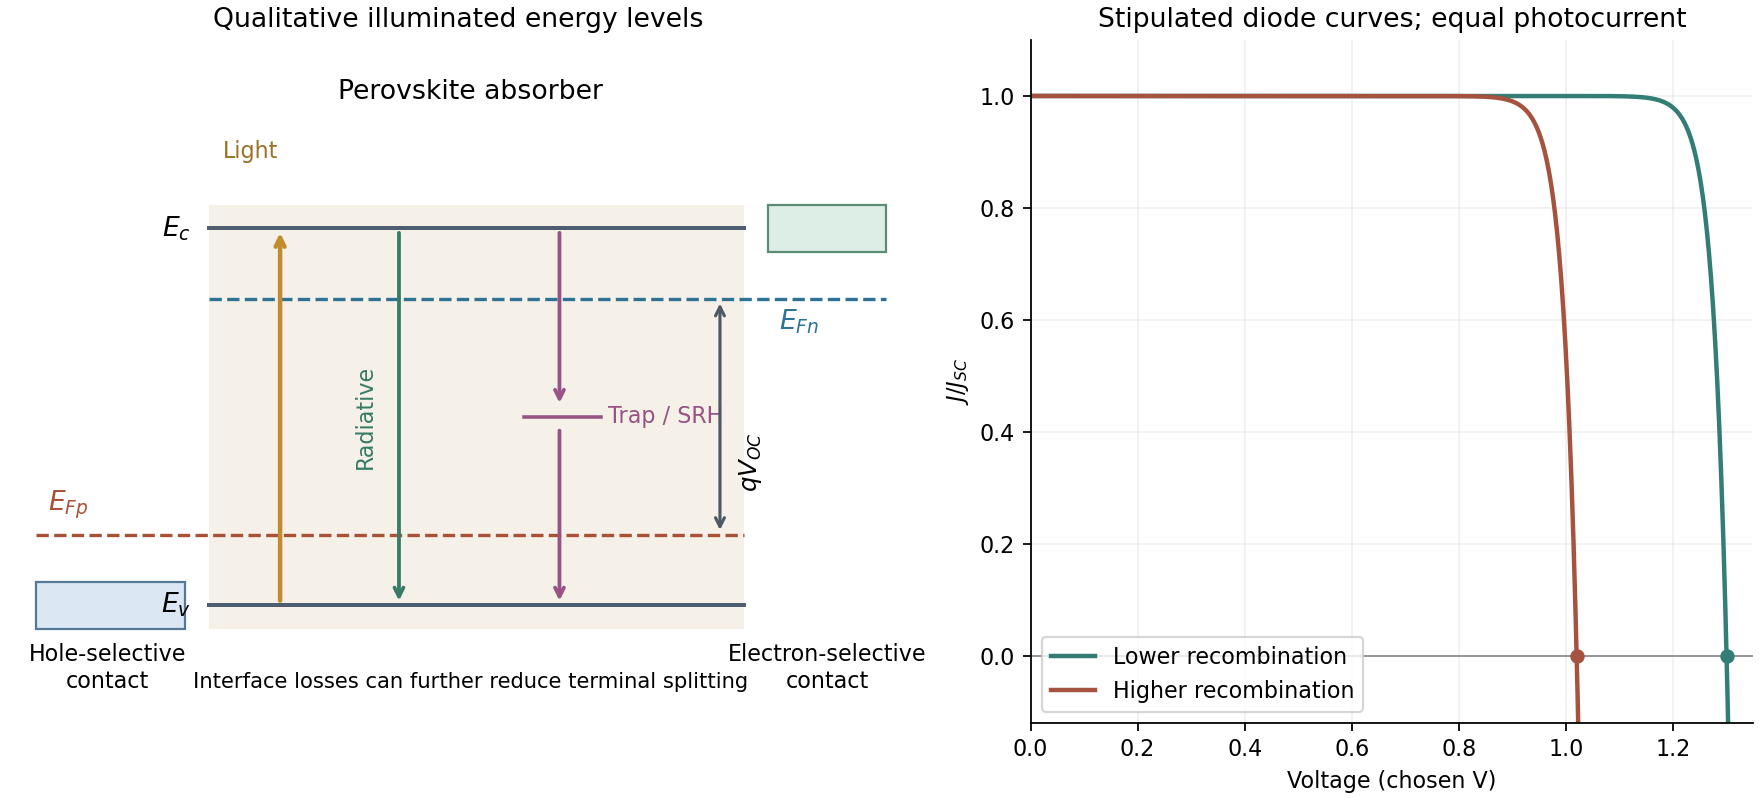
Selective extraction, quasi-Fermi splitting and recombination-limited solar-cell voltage
. Original qualitative energy diagram and stipulated illuminated diode curves. Trap-assisted and interface recombination reduce carrier splitting and open-circuit voltage. Band offsets, energy spacings and current scales are illustrative rather than fitted perovskite data. Details.
Important parasitic paths include trap-assisted Shockley-Read-Hall recombination in the bulk, at grain boundaries and at interfaces, and recombination at poorly selective contacts. They lower the steady carrier populations and their quasi-Fermi splitting. Auger recombination can matter at high carrier densities but need not dominate an ordinary one-sun device. Radiative recombination is an unavoidable detailed-balance contribution, rather than an avoidable defect loss of the same kind.
An approximate illuminated diode relation isIncreased nonradiative recombination generally increases the dark recombination current and reduces ; it can also change ideality and fill factor. Shunts add a leakage path. Series resistance mainly reduces voltage under load and fill factor: its simple drop vanishes at zero terminal current, so it should not be invoked as an automatic direct subtraction from open-circuit voltage.
The Shockley-Queisser limit is a radiative detailed-balance limit for a single-junction photovoltaic device under specified illumination and temperature. Its idealized absorber collects above-gap photons, thermalizes their excess energy and loses carriers only through the radiative processes required by absorptance and emission. Sub-gap photons are not harvested. A favorable gap balances current loss at large gap against voltage loss at small gap.[ref]
Detailed Balance Limit of Efficiency of p-n Junction Solar Cells by William Shockley and Hans J. Queisser. Journal of Applied Physics 32 (1961), pp. 510–519; radiative detailed balance and illumination assumptions
For a step-like absorber,The dark radiative current decreases rapidly with gap, so the qualitative ordering for the supplied absorbers isThe curve rises beneath the diagonal . The deficit reflects finite-temperature carrier statistics and the entropy associated with absorption and emission, including angular dilution of sunlight. Under ordinary unconcentrated illumination it is of order a few tenths of a volt, with a weaker gap dependence than itself. In a fixed blackbody-sun model its absolute value grows modestly with increasing gap, while its fraction of decreases. Above-gap thermalization is an efficiency loss but is not, by itself, the definition of this voltage deficit.
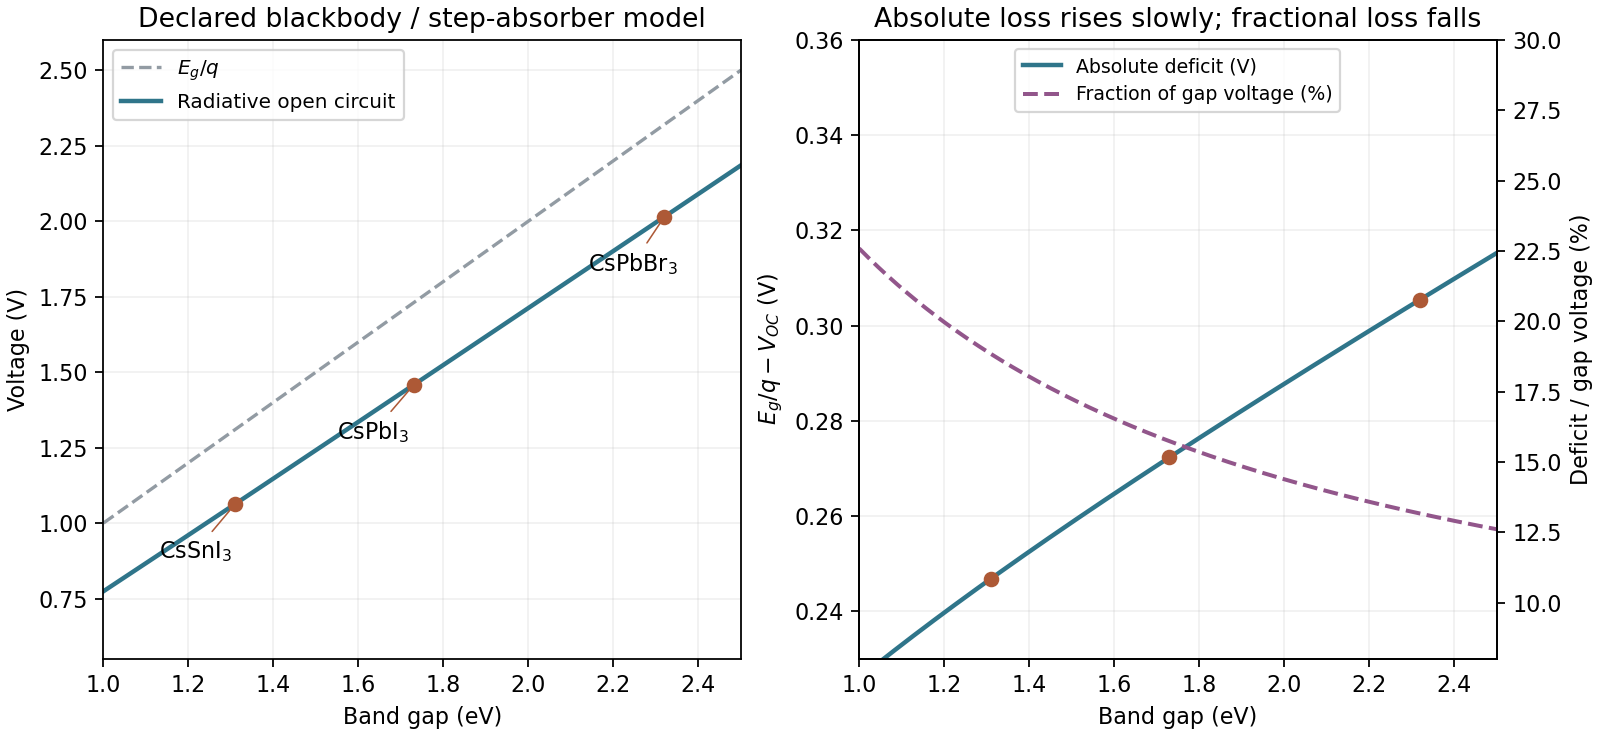

A measured perovskite device can have a larger deficit from nonradiative recombination and contact losses. The gaps alone do not determine those material-specific losses or a unique numerical voltage: solar spectrum, concentration, cell temperature and optical emission geometry must also be specified.
The material figure of merit isLarge thermoelectric power factor supplies electrical output, while low thermal conductivity limits heat leaking without useful conversion. For a constant-property ideal generator, a common approximation isIncreasing the appropriately averaged figure of merit raises efficiency toward, but not beyond, the Carnot limit. Actual devices also incur contact, geometric and heat-transfer losses, and a single peak material ZT does not specify their efficiency.
The supplied trends show the trade-off with carrier density: conductivity rises, the magnitude of the Seebeck coefficient tends to fall, and electronic thermal conductivity rises approximately with conductivity through the Wiedemann-Franz law. Thus neither arbitrarily high doping nor maximization of conductivity alone gives the best ZT; the power factor and thermal terms produce an intermediate optimum.
Two complementary strategies are:
- Reduce lattice thermal conductivity while preserving useful charge transport. Alloy disorder, grain boundaries and suitably designed nanoscale interfaces scatter phonons. Nanostructured bismuth–antimony telluride provides an experimental example in which microstructure and transport measurements supported reduced lattice heat conduction.[ref]High-Thermoelectric Performance of Nanostructured Bismuth Antimony Telluride Bulk Alloys by Bed Poudel and others. Science 320 (2008), pp. 634–638; grain-boundary/defect phonon scattering and enhanced ZT
- Improve the power factor through band engineering and carrier-density optimization. Band convergence increases useful valley degeneracy and can support a larger Seebeck coefficient without sacrificing conductivity as severely as a simple low-density strategy. Composition and doping tuning in lead telluride–selenide alloys demonstrated this route.[ref]Convergence of electronic bands for high performance bulk thermoelectrics by Yanzhong Pei and others. Nature 473 (2011), pp. 66–69; experimentally engineered valley convergence
Both strategies must be checked for mobility penalties and electronic heat transport. Simply suppressing every kind of transport would also suppress electrical output.
Articles by others on the same topic
There are currently no matching articles.