
Planned obsolescence Updated 2025-07-16
2019 cell phones are glued together with adhesive, which makes them impossible to repair them unless you have a heat gun, spend hours and hours learning and planning, and accept the risk of breaking the screen
Repairability scores: www.ifixit.com/smartphone-repairability
If you take a phone less than 300 dollars to a repair shop in the first world, they will say: I've never repaired this crap, and likely for the price of the repair you should just buy a new one, and so to the trash goes the old one, polluting the planet, and in comes a new one, enriching the manufacturer further.
Oh, there is some 2017 EU action actually: (archive) www.europarl.europa.eu/news/en/press-room/20170629IPR78633/making-consumer-products-more-durable-and-easier-to-repair
Life difficulty level meme Updated 2025-07-16

Library classification Updated 2025-07-16
Level: Asian Updated 2025-07-16
This is true. The level of competition in university entry exams in Asia in insane in the early 21st century compared to the West.
This is actually both good and bad. Good because it selects some very good exam passers. And bad because it selects some very good exam passers.
Leo Szilard Updated 2025-07-16

Leo Szilard: The Genius Behind the Bomb
. Source. 1992. TODO an external link to the production? Producers credited at end: Helen Weiss and Alain Jehlen. As indicated at: archive.org/details/TheGeniusBehindtheBomb it was apparently produced by WGBH, public radio station from Boston. Sass (stylesheet language) Updated 2025-07-16
The more of their syntax gets merged into mainline Cascading Style Sheets, the better the world will be.
Sal Khan Updated 2025-07-16
Like Jimmy Wales, he used to work in finance and then quit. What is it with those successful e-learning people??
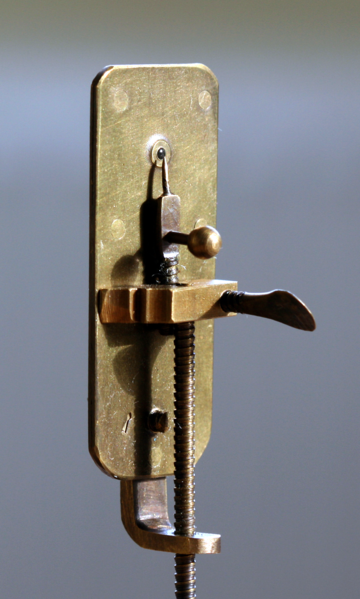
Leeuwenhoek microscope Updated 2025-07-16
Lebesgue integral Updated 2025-07-16
"More complex and general" integral. Matches the Riemann integral for "simple functions", but also works for some "funkier" functions that Riemann does not work for.
Ciro Santilli sometimes wonders how much someone can gain from learning this besides the beauty of mathematics, since we can hand-wave a Lebesgue integral on almost anything that is of practical use. The beauty is good reason enough though.
LaTeX Updated 2025-07-16
But too insane, and did not keep up with internet age, and so Ciro wants to kill it now.
Laplace transform Updated 2025-07-16
Saint Seiya Updated 2025-07-16
This was THE craze thing in Brazil before Pokemon, it was shown from 1994 to 1997. In particular the collectible action figures! It was possibly more popular in Brazil than e.g. in the US: www.quora.com/Why-was-Saint-Seiya-so-popular-in-Brazil
The thing as quite violent, rated for 14-year olds, but no one gave a fuck, 7 yo Ciro was happily watching it. We protect children too much.
That series also had quite a religious feel to it (as obviously suggested by the series English name itself). It must also have been a great motivator to getting young kids into astronomy!
Ciro's favorite character was definitely Andromeda Shun. He was smart and thoughtful, and had the coolest most complex weapon: his chain whips. He's also a bit effeminate, with his pink clothing and a gentle way. Perhaps that is the reason for adult Ciro's mild fascination with the Andromeda Galaxy.
The English name is horrendous... the Portuguese/French name is so much better: Knights of the Zodiac! Saying this in English just reminded Ciro Santilli of the Zodiac Killer. But nevermind.
Saccharomyces cerevisiae Updated 2025-07-16
Minimization project: en.wikipedia.org/wiki/Saccharomyces_cerevisiae#Synthetic_yeast_genome_project | syntheticyeast.org/
Ruth Lawrence Updated 2025-07-16
en.wikipedia.org/wiki/Ruth_Lawrence
When Lawrence was five, her father gave up his job so that he could educate her at home.
www.dailymail.co.uk/femail/article-3713768/Haunting-lesson-today-s-TV-child-geniuses-Ruth-Lawrence-Britain-s-famous-prodigy-tracked-father-drove-heard-troubling-tale.html
he had tried it once before - with an older daughter, Sarah, one of three children he had by a previous marriage.That experiment ended after he separated from Sarah's increasingly concerned mother, Jutta. He soon found a woman more in tune with his radical ideas in his next spouse, Sylvia Greybourne

Kondo effect Updated 2025-07-16
If you adda bit of impurities to certain materials, at low temperatures of a few Kelvin their resistivity actually starts increasing if you go below a certain critical temperature.

Kondo effect graph for gold with added impurities
. Source. 
Know Your Meme Updated 2025-07-16
KISS principle Updated 2025-07-16
The software engineer phrasing of simplicity is the ultimate sophistication.
Like all other principles, it is not absolute.
But it is something that you should always have on the back of your mind.
You aren't gonna need it is closely related, as generally the extra unnecessary complications are set in place to accommodate useless features that will never be needed.
Kingdom (biology) Updated 2025-07-16
Kinetic theory of gases Updated 2025-07-16
Theory that gases are made up of a bunch of small billiard balls that don't interact with each other.
This theory attempts to deduce/explain properties of matter such as the equation of state in terms of classical mechanics.
Kimchi Updated 2025-07-16
There are unlisted articles, also show them or only show them.