Linkage disequilibrium means that knowing an allele at one genetic locus changes the probability of an allele at another genetic locus in population haplotypes. It compares their joint probability distribution with the product of their marginal distributions. This is useful because a genetic marker can carry information about another genetic locus: tag SNPs exploit this redundancy, without establishing a causal genetic association.
Consider two genetic loci with alleles and . Sample one haplotype, rather than an unphased diploid genotype. Write its four haplotype frequencies as , summing to one, and set the marginal allele frequencies to and . The linkage disequilibrium coefficient isThe second expression follows by substituting . The entire two-locus joint probability distribution is thenEvery row and column sum is unchanged when varies. Linkage equilibrium means : all four haplotype frequencies equal products of allele frequencies, so the two allele indicators are independent random variables. For , the conditional probability shows directly how positive enriches among copies carrying , while negative depletes it. Positive also enriches ; negative enriches and . Swapping the labels and reverses the sign of , so neither sign is intrinsically favorable.
For example, fix the allele frequencies at . At linkage equilibrium, the haplotype frequencies in the order are . Positive linkage disequilibrium instead gives , with ; negative linkage disequilibrium gives , with . Counting each allele separately would miss the difference.
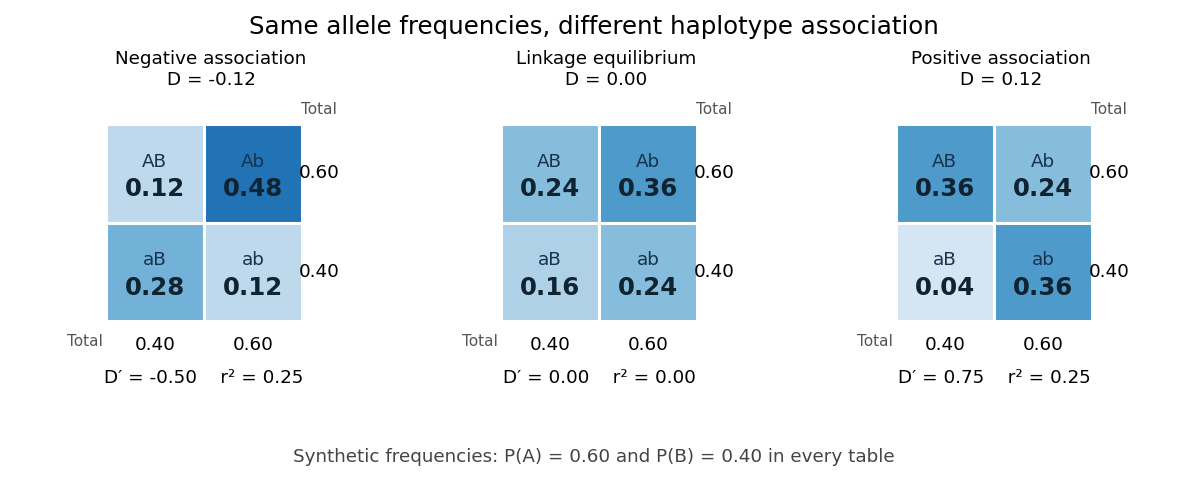
Three haplotype joint probability distributions with identical marginal allele frequencies, showing negative linkage disequilibrium, linkage equilibrium and positive linkage disequilibrium
. Details. 
Nonnegative haplotype frequencies constrain . Define the nonnegative bounds and . The four entries above giveThus globally, but a particular pair of allele frequencies usually permits a smaller, asymmetric interval. The standardized linkage disequilibrium convention used here retains the sign:This convention requires ; if either genetic locus has only one allele in the population, but normalized measures are undefined. Some presentations report only . At or , at least one of the four haplotypes has zero frequency; this alone does not prove that genetic recombination has never occurred.
For the indicator random variables and , their covariance is , and their variances are and . The allelic correlation measure is their squared correlation coefficient,The subscript distinguishes it from the recombination fraction in linkage-disequilibrium decay under recombination. Squaring loses the association's sign. In the illustrated positive and negative examples, in both, whereas and , respectively. For another original example, take : then , yet . Every carries , but most copies carrying lack . The frequency constraints and the distinction between these normalizations are analyzed in Mathematical properties of the r² measure of linkage disequilibrium by Jenna M. VanLiere and others (sections 2.1 and 2.5, pp. 131–132 and 135–136).
Genetic linkage describes transmission through meiosis; linkage disequilibrium describes a population's haplotype frequencies. Nearby genetic loci on a chromosome can be in linkage equilibrium. Conversely, mixing populations can create linkage disequilibrium even between genetic loci on different chromosomes. For example, mix equal numbers of independently sampled haplotypes from two populations, each internally at linkage equilibrium, with in one and in the other. The pooled allele frequencies are , but , giving . This is a consequence of population stratification, not a measurement of the recombination fraction.
Measured haplotype frequencies also depend on the sample. Finite sample size, related individuals, genetic-study ascertainment, genotyping error and uncertain haplotype estimation can change an estimate. A missing rare haplotype can give empirical without demonstrating its absence from the population. Report the sample definition and allele frequencies alongside the association measure; a nonzero sample estimate alone does not establish nonzero population linkage disequilibrium.
A concrete dataset is the 2005 A haplotype map of the human genome by The International HapMap Consortium. The International HapMap Consortium used genotyping platforms including Illumina BeadArray to obtain SNP genotype calls from 269 DNA samples across four collections: 30 parent–offspring trios from Ibadan, 30 trios from Utah, 45 unrelated individuals from Beijing and 44 from Tokyo. Parent–offspring trios and the PHASE algorithm supplied haplotype estimation, rather than direct observation of every chromosome. In Figure 7, 36 SNPs resolve seven haplotypes in a chromosome 2 region in the Utah panel; seven tag SNPs capture the 36 SNPs at . The readout demonstrates reusable allelic correlation, not causal effects.
Controls required over 80% complete calls, at most one discordance among five duplicate genotypes, at most one Mendelian segregation error per trio panel, and a Hardy-Weinberg equilibrium test with ; blind reassessment checked performance. Minor allele frequencies of at least 0.05 were targeted, the collections were not population-representative, and inferred haplotypes retain phase uncertainty. These limits restrict extrapolation of linkage disequilibrium.[ref]
A haplotype map of the human genome by The International HapMap Consortium. pp. 1300–1302, Table 1; Figure 7, p. 1306; Methods, p. 1316
Let the four haplotype frequencies sum to one and define . Recombination at rate removes the excess association: and . Marginal allele frequencies are unchanged. Hence generates more , whereas removes it; a claim that recombination always increases this combination is false.
For two genetic loci with two alleles each, linkage equilibrium is independence of their states on sampled haplotypes. It concerns association between genetic loci; Hardy-Weinberg equilibrium concerns pairing of alleles into diploid genotypes.
For positive linkage disequilibrium , take ; for negative , take and retain its negative sign in . Thus . Its magnitude measures the fraction of the largest disequilibrium possible at the specified allele frequencies. High need not imply high allelic correlation, so it does not alone guarantee good marker prediction.
Genetic recombination erodes linkage disequilibrium by reshuffling alleles between haplotypes, while preserving marginal allele frequencies in the idealized model. Let denote the haplotype frequency in the gamete pool of generation , let denote its marginal allele frequencies, and let be the constant recombination fraction between two autosomal genetic loci. Assume random mating within one population, nonoverlapping generations, fair Mendelian segregation, equal reciprocal gamete production, the same in both sexes, and a deterministic population large enough to neglect genetic drift. Exclude natural selection, mutation and gene flow. ThenHere and remain constant: recombining changes which alleles occur together, not their total numbers. The other haplotype frequencies change by for and for . Consequently the joint probability distribution stays within its allowed bounds and approaches the product of its marginal distributions when .
For the original positive example , a recombination fraction gives and . The negative example has exactly the opposite sequence: genetic recombination reduces the magnitude without reversing the sign. With , the initial linkage disequilibrium persists in this model; even independent assortment at only halves each generation. A population association does not vanish after one generation merely because the genetic loci are unlinked.
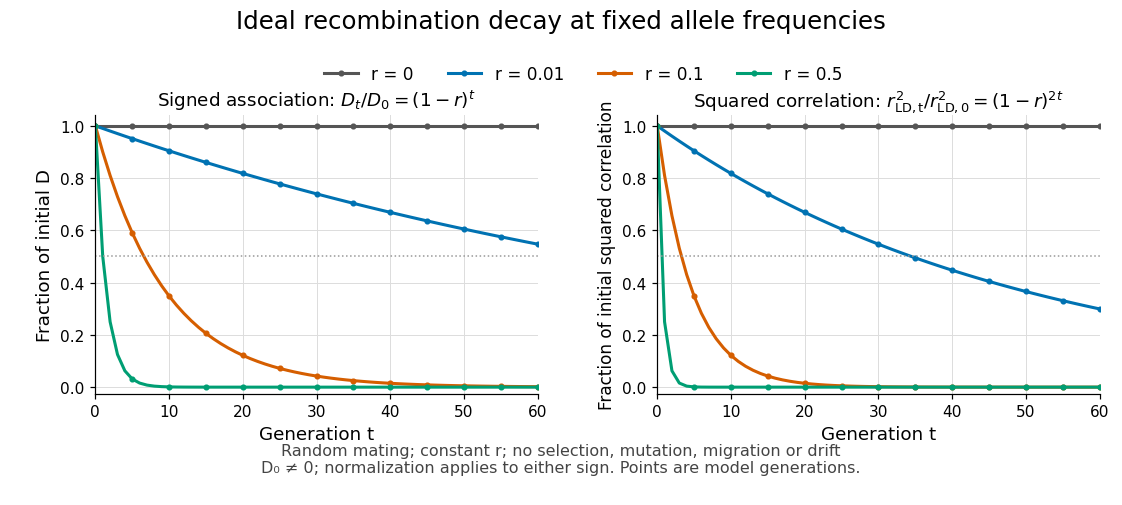
Idealized linkage-disequilibrium decay under recombination at four recombination fractions, with faster decay of squared allelic correlation when marginal allele frequencies remain fixed
. Details. 
The geometric sequence gives a generation scale: for , the continuous interpolation reaches at . Actual generations are integers; the first at or below half is . For small , . Because the denominator of allelic correlation stays fixed, ; its decay is faster than the magnitude of .
A short derivation uses random mating to assign frequency to the double heterozygote and to . Relative to , each loses or gains an gamete fraction , respectively. Their net contribution is . The other genotypes produce no net change in , proving the recurrence and, by iteration, its solution.
This temporal model does not identify elapsed generations from physical separation alone. The recombination fraction depends on genetic recombination, including recombination hotspots, while population stratification, natural selection, gene flow or genetic drift can create or maintain linkage disequilibrium. Repeated sampling across time would also require accounting for sample size and haplotype estimation. A cross-sectional plot of association against distance between genetic loci is therefore a different observation from the idealized trajectory plotted here.
For two segregating biallelic loci, encode the allele on a random population haplotype by indicator variables . Their covariance is the linkage disequilibrium coefficient . The squared correlation is , between zero and one. It measures how well one marker predicts the other and is undefined if either marker is monomorphic.
// Target: biology.bigb
Articles by others on the same topic
There are currently no matching articles.