Genetics studies how genes are inherited, how their alleles vary, and how that variation contributes to phenotypes. Its central distinction is between an inherited description, the genotype, and what an organism actually expresses, the phenotype. Following alleles through a pedigree answers a family-level question; following allele frequencies through generations leads to population genetics and evolution.
The beauty of Mendelian segregation is that discrete inherited copies can generate predictable statistical patterns without making every offspring identical. A single genetic locus already connects meiosis, probability and observable variation. The Hardy-Weinberg principle then supplies a population baseline: it separates reshuffling inherited copies from processes such as natural selection that change their frequencies. These simple models are useful precisely because their assumptions can be stated and checked.
A biological strain is a maintained variant or lineage within a species. Naming the species alone does not specify a laboratory genotype or its genetic background.
The genetic background is the rest of the genotype against which a focal allele or gene deletion is studied. Other genes can influence the resulting phenotype, so comparisons should specify which background is held fixed.
Functional complementation is restoration of a specified function or phenotype by introducing a gene into a deficient recipient. In the yeast cross-species complementation experiment, the restored property is growth without supplied methionine, under the assay conditions. Rescue need not restore every property of the original genotype.
A plasmid is an extrachromosomal DNA replicon: genetic material maintained by DNA replication separately from the host's main chromosomes. Separate copying does not mean independence of the host's enzymes or resources. Many plasmids are circular, but naturally occurring linear plasmids also exist.[ref]
Conservation of plasmid maintenance functions between linear and circular plasmids in Borrelia burgdorferi by Philip E. Stewart and others. Stewart, Chaconas and Rosa (2003), abstract opening sentence: natural linear and circular plasmids
Engineered plasmids can carry genes for genetic transformation and functional complementation. Typical laboratory plasmids combine an origin of replication, a selectable marker and a plasmid insert. These are engineering roles, not requirements that every natural plasmid carry an experimentally chosen selectable marker or plasmid insert.[ref]
Molecular Biology Reference by Addgene. Plasmid Elements, Figure 2 and table: origin, antibiotic-resistance gene, insert and promoter; description applies to engineered vectors
The useful separation is between keeping a DNA fragment, finding its carriers and testing its function. Molecular cloning uses propagation to recover more copies for study. Plasmid restriction mapping tests a proposed arrangement, while DNA sequencing examines its letters. A successful genetic transformation or a biological colony showing antibiotic resistance answers neither question completely. The yeast cross-species complementation experiment goes a step further by separating plasmid selection from a test of functional complementation.
A plasmid feature map records the positions of specified DNA features. Construct an original circular example of total length base pairs. Coordinates run clockwise from a chosen zero, and and label the same boundary. Positions here denote boundaries between base pairs, so the interval from 1000 to 2500 contains base pairs. This convention avoids counting both endpoints as additional material.
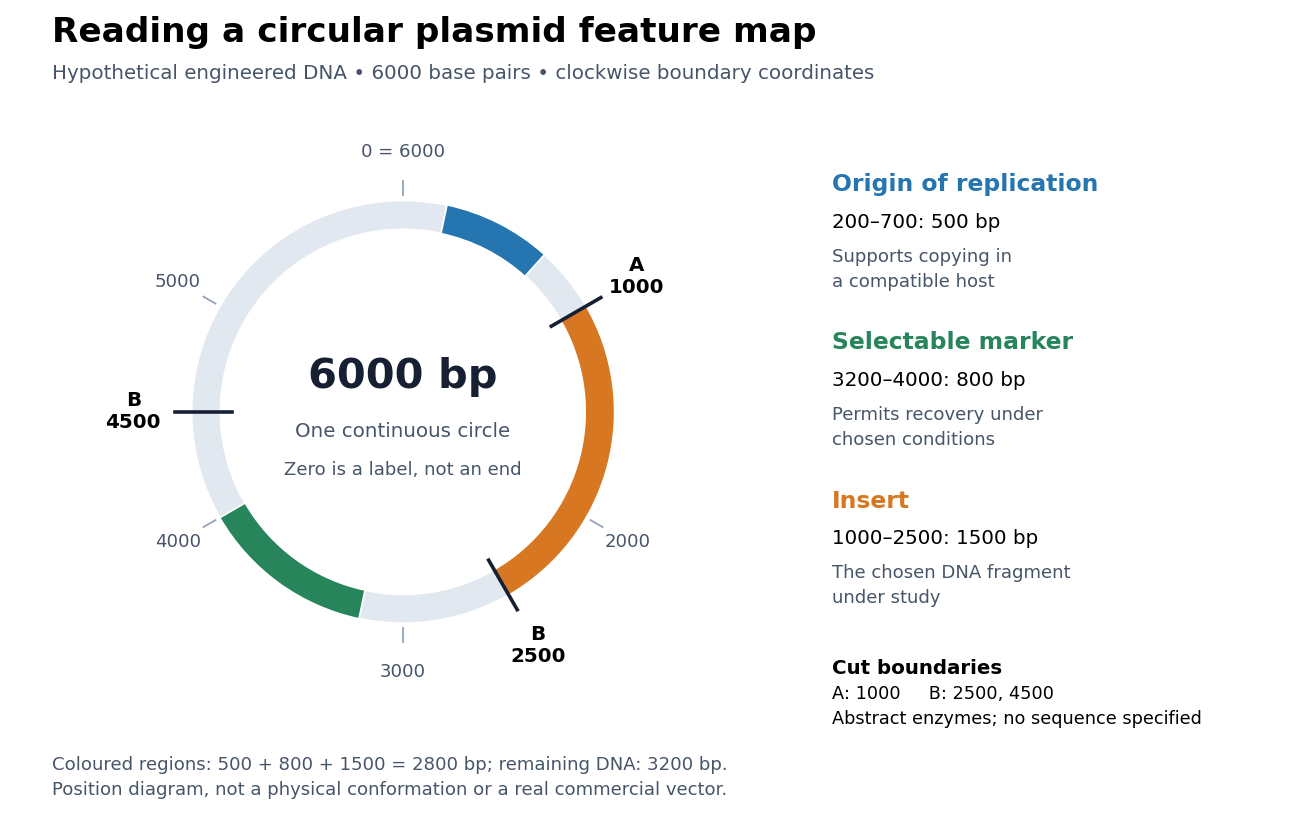
An original 6000-base pair plasmid feature map: copying, selection and a chosen plasmid insert occupy distinct regions
. Hypothetical engineered circular DNA, with clockwise boundary coordinates. Blue marks an origin of replication at 200–700; green marks a selectable marker at 3200–4000; orange marks the plasmid insert at 1000–2500. Abstract restriction enzymes A and B cut at the labelled boundaries: A at 1000; B at 2500 and 4500. Their recognition nucleotide sequences are unspecified. Neither the feature intervals nor the total length describe a real commercial construct. The ring records position, not the physical shape or three-dimensional conformation of DNA. Details.The origin of replication is assigned to 200–700, the selectable marker to 3200–4000 and the plasmid insert to 1000–2500. Other positions are unspecified DNA, not empty gaps. Their lengths account for the entire circle:The first three terms are the marked regions; the last is all remaining material. Choosing a coordinate zero does not add a physical break. Rotating every coordinate by the same amount changes the drawing's labels without changing any distance around the plasmid.
A gene promoter must function in the recipient for the intended gene expression; copying a plasmid alone does not establish gene expression.[ref]
Molecular Biology Reference by Addgene. Plasmid Elements, Promoter Region row: recipient-dependent transcriptional machinery
The map therefore supports three separate questions: can the carrier persist, can carriers be recovered, and can the selected DNA perform the proposed task? The galactose induction comparison illustrates the third question in an actual yeast experiment.A plasmid insert is the DNA fragment added to a carrier plasmid during construction. In the plasmid feature map, its stipulated boundaries are 1000 and 2500, giving 1500 base pairs. The label identifies a construction role; it does not establish gene expression or functional complementation.
Plasmid restriction mapping compares fragment lengths after a restriction digest with the pattern predicted by specified cut positions. Use the original 6000-base pair plasmid feature map. Abstract restriction enzyme A cuts once, at 1000. Abstract restriction enzyme B cuts twice, at 2500 and 4500. Assume complete cutting of identical circular copies at exactly those sites, with no loss of DNA. These assumptions define a length-accounting exercise; the labels A and B do not stand for particular commercial enzymes.
| Complete restriction digest | Cut coordinates | Linear fragment lengths in base pairs |
|---|---|---|
| A | 1000 | 6000 |
| B | 2500, 4500 | 2000, 4000 |
| A and B | 1000, 2500, 4500 | 1500, 2000, 2500 |
For the combined restriction digest, successive clockwise distances areand the final fragment crosses the chosen zero:Their sum is . The single A cut opens the circle into one full-length linear fragment. It does not produce pieces of lengths 1000 and 5000, because coordinate zero was never an end.
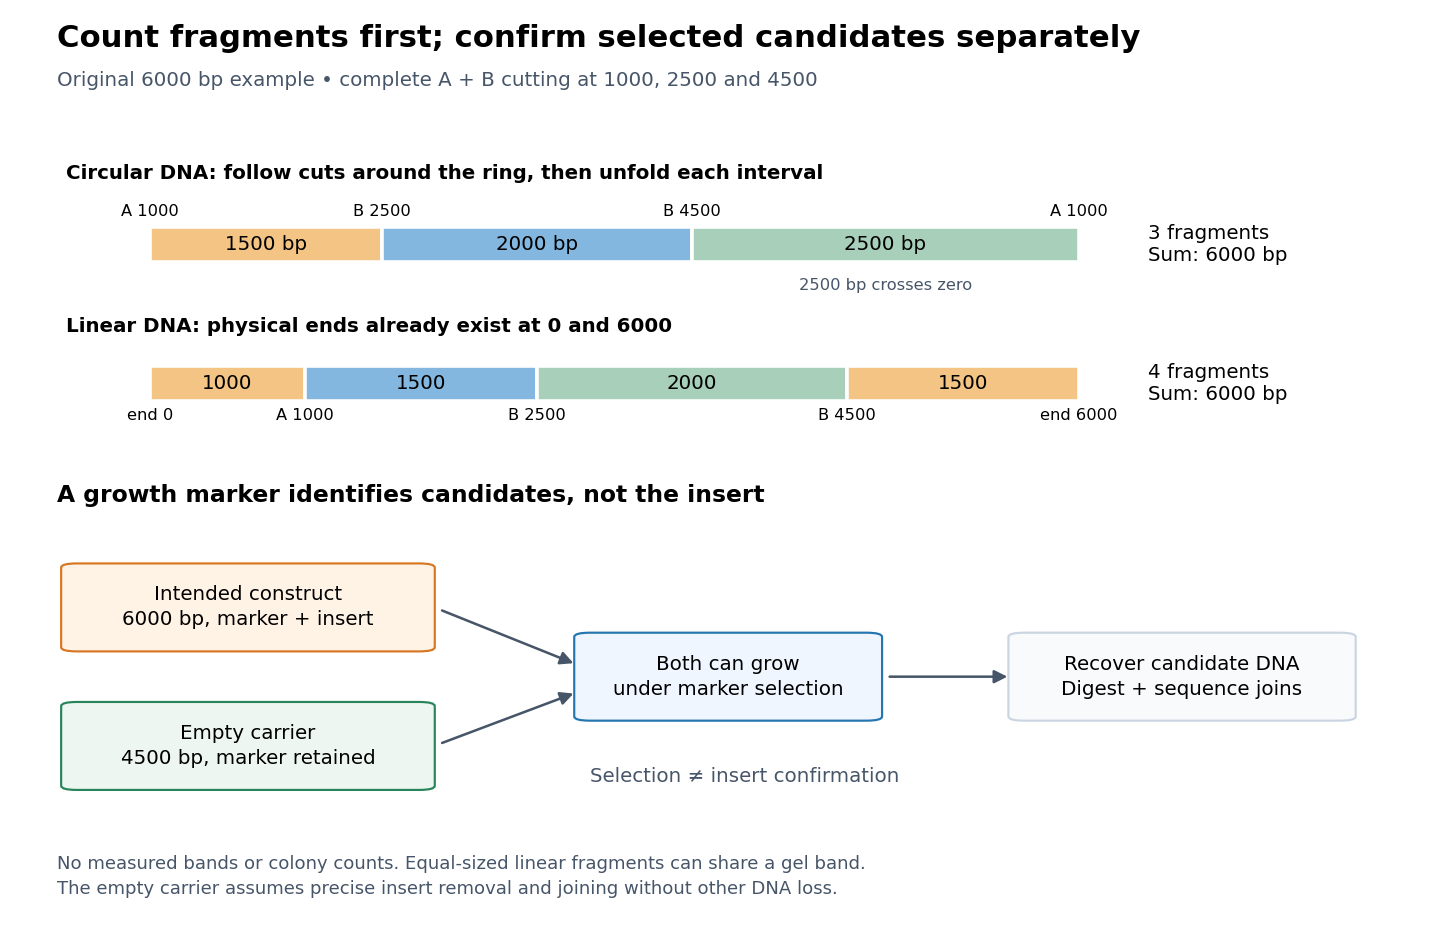
Plasmid restriction mapping counts physical ends; plasmid selection and confirmation answer different questions
. Original length-accounting and inference schematic for the same 6000-base pair construction. The upper strips compare complete A-and-B cutting of the circle with cutting of a separate linear DNA substrate that already has physical ends at 0 and 6000. The lower branches show that the selectable marker can permit recovery of both an intended construct and an empty carrier. No biological colony counts, experimental efficiencies, measured gel bands or historical data are depicted. Details.For contrast, stipulate a different starting substrate: a linear 6000-base pair DNA fragment with physical ends at 0 and 6000 and the same three internal cut coordinates. Its complete restriction digest givesbase pairs, summing again to 6000. There are four fragments, including two of equal length. Even an ideal length-resolving comparison would show only three distinct sizes if both 1500-base pair fragments occupy the same gel band. Fragment number and visible gel band number need not agree.
The general counting argument is short. For distinct complete cuts of a circle, each fragment runs from one cut to the next, so there are fragments. For a linear substrate with distinct internal cuts, its two pre-existing ends give intervals. Summing successive distances counts every original base pair once in either case. The rule assumes internal double-strand cuts and does not treat an uncut circle as a zero-length product.
In practice, compare released linear fragments with an appropriate DNA ladder using agarose gel electrophoresis. The original uncut circular DNA need not migrate like a linear fragment of equal length; the existing agarose gel electrophoresis discussion explains that shape-dependent limitation. Partial cutting also changes the expected pattern. In this example, a circular copy cut at 1000 and 2500 but not 4500 yields lengths 1500 and 4500. A 4500-base pair product would therefore be compatible with that missed cut rather than uniquely identifying a different construction.
Matching lengths constrain an arrangement without determining every nucleotide sequence. For example, any change of letters preserving all three cut positions leaves this predicted pattern unchanged. Even the order of fragments can be ambiguous when only their unordered lengths are observed. DNA sequencing across both joins and through the plasmid insert tests additional claims that this length model cannot decide.
In his account of the 1973 work, Stanley Norman Cohen describes purified R6-5 plasmid DNA cut with EcoRI, reassociated and joined by DNA ligase. The mixture entered calcium chloride-treated Escherichia coli; plates containing antibiotics selected biological colonies showing antibiotic resistance. The recovered pSC102 carried three R6-5 fragments and kanamycin antibiotic resistance. The team then joined material from pSC102 to the carrier pSC101 providing tetracycline antibiotic resistance, recovering pSC105 with both forms of antibiotic resistance.[ref]
DNA cloning: A personal view after 40 years by Stanley Norman Cohen. Cohen (2013), The Hawaii Meeting and the Initial DNA Cloning Experiments, Figure 2 and Figure 3 caption; pSC102, pSC101 and pSC105 identities
Stained agarose gel electrophoresis, gradient centrifugation and electron microscope comparisons characterized recovered plasmids. Parental and mixture lanes in Figure 3 supplied fragment comparisons; pSC101 alone gave one EcoRI fragment, while pSC105 combined its carrier fragment with the resistance-bearing fragment. This supported joined, propagating genetic material beyond selection alone. The comparisons did not determine every nucleotide sequence or establish a universal construction efficiency.[ref]
DNA cloning: A personal view after 40 years by Stanley Norman Cohen. Cohen (2013), paragraphs describing the two laboratories' analyses and Figure 3, top and bottom: parental, mixed and recovered DNA comparisons
The interesting inference combines two kinds of evidence: a recoverable phenotype identifies descendants worth examining, and the extracted DNA tests a structural explanation. The fragment comparisons are molecular scientific controls; they answer a different objection from a control for background growth. The hypothetical diagrams here illustrate that logic without reproducing the historical fragment lengths or biological colony counts.
Genetic transformation introduces DNA into recipient biological cells. It can change their genotype and sometimes their phenotype; the yeast cross-species complementation experiment separates detecting introduction of a plasmid from detecting its functional effect.
Plasmid selection and confirmation separate recovering candidates from establishing what they contain. In an original idealized comparison, stipulate a susceptible recipient and a selectable marker that permits growth under the chosen condition. The intended 6000-base pair construction and an empty carrier retaining that marker can both yield biological colonies. If removal of the 1500-base pair plasmid insert followed by DNA ligation joins its two boundaries without losing other material, the empty carrier is base pairs. Selection for their shared selectable marker cannot distinguish these candidates.
Use separate scientific controls for separate uncertainties. A recipient-only comparison tests background growth under selection. A known intact plasmid tests whether recipient preparation, genetic transformation and recovery can yield selected carriers. A carrier-only construction comparison tests recovery in the absence of added plasmid insert. Growth on supporting cell culture medium tests viability under that supporting condition. These are analytical comparisons for the constructed example, not a list claimed to have been performed in the 1973 plasmid construction experiment.
Recover candidate DNA, compare a complete restriction digest with the stipulated pattern, and inspect relevant joins by DNA sequencing. Each step narrows the claim: selection supports a growth phenotype; length comparison supports size and some structural features; DNA sequencing tests the letters sampled. Even a confirmed nucleotide sequence does not alone show the intended biological function. That requires an appropriate readout such as functional complementation, with its own scientific controls and recipient genetic background.
Replica plating transfers samples from corresponding biological colonies or patches to several growth conditions while preserving their spatial arrangement. A master plate makes it possible to relate growth or failure at one location to the same source population on another plate.
The master preserves the source biological colonies; each replica tests a sample of their biological cells. A fabric carrier takes one spatial impression from the master and deposits samples onto fresh plates. Different cell culture medium formulations can then reveal different growth phenotypes at corresponding sites. The carrier copies locations, not a guaranteed number of biological cells. Replica plating spatial correspondence therefore lets an investigator connect a readout to a recoverable source without treating every empty replica site as a missing master biological colony.
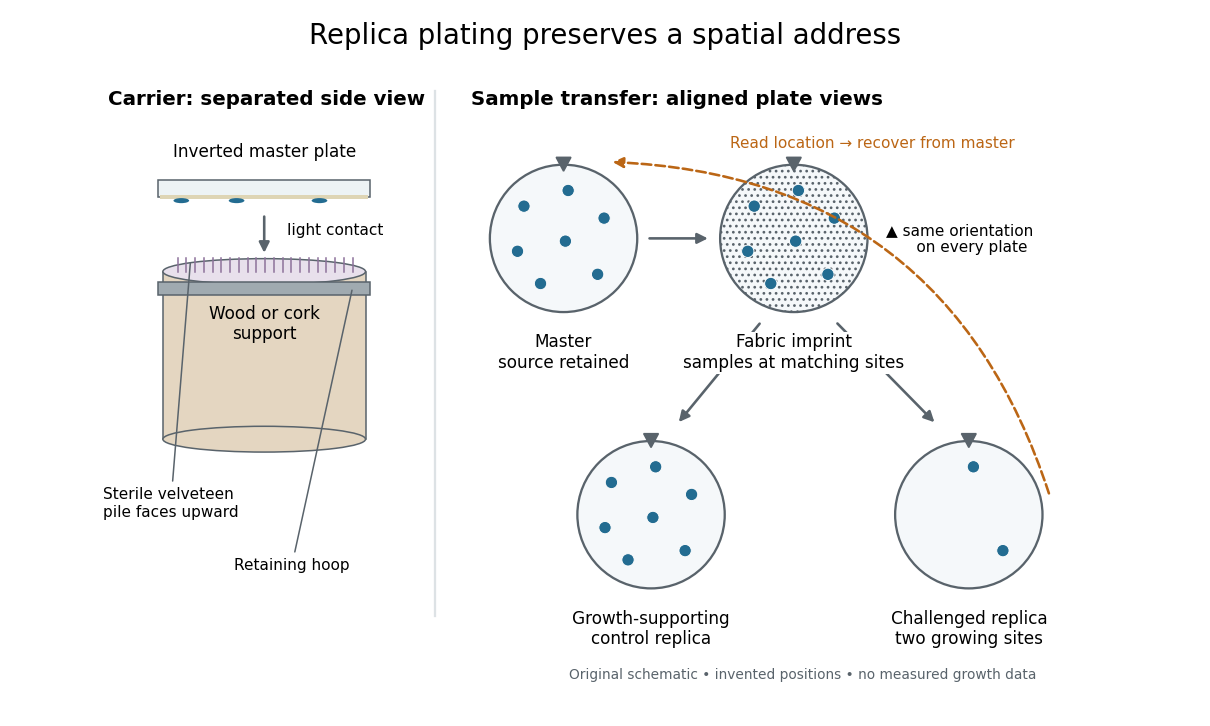
The useful trick is that a destructive or growth-restricting test can interrogate one sample while another remains available. In indirect selection of bacterial mutants, the replica supplies information about which source to recover. This also makes a failure-to-grow phenotype accessible: a missing replica biological colony cannot be picked, but its source may still be present on the master. Matching positions is the bridge between testing and retrieval.
Replica plating spatial correspondence is the preserved association between a master site and its sampled sites on replicas. Label a master site by an ordered pair , specifying its row and column. Keeping the same orientation and viewing convention makes that label refer to the same source on every plate. The biological colonies need not have identical outlines, because the transferred samples can contain different numbers of biological cells.
A simple orientation check shows why a circular outline is insufficient. In a constructed four-by-four layout, a half-turn sends to . Thus B2, or , would be confused with C3, or . Applying the half-turn twice returns the original ordered pair, but applying it once generally selects the wrong source. An asymmetric orientation mark fixes that ambiguity. Two contact transfers also preserve the handedness when all plates are viewed from the same side: any reflection in going from plate to fabric is undone in going from fabric to plate. A fabric-side view must not be silently substituted for a plate-side view.
Joshua Lederberg and Esther Lederberg reported replica plating in 1952. They autoclave-sterilized velveteen and secured it pile-up on a wood or cork cylinder with a metal hoop. Inverted agar plates touched the fabric lightly. Pencil marks or pin indentations fixed orientation. Complete-medium and minimal-medium replicas compared growth of biological colonies.[ref]
Replica plating and indirect selection of bacterial mutants by Joshua Lederberg and Esther Lederberg. pp. 399–402, Methods: Replica plating; Figure 1 caption; Results: plate orientation
Escherichia coli W-1 grew on plain agar; serial T-1 bacteriophage replicas showed resistant biological colonies at matching sites. Corresponding unexposed master regions seeded repeated broth-and-plain-agar enrichment, yielding resistant isolates. Stray-bacteriophage checks were negative; resistance persisted without challenge. This supported preexisting heritable resistance. The authors noted variable transfer and moisture-dependent resolution.[ref]
Replica plating and indirect selection of bacterial mutants by Joshua Lederberg and Esther Lederberg. pp. 401–403: transfer variability, Clonal occurrence of phage resistant mutants, Indirect selection and stray-phage checks; p. 404, Discussion
The Luria-Delbrück experiment uses variation between independently grown cell cultures to investigate the timing of resistant mutations. The Lederberg replica plating experiment adds a spatial route to a recoverable source: the tested samples identify an unexposed lineage. These are complementary arguments about mutation and natural selection. Growth readouts establish a tested phenotype; identifying the responsible nucleotide sequence requires other evidence, such as DNA sequencing.
Replica plating controls distinguish a growth phenotype from failure of the copying process. A replica on a cell culture medium that supports the starting biological colonies is a touch-transfer scientific control: growth at a site demonstrates that viable biological cells reached that control site. If a source is visible on the master but absent on both control and restrictive replicas, the restrictive readout is unresolved. If it grows on the control but fails on the restrictive replica, the difference is a candidate condition-dependent phenotype.
The touch-transfer scientific control still cannot guarantee transfer to every other replica. A known growing comparison on the restrictive cell culture medium, repeat sampling, and retesting a recovered source address different possible failures. Likewise, an orientation mark checks which source a site represents; it cannot check whether any biological cells arrived. Gentle, aligned contact helps preserve the map. In Investigations in Molecular Cell Biology by Clare M. O’Connor, section 12.6: Exercise 2 - Replica plating and complementation, the instructions align master and carrier marks and call for light, even contact.[ref]
12.6: Exercise 2 - Replica plating and complementation. Investigations in Molecular Cell Biology by Clare M. O’Connor; Introductory light-touch instruction and steps 1–2: orientation marks, aligned inversion and gentle even contact
For indirect selection of bacterial mutants, keep the recovery route on the unexposed master. Returning a carrier that has touched a challenged replica to that master would introduce a possible exposure route. The original experiment's stray-bacteriophage check addresses contamination of the retained lineage, while the orientation and touch-transfer scientific controls address spatial identity and successful sampling. These questions must be checked separately.
Indirect selection of bacterial mutants recovers a source using a related sample's tested phenotype, rather than directly challenging the retained lineage. A positive example uses a surviving replica biological colony to locate its unexposed source. A negative example uses failure to grow in one condition to locate a source that does grow elsewhere. The second is particularly useful for finding auxotrophy: dependence on an externally supplied nutrient.
Construct a four-by-four teaching layout with rows A–D and columns 1–4. The master has 13 biological colonies; A4, D1 and D4 are empty. A growth-supporting control replica grows at every occupied master site except B2 and C3. A replica lacking an assumed nutrient X grows at those same control sites except A2 and C1. All other requirements are stipulated equal. These are invented readouts, not observations from the Lederberg replica plating experiment.
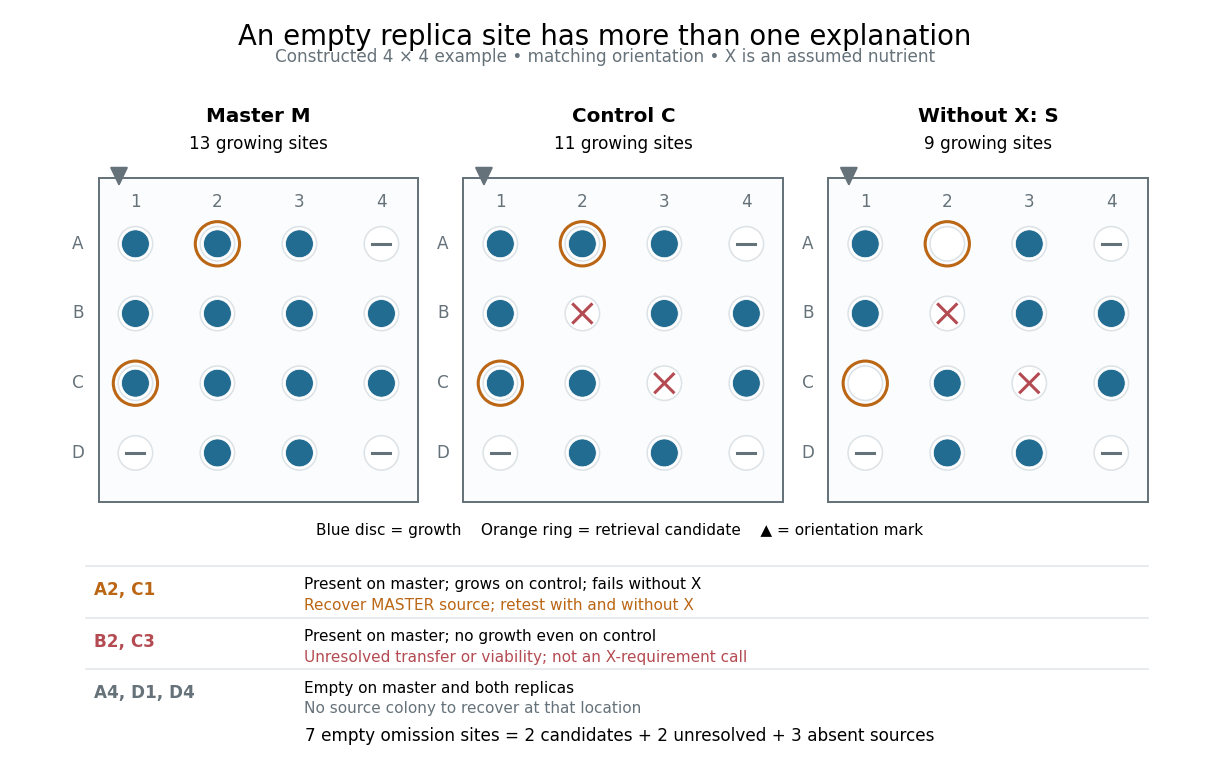
An original replica plating map separates retrieval candidates, unresolved transfer and absent sources
. Constructed four-by-four master, control and nutrient-X-omission readouts, viewed in the same orientation. Blue discs mean growth. Orange rings identify A2 and C1 for recovery from the master. Red crosses mark B2 and C3, which lack growth even on the control; gray dashes mark positions empty on the master. The lower comparison distinguishes these three explanations of an empty restrictive-replica site. No measured data or published plate illustration is reproduced. Details.Let , and be the finite sets of sites with growth on the master, control and X-omission replica respectively. In this construction , with cardinalitiesThe set differencecontains the two condition-dependent candidates. Pick from A2 and C1 on the master, then compare fresh samples of each recovered source with and without X. Restoration of growth when X is supplied supports an X-requirement phenotype, subject to the scientific controls; growth alone does not identify a particular gene or mutation.
By contrast,is unresolved sampling or viability in this first comparison. Neither site should be counted as an X-requirement candidate. The three sites outside have no master source to recover at all. The short logical argument is membership testing: a candidate must belong to , establishing control growth, and not belong to , establishing the contrasting readout. Being outside alone supplies only the second condition. Among the seven empty X-omission sites, two are candidates, two are unresolved and three have no master source. The beauty of the method is that a shared location turns this logical distinction into a practical retrieval route.
A genome is the complete set of genetic information under discussion. For a cellular organism it is encoded in DNA, including genes and other sequences. Specify whether a comparison concerns a nuclear genome, a mitochondrion's genome or all cellular genetic material: the cell nucleus does not contain every DNA sequence in a typical eukaryote. See NHGRI: genome.
Locating genetic markers or other features within a genome. Physical positions use DNA sequence distances, while linkage maps use genetic recombination frequencies.
DNA sequencing determines the order of nucleotide bases in DNA. Sequence data can test molecular rearrangements, as in the functional plastid-to-nucleus gene transfer experiment, or support phylogenetics after a suitable sequence alignment.
An ordered nucleotide sequence answers a different question from fragment size. The eight-nucleotide strands ACGTTAGC and AACCGGTT have equal lengths and identical counts of adenine, cytosine, guanine and thymine, yet different orders. A length-compatible gel band therefore cannot identify either strand by itself. Sanger sequencing makes length informative by deliberately coupling each stopping position to the identity of its last added nucleotide.
That coupling is the beautiful experimental idea: convert an invisible order into a collection of ordered endpoints. Sanger ladder reading recovers the newly synthesized strand; base pairing and the reverse complement then connect that readout to the original template. The distinction also matters when checking a mutation: a reliable local nucleotide sequence supports a particular molecular change, while its effect on a phenotype requires additional evidence.
Sanger sequencing determines a DNA nucleotide sequence by extending a common sequencing primer and occasionally incorporating a dideoxynucleoside triphosphate. A normal deoxynucleoside triphosphate already has hydrogen in place of a hydroxy group; it retains the hydroxy group. A dideoxynucleoside triphosphate lacks that hydroxy group too. It can join the growing strand because the preceding nucleotide supplies the reacting hydroxy group. Once incorporated, its own end cannot form the next phosphodiester bond. Thus the blocked step is the next addition, not attachment of the terminator itself.[ref]
Isolating, Cloning, and Sequencing DNA. Alberts and others, Molecular Biology of the Cell, 4th edition (2002), Isolating, Cloning, and Sequencing DNA, Figure 8-36 and accompanying dideoxy-method explanation
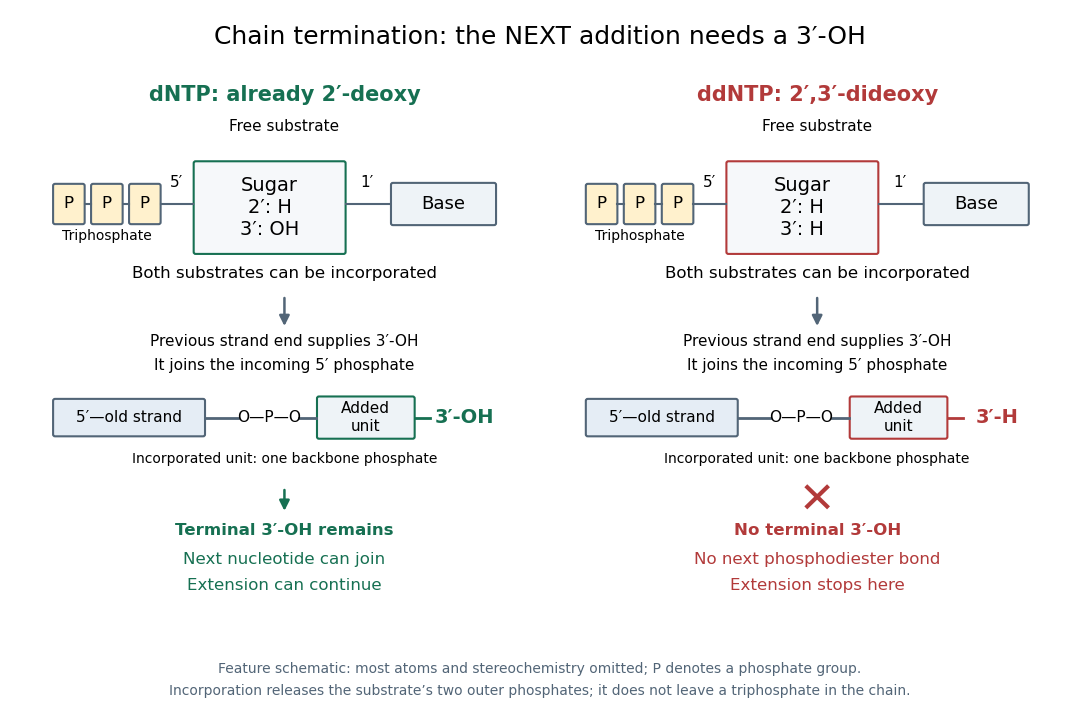
In the historical four-reaction format, each tube receives copies of the same template, the same sequencing primer, a DNA polymerase and all four ordinary deoxynucleoside triphosphates. The tubes differ in their terminating substrate: ddATP, ddCTP, ddGTP or ddTTP. In the A reaction, ordinary dATP can allow copying to continue past one A position, whereas incorporation of ddATP stops another copy there. Competition produces a family of endpoints, rather than every strand stopping at the first A. Adjusting substrate proportions makes later endpoints detectable. A lane identifies the terminating nucleobase in the new strand, not the complementary template letter.[ref]
Sequencing Genomes. T. A. Brown, Genomes, 2nd edition (2002), section 6.1.1, Chain termination sequencing in outline
The readout requires gel electrophoresis capable of separating single-stranded DNA fragments differing by one nucleotide. Historical denaturing polyacrylamide gel electrophoresis suppressed strand folding and resolved these adjacent lengths; radioactive labels were detected by autoradiography. An ordinary agarose gel electrophoresis comparison with a 100-base pair DNA ladder does not supply that resolution. Four separate reaction lanes carry the identities in this format.[ref]
Consider an original teaching template whose next eight positions, encountered after the sequencing primer, areThe sequencing primer binds an upstream region omitted from this display; the template also continues beyond the eight positions shown. DNA polymerase encounters the displayed template from left to right. Applying base pairing at each successive position gives the extensionThese eight letters are added material, not the entire primer-containing DNA molecule.
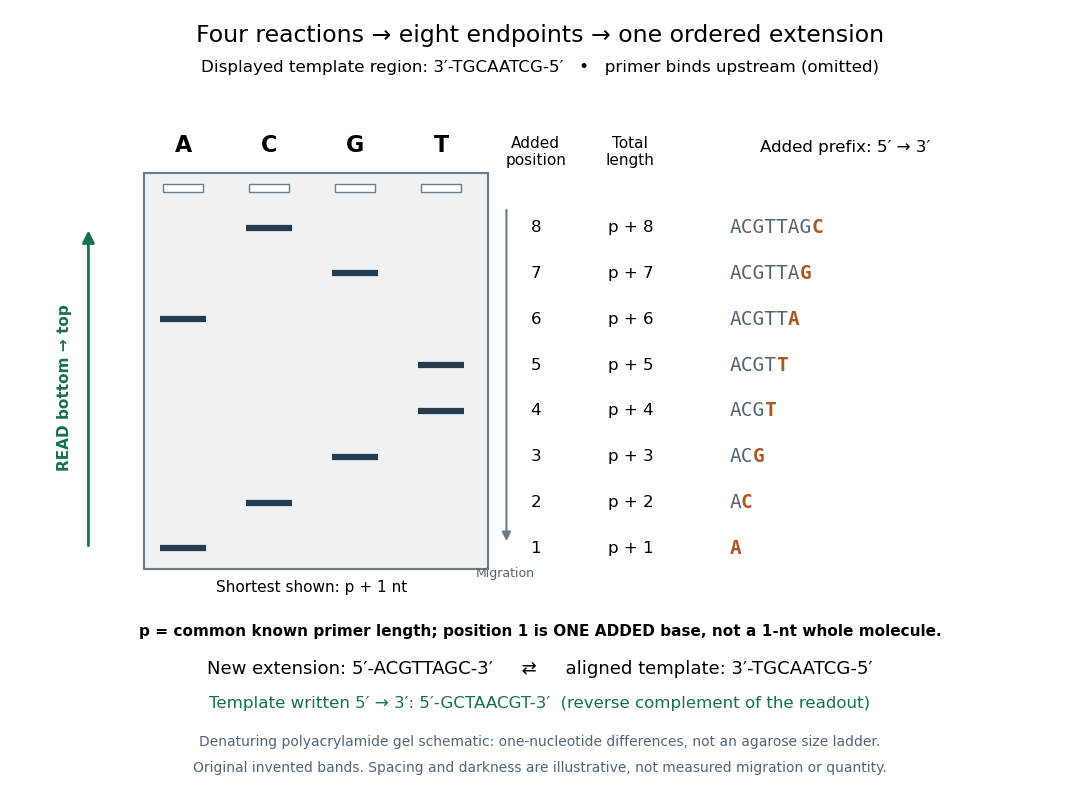
Read an original four-lane Sanger sequencing ladder from the shortest fragment upward to recover
. Invented ideal endpoints: A at extension positions 1 and 6; C at 2 and 8; G at 3 and 7; T at 4 and 5. Every fragment contains the same sequencing primer of length ; the shortest drawn band is nucleotides, not a one-nucleotide whole strand. The gel is a schematic of denaturing polyacrylamide gel electrophoresis; band spacing, widths and darkness are illustrative, with no measured migration, abundance or experimental photograph. The right panel shows the complete added prefix represented by each endpoint. Details.Here is the full endpoint accounting. A terminal letter denotes an incorporated terminating nucleotide; all preceding letters of that extension were supplied by ordinary deoxynucleoside triphosphates.
The shortest fragments migrate farthest, placing position 1 at the bottom. Reading upward, the lane labels spell A, C, G, T, T, A, G, C: the new strand in its -to- direction. The adjacent T bands at positions 4 and 5 encode two separate additions. A single unresolved T patch would leave that count uncertain. In the A lane, the position-6 fragment passed position 1 using ordinary dATP and stopped at position 6 using ddATP; it does not skip the intervening nucleotides.
The common sequencing primer is an offset. For primer length , endpoint has length nucleotides. With an illustrative , the drawn fragments would contain 21 through 28 nucleotides, and adjacent endpoints still differ by one. Subtracting the common preserves their order because . This supplies a short justification for Sanger ladder reading: nested fragments share a start, length orders their endpoints, and lane membership supplies each endpoint's letter. A missing early band cannot be relabeled position 1 without independent evidence about the starting point.
To report the original template region, first complement the readout in aligned orientation:If the requested answer is that template written to , reverse the aligned template to obtain , the reverse complement of the readout. Reversing the readout alone would give CGATTGCA and would be wrong. Complementing without reversing gives the correct template letters in its displayed -to- direction, but not in the usual reporting convention. Specify the strand and its direction before transforming the answer.
The endpoint argument identifies what its scientific controls must interrogate. A known-template comparison tests whether preparation, copying and detection can produce an interpretable ladder. A no-template comparison tests background arising without the intended template. Agreement from an independently primed opposite-strand read tests the proposed nucleotide sequence through its reverse complement. These are distinct analytical checks; none follows merely from seeing a gel band.
An ambiguous ladder should retain its ambiguity. More than one band at a nominal position can reflect mixed templates or unwanted stops; a missing band can reflect failed detection rather than an absent nucleotide. Four clean lanes are an assumption of the ideal example. They do not establish a unique genome, a biological function, or the frequency of a mutation in a population. The historical observations below show why a control for copying chemistry matters even before interpreting the letters.
In 1977, Frederick Sanger, S. Nicklen and Alan Coulson tested chain termination on Phi X 174 DNA. They isolated restriction enzyme fragments as primers, heated them with template to for three minutes and annealed at for thirty minutes. Four extension mixtures used the Klenow fragment of DNA polymerase and radioactive dATP. Their Figure 1 used ddGTP, ddATP, ddTTP and araCTP, an alternative terminating substrate; Figure 2 used all four dideoxy types. This distinction matters when relating the original experiments to an all-ddNTP teaching model.[ref]
DNA sequencing with chain-terminating inhibitors by Frederick Sanger and others. Sanger, Nicklen and Coulson, DNA sequencing with chain-terminating inhibitors, PNAS 74 (1977), pp. 5463–5465, Sequencing Procedure and Figures 1–2
Figure 1 used a 12% acrylamide gel at for fourteen hours, read by autoradiography. Omitting the unlabeled dATP chase caused unwanted A stops across samples: a chemistry scientific control. Ordered bands supported local nucleotide sequences; comparisons could revise provisional assignments. Weak T bands, unresolved long runs and structure-dependent migration limited interpretation. The paper's observations are evidence from particular preparations, not a guarantee that every endpoint is resolved.[ref]
DNA sequencing with chain-terminating inhibitors by Frederick Sanger and others. Sanger, Nicklen and Coulson (1977), p. 5464, chase-omission observation and Figure 1 caption; p. 5466, Results: weak T bands, unresolved runs, sequence comparisons and structure-dependent migration
A sequence alignment places nucleotide sequences or protein sequences in correspondence for comparison. The choice of corresponding positions affects evolutionary inference; matching a short stretch alone does not establish common descent of entire organisms.
The polymerase chain reaction amplifies a selected DNA region using repeated copying steps. Amplified material can be examined by DNA sequencing; appropriate template controls help distinguish a new rearrangement from material already present in the starting preparation.
The essential trick is to choose two PCR primers on opposite DNA strands with their extendible ends facing into the same interval. A DNA polymerase extends each PCR primer ; the resulting DNA can itself become a template. The amplicon is therefore selected by two opposed PCR primers, rather than by the DNA polymerase recognizing a named gene. This makes PCR amplification useful for inspecting one interval within a much larger genome. Here PCR means polymerase chain reaction; the statistical abbreviation PCR means principal component regression.[ref]
Polymerase Chain Reaction (PCR) by Addgene. Background Information: two primers, template-directed copying and product verification
For a deliberately tiny nucleotide sequence example, display the upper strand as . The left PCR primer is and binds the lower strand. The right PCR primer, written in its own -to- direction, is : the reverse complement of CAGC. It binds the upper strand and extends leftward in the drawing. With flanks outside this interval, the bounded amplicon contains base pairs, including both PCR primer sequences. These four-nucleotide PCR primers illustrate direction and counting only; they are not a proposed experimental design.
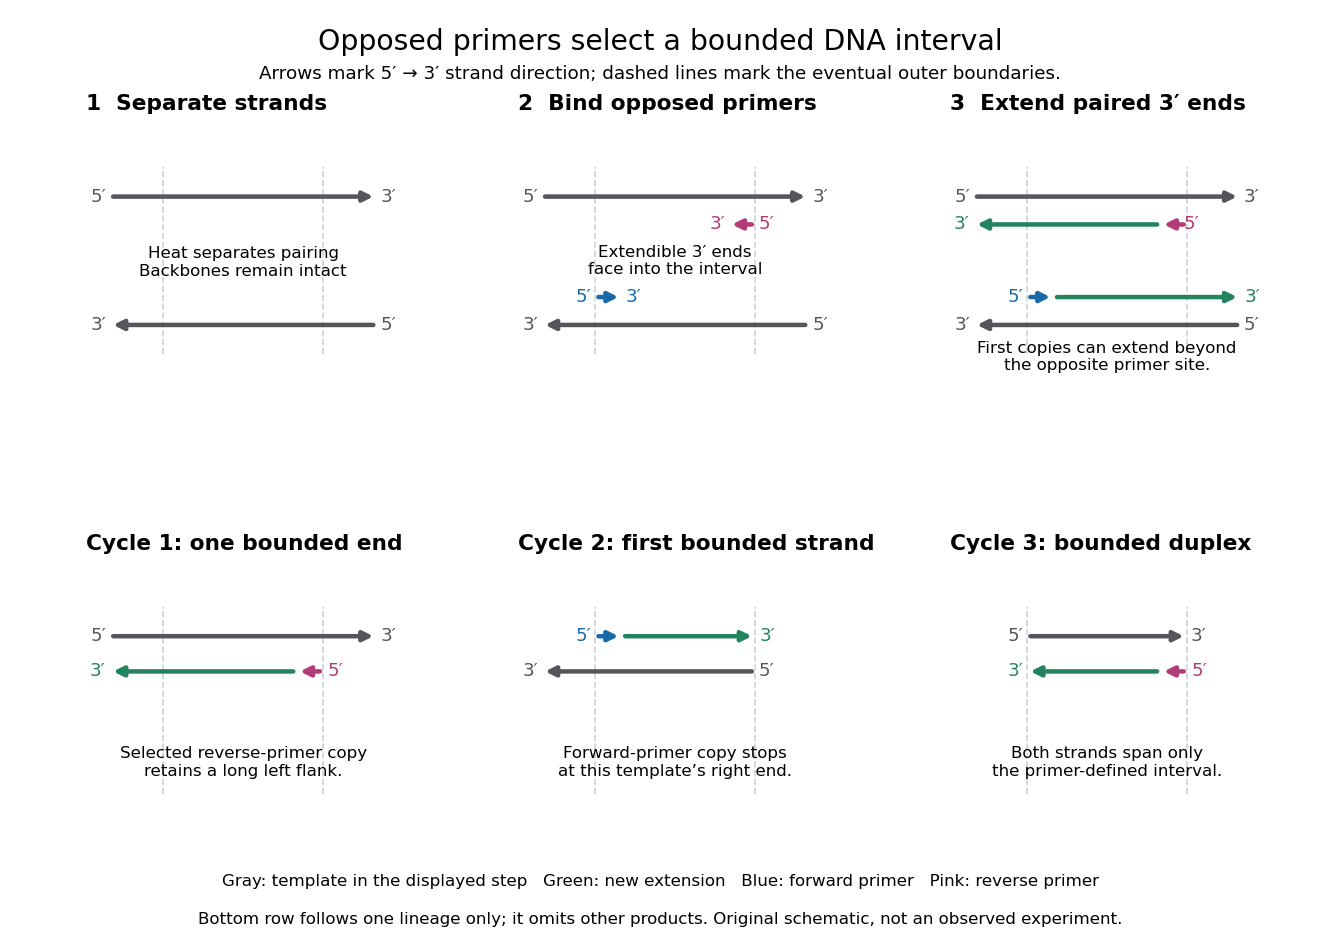
A useful way to understand the polymerase chain reaction is to separate recognition from construction. Base pairing positions a PCR primer; a DNA polymerase then joins new nucleotides onto that existing strand. The PCR primer becomes part of the copied DNA, rather than merely marking a place for an independent strand to start. A PCR thermal cycle repeatedly exposes templates, positions starting ends and permits construction. This makes DNA copying possible outside biological cells, with the chosen PCR primers specifying which interval is repeatedly accessible.
A PCR primer is a short DNA strand that supplies a paired end for a DNA polymerase. Its nucleotide sequence determines where base pairing can initiate copying. Matching a PCR primer at one site is insufficient: both PCR primers must support opposed extension across a copyable interval for sustained selective PCR amplification.
An amplicon is a nucleic acid product of amplification. In ordinary PCR amplification without added primer tails, its boundaries eventually correspond to the outer ends of the two PCR primer binding sites. First-cycle extensions on long starting templates can run beyond the opposite site; exact-length single strands appear in cycle 2 and exact-length duplex products in cycle 3 under complete extension. This explains why the bounded product becomes dominant even though the initial extensions need not have its length.
A PCR thermal cycle separates three jobs. During PCR denaturation, heating separates the paired DNA strands without intentionally cutting their phosphodiester bonds. During PCR annealing, cooling permits base pairing between PCR primers and templates. During PCR extension, the chosen interval supports DNA polymerase synthesis from the paired ends. Each new nucleotide is supplied as a deoxynucleoside triphosphate; its incorporation lengthens the strand. The DNA polymerase is a catalyst, while these nucleotides are consumed substrates.[ref]
Principles of PCR by Thermo Fisher Scientific. Principles of PCR, accompanying description: denaturation, annealing, primer-dependent extension and dNTP incorporation
Taq polymerase withstands repeated high-temperature strand separation better than a heat-sensitive DNA polymerase. Its extension activity still depends on temperature, buffer solution and magnesium ions. Heat resistance does not mean constant activity at every stage: the separation temperature serves the DNA, whereas the extension temperature serves the copying enzyme. As one institutional example, Addgene's Basic PCR Program specifies separation, primer binding and extension. These are example settings, not universal properties of all PCR primers or DNA polymerases.[ref]
Polymerase Chain Reaction (PCR) by Addgene. Basic PCR Program, steps 1–6; Materials List: Taq buffer with magnesium chloride
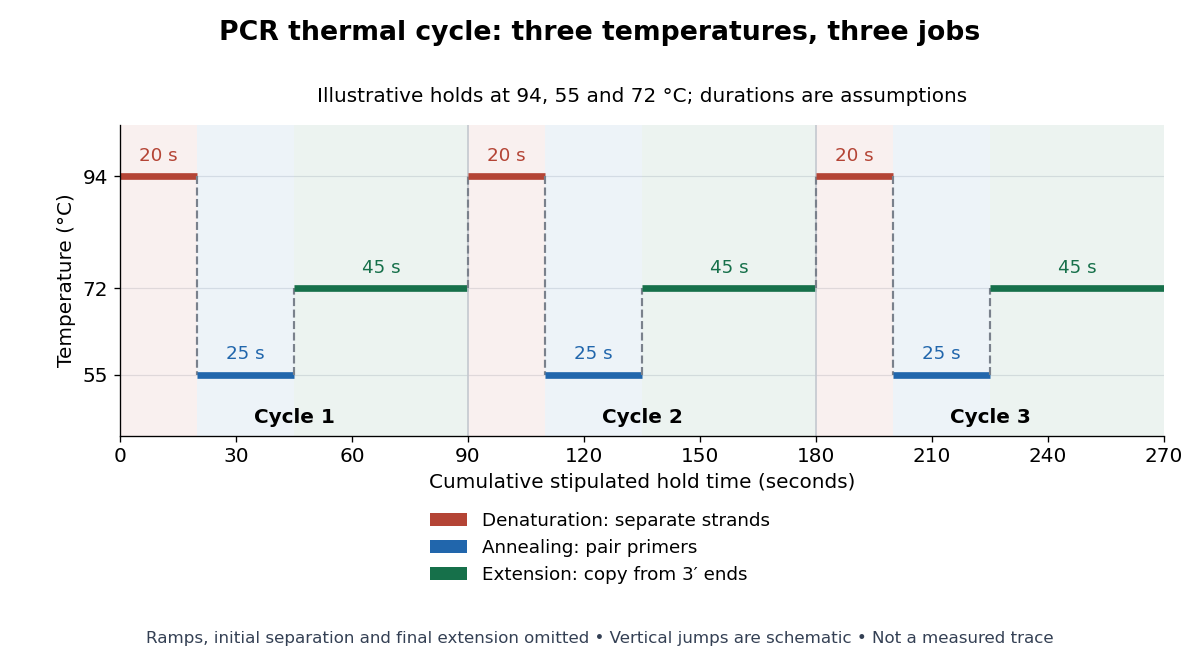
For timing arithmetic alone, those stipulated holds give per PCR thermal cycle, and three cycles give . Adding an assumed initial separation and final extension gives of holds. A real thermal cycler also takes time to move between temperatures. The schedule tells us when conditions favour PCR denaturation, PCR annealing or PCR extension; it does not measure the fraction of DNA copied.
An actual institutional protocol makes the distinction concrete. New England Biolabs specifies mixing templates and PCR primers with its OneTaq master mix in a thin-walled tube; a quick spin collects liquid at the bottom. Its preparation uses of the twice-concentrated mix and of each PCR primer stock, with water completing the volume. Tubes enter a thermal cycler preheated to ; mineral oil is specified if there is no heated lid. The program gives thirty cycles of separation, – binding and extension, with extension time scaled to product length. The binding setting must be selected for the PCR primers; the range is not a continuously swept setting.[ref]
Protocol for OneTaq 2X Master Mix with Standard Buffer by New England Biolabs. Protocol, Reaction setup steps 1–2, 25 microlitre table and Thermocycling conditions; General Guidelines, Annealing and Extension
The dilution can be checked independently: each PCR primer has final concentration , while the mix is diluted twofold. For an endpoint readout, Addgene specifies examining a product aliquot by gel electrophoresis.[ref]
Polymerase Chain Reaction (PCR) by Addgene. Procedure, Primer Design and PCR step 13: run 2 microlitres on a gel
Pair that size comparison with the existing PCR controls: a known template and a no-template tube test different explanations of success or failure. Those comparisons are an analytical addition, not controls documented in the OneTaq schedule. An expected-sized band supports production of a length-compatible amplicon; it does not establish its nucleotide sequence, ideal PCR efficiency or successful separation during every cycle. Neither protocol supplies a measured temperature or yield curve for the schematic above.PCR denaturation is the high-temperature stage that separates a DNA duplex into single-stranded templates for the next copying step. It disrupts the pairing and stacking arrangement of nucleobases; it does not require cutting the phosphodiester bonds along either strand. The distinction matters: breaking the backbone would damage the ordered nucleotide sequence that is meant to serve as a template.
For an original eight-base pair duplex, complete PCR denaturation exposes two eight-nucleotide strands. It leaves sixteen nucleotides altogether: separation has made the templates accessible without yet making more DNA. PCR extension, rather than heating alone, adds the new material. Already copied duplexes also need to separate at the beginning of subsequent cycles.
Separation is a condition-dependent process. Template composition and the buffer solution affect the required temperature and duration; heating longer is not automatically better because prolonged heating can reduce DNA polymerase activity. Incomplete separation leaves fewer accessible templates even when the PCR primers themselves are well chosen.[ref]
PCR annealing is association of PCR primers with exposed complementary DNA regions by base pairing. It supplies the paired starting ends required for PCR extension. Cooling can permit this association without itself joining new nucleotides onto the PCR primers. The two templates can also pair with one another again, so exposure after PCR denaturation is an opportunity for binding, not a guarantee of productive copying.[ref]
Principles of PCR by Thermo Fisher Scientific. Description, first and final paragraphs: binding to complementary templates precedes primer-dependent copying
In the example below, pairs with the aligned template segment . The opposite end labels show antiparallel nucleic acid strands. Pairing the right letters in the wrong directional display does not supply a correctly depicted starting end. These four-nucleotide strands are a teaching example, not a laboratory PCR primer recommendation.
The binding temperature balances enough productive pairing against unwanted binding. Its appropriate value depends on the PCR primers and reaction conditions; increasing it can improve PCR specificity but can also prevent useful binding. A predicted binding setting therefore needs experimental assessment rather than being inferred from the label PCR.[ref]
PCR Cycling Parameters—Six Key Considerations for Success by Thermo Fisher Scientific. Primer annealing optimization, paragraphs beginning In this step, Note that the calculated, and If nonspecific PCR products
PCR extension is template-directed construction of DNA from an annealed PCR primer by a DNA polymerase. Incoming deoxynucleoside triphosphates supply the new nucleotides. Each addition lengthens the growing strand at its end, so the product grows while the template is read . The direction refers to the nucleic acid backbone, not to left or right on a page.[ref]
Principles of PCR by Thermo Fisher Scientific. Description, final paragraph: extension of annealed primers by dNTP incorporation
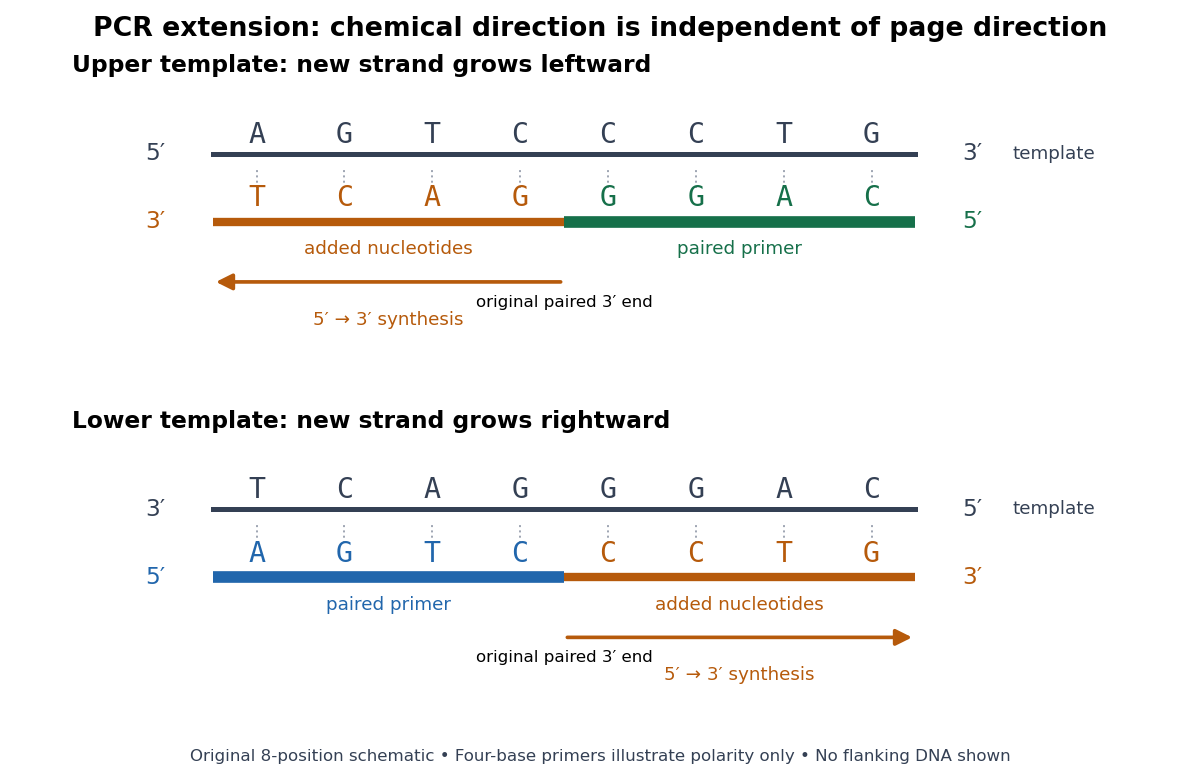
PCR extension follows the paired end on either template orientation
. Original eight-position DNA example with separated complementary templates. Dark rails are existing templates; coloured rails are new strands. The blue PCR primer grows rightward and the green PCR primer grows leftward. Orange marks the material added by DNA polymerase; both arrows point from the original paired end toward the new end. Labels at each end show that both products grow . The templates stop at the displayed boundaries for this teaching example; real starting templates can extend farther. Four-nucleotide PCR primers are deliberately too short to constitute an experimental design. Details.For a complete worked copying step, start with template and paired PCR primer . The next four template letters are GGAC, encountered in the template's -to- direction. The base pairing rule therefore selects CCTG in order, givingThe PCR primer supplies four nucleotides, and PCR extension adds four more; this copying event consumes four deoxynucleoside triphosphates. On the oppositely oriented template , the other PCR primer is . It pairs at the right and extends leftward. Reading that template from right to left encounters CTGA after the paired region, so addition of GACT gives . Both finished products are the reverse complements of their respective templates.
The direction argument is short: the PCR primer and its template are antiparallel nucleic acid strands; extension takes place at the PCR primer's end; hence forward progress along the new strand is backward progress along the template. Reflecting a drawing reverses its arrows on the page without changing either chemical direction. This is why a leftward arrow can represent synthesis.
The time needed depends on how much DNA remains to be copied and the chosen DNA polymerase, while temperature must support that enzyme's activity.[ref]
PCR Cycling Parameters—Six Key Considerations for Success by Thermo Fisher Scientific. Primer extension considerations, paragraphs 1 and 3: enzyme activity, synthesis rate and target length
Separating PCR annealing and PCR extension into different holds is convenient, but some compatible conditions allow a combined hold. The three chemical jobs therefore need not always require three distinct temperatures.[ref]Principles of PCR by Thermo Fisher Scientific. Description, paragraphs 2–3: enzyme-dependent extension temperature and two-step cycling
A thermal cycler changes the temperature of reaction tubes through a programmed sequence. A heated lid can reduce evaporation and condensation above the reaction. Instrument timing, sample temperature and nominal block temperature need not be identical.
For a stipulated population of amplifiable copies, let be the amount after cycle and define PCR efficiency by the fractional new yieldHere means one additional copy per existing copy, hence ideal doubling. If every cycle has the same PCR efficiency , the exponential growth model gives . Starting with copies, twenty ideal cycles give copies; the stipulated value gives about . An efficiency of 80 percent therefore means multiplication by 1.8 each cycle, not retention of 80 percent of the final ideal yield.
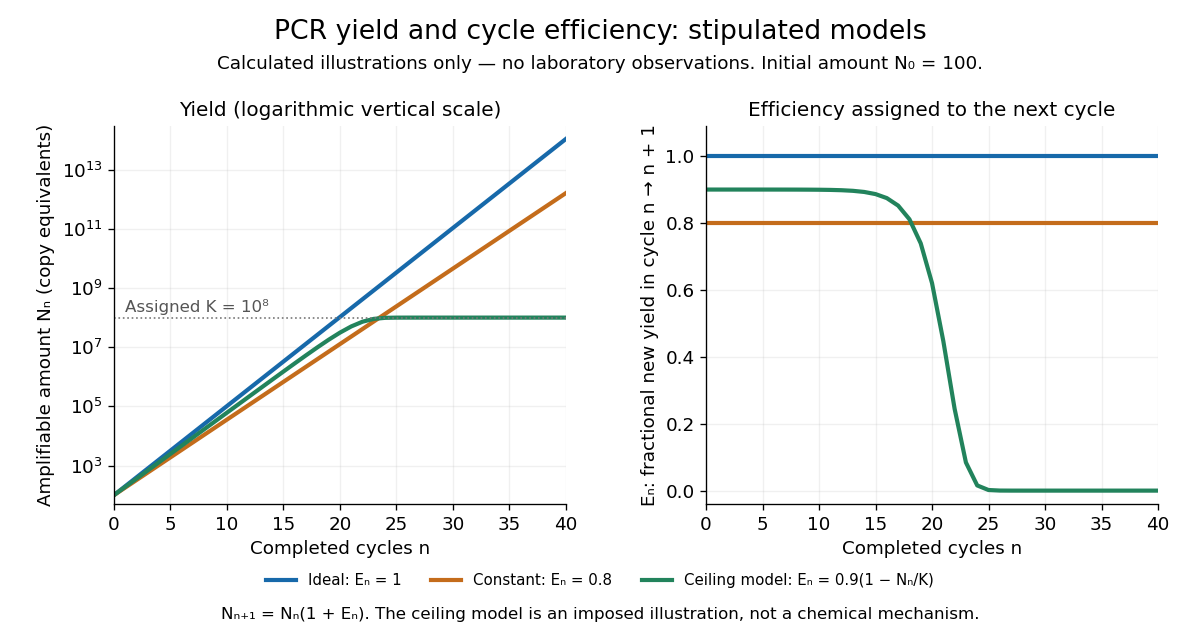
In the ideal strand-counting example, all duplex-equivalent material doubles, but exact-length amplicons lag initially. Starting from one longer duplex and retaining its two original strands, cycle contains exact-length strands out of total strands. Thus their fraction is : zero after cycle 1, one quarter after cycle 2 and one half after cycle 3. This counts strands rather than assuming every strand immediately finds an exact-length partner. The generic yield model above ignores this early distinction.
A PCR plateau is the late phase in which further cycles add little product. Depletion of substrates and accumulation of reaction by-products can reduce PCR efficiency. Consequently, similar final amplicon amounts need not mean similar initial template amounts. In the stipulated green model, implies , and growth approaches the imposed ceiling. That illustrates loss of starting-amount information without claiming to identify the limiting chemical process in an actual tube.[ref]
PCR Cycling Parameters—Six Key Considerations for Success by Thermo Fisher Scientific. PCR cycle number determination and Figure 7: lowered efficiency and plateau from reaction-component depletion and by-products
PCR specificity concerns whether the accumulated amplicon comes from the intended interval. Binding temperature, PCR primer nucleotide sequences and their possible alternative binding sites matter. Too permissive binding can support competing products; excessively restrictive binding can prevent the intended product. A band of the expected length is useful evidence, but unrelated nucleotide sequences can have the same length. DNA sequencing tests identity more directly, subject to mixtures and copying errors.[ref]
How to Design a Primer by Addgene. Primer Design for PCR: specificity, paired melting temperatures and complementary primer sequences
A primer dimer is an amplification artifact in which PCR primers provide extendible partners for one another. Its accumulation consumes substrates and may produce a signal even without the intended template. It is not evidence that the intended amplicon was present.[ref]
Why do I see amplification curves in my NTC samples? by New England Biolabs. FAQ: primer structures as DNA-polymerase substrates, and carryover PCR-product contamination
PCR controls are scientific controls that separate different explanations for a readout. A no-template reaction contains the PCR primers and copying reagents but replaces the added template with water or sample buffer. Amplification there can indicate carried-over DNA or a primer dimer; a clean result does not exclude contamination confined to one sample.[ref]
How can I distinguish non-template amplification (NTC) from real products? by New England Biolabs. FAQ: target-free control reactions and differing product sizes or melt profiles
Different comparisons answer different questions. A known amplifiable template tests whether the PCR primers, DNA polymerase and thermal cycler can produce the expected amplicon. An extraction blank follows sample preparation without adding the sampled material. A separate amplifiable interval in the sample can test whether recovered DNA supports copying, although success there does not guarantee success at the target. A length standard calibrates gel electrophoresis; it is not a control for the copying reaction. These comparisons are an analytical design extension to the teaching example below, not a claim that its student protocol includes every comparison.
The DNA Learning Center's Detection of an Alu Insertion Polymorphism by PCR by DNA Learning Center, Cold Spring Harbor Laboratory supplies a concrete length-based example. It collects mouthwash biological cells, concentrates them with a microcentrifuge, heats them by Chelex extraction and transfers the DNA-containing supernatant. Its reaction combines of that preparation with primer mix and a reagent bead in a thermal cycler. Thirty cycles use , and , each for thirty seconds. An electrophoresis chamber separates products by agarose gel electrophoresis in a 2 percent gel; a UV transilluminator reveals stained DNA.[ref]
Detection of an Alu Insertion Polymorphism by PCR by DNA Learning Center, Cold Spring Harbor Laboratory. pp. 2–3, Procedures I–III: extraction, 25 microlitre reaction, cycle profile, gel and UV readout
Its PCR primers flank an insertion site at the PV92 locus. The student protocol predicts a 715-base pair product with the Alu element and a 415-base pair product without it. Two bands support a heterozygous genotype; one corresponding band supports a homozygous genotype only if amplification and detection of both alleles were adequate. These are the protocol's expected readouts, not newly collected observations.[ref]
Detection of an Alu Insertion Polymorphism by PCR by DNA Learning Center, Cold Spring Harbor Laboratory. p. 1, Introduction: primer-flanked insertion and stated 715/415 bp genotype patterns
The instructor manual describes extra bands from nonspecific priming and a small diffuse primer dimer band. A missing target band therefore cannot on its own distinguish failed extraction, inhibited copying, poor binding or lack of the target. Nor does detection of the Alu element at this one genetic locus establish a complete genome, a unique personal identity or a clinical conclusion. The PCR controls help separate these possibilities; DNA sequencing can add sequence evidence to the size comparison.[ref]
Using an Alu Insertion Polymorphism to Study Human Populations by Dolan DNA Learning Center, Cold Spring Harbor Laboratory. printed pp. 18 and 29, Results and Discussion and Amplify DNA by PCR: primer dimer and nonspecific priming
RT-PCR combines reverse transcription with PCR amplification. The RT names the RNA-to-DNA step, not real-time observation. RT-PCR can have an endpoint readout. A matched preparation omitting reverse transcriptase tests whether contaminating DNA could account for amplification; it answers a different question from a no-template reaction.[ref]
Basic Principles of RT-qPCR by Thermo Fisher Scientific. One-step vs. Two-step RT-qPCR and Controls for RT-qPCR: minus-reverse-transcription control
Real-time polymerase chain reaction monitors fluorescence during cycling. With validated specificity, calibration and PCR efficiency, that record supports estimating initial template amount; this quantitative use is called qPCR. Ordinary endpoint PCR amplification examines accumulated product afterwards. qPCR need not start from RNA, and RT-PCR need not monitor fluorescence. Combining both operations gives RT-qPCR.[ref]
Real-Time PCR (qPCR) Basics by Thermo Fisher Scientific. Real-Time PCR Basics: amplification monitoring and quantification
RT-qPCR applies qPCR after reverse transcription. Differences in RNA recovery and conversion into Complementary DNA can affect its inferred starting amount as well as differences in PCR efficiency.
The 1993 Nobel chemistry announcement credits Kary Mullis with inventing the polymerase chain reaction method and states that the technique was first presented in 1985. The reusable-product principle explains its power: each successfully copied interval can help specify the next generation. The award attribution is a historical claim; it does not imply that every improvement in DNA polymerases, thermal cyclers or PCR controls came from one person.[ref]
Press release: The 1993 Nobel Prize in Chemistry by Royal Swedish Academy of Sciences. 13 October 1993 announcement, award citation and introductory account of PCR first presented in 1985
The PV92 locus is a genetic locus on human chromosome 16 used in the PV92 teaching experiment to compare the presence and absence of an Alu element.
An Alu element is a repeated DNA element; the PV92 teaching experiment examines one particular insertion site rather than amplifying every copy across the genome.
Chelex extraction releases DNA from heated biological cells in the presence of a resin that binds metal ions. The PV92 teaching experiment transfers the supernatant, leaving resin and debris behind.
Reverse transcription makes DNA from an RNA template using a reverse transcriptase. It reverses the template/product relationship of ordinary transcription, which makes RNA from DNA. The resulting Complementary DNA can supply a template for PCR amplification.[ref]
Basic Principles of RT-qPCR by Thermo Fisher Scientific. RNA as the Starting Material and Reverse Transcriptase Enzymes
Complementary DNA is DNA made from an RNA template by reverse transcription. When its template is mature messenger RNA, its sequence reflects the processed transcript rather than every intervening intron in the corresponding gene.
A Northern blot separates RNA by size and detects selected sequences through hybridization with a probe. Detection of a messenger RNA supports transcription of a gene, but does not alone establish a functional protein or its destination.
DNA replication copies a double-stranded DNA molecule into two daughter double-stranded DNA molecules. In semiconservative replication, each daughter retains one parental strand and receives one newly synthesized complementary strand. DNA polymerases build the new strands from incoming nucleotides; they do not make RNA or proteins in this copying step. See Alberts et al., Molecular Biology of the Cell, 4th edition (2002): DNA replication mechanisms.
For a five-base pair example, separate from its partner . Base pairing specifies a new TACGG partner for the old ATGCC strand and a new ATGCC partner for the old TACGG strand. With error-free copying, both daughter DNA molecules have the original nucleotide sequence, but different physical strand histories. One initial duplex contains ten nucleotides; one complete round produces two duplexes containing twenty nucleotides, ten retained and ten newly incorporated.
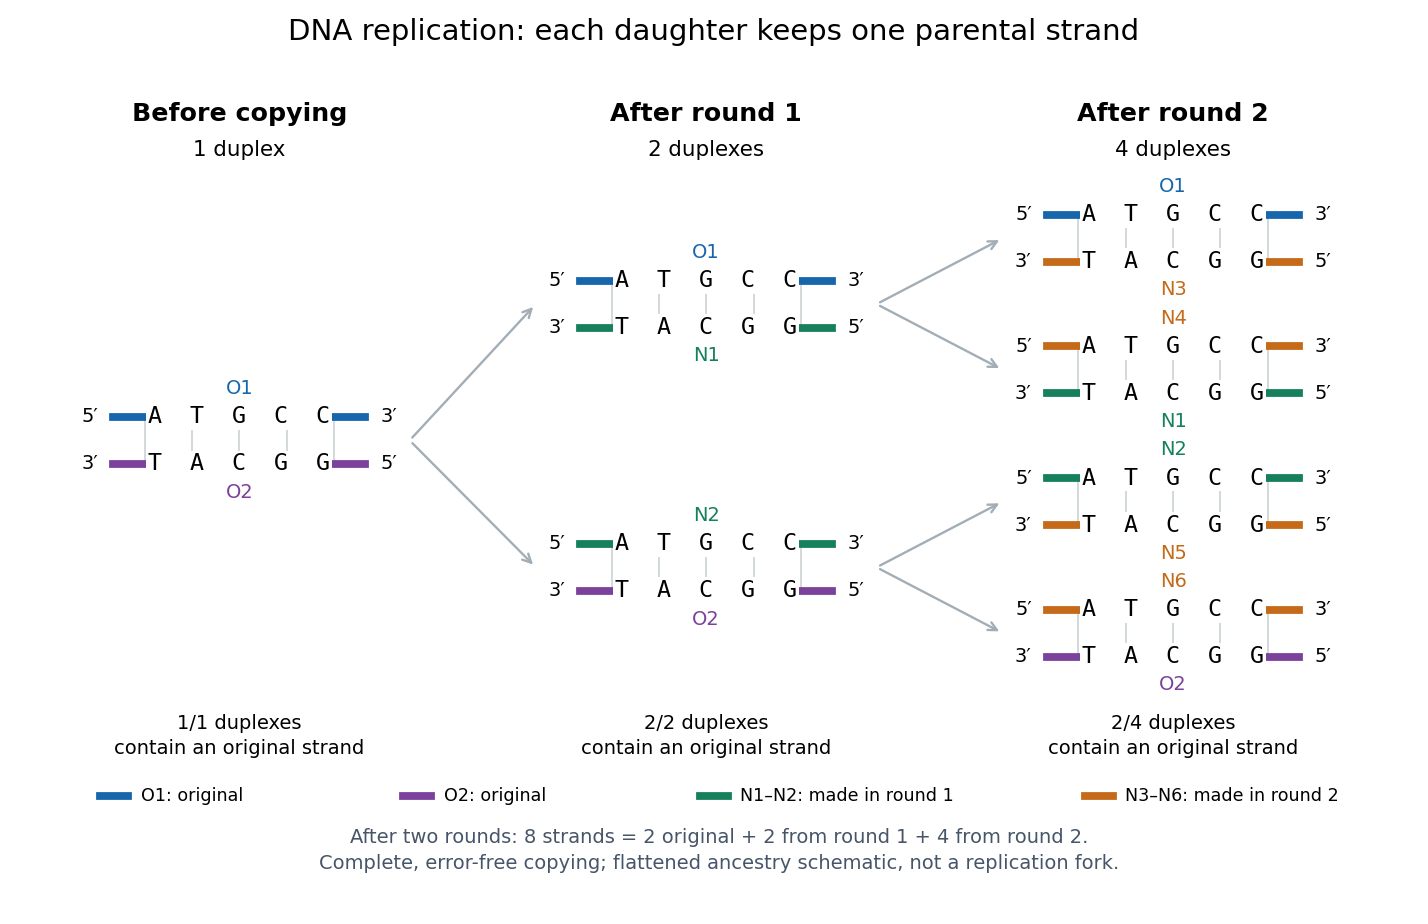
Semiconservative replication: follow two original DNA strands through two complete copying rounds
. Blue O1 and purple O2 are the original strands; green strands were made in round 1 and orange strands in round 2. Each arrow connects a parent duplex to its daughters. After round 2, two of four duplexes retain an original strand, and the other two retain a round-1 strand. All eight strands have the appropriate complementary nucleotide sequences; colors identify strand age, not different nucleobases. The flattened duplexes show ancestry and orientation, not a replication fork or molecular shape. Details.This is useful for inheritance: both daughter biological cells can receive a copy of the DNA record. The elegant feature is that base pairing lets each strand specify its missing partner. Direction matters too: a replicating DNA polymerase reads its template and extends the new strand at its end, so synthesis proceeds . These are opposite directions on antiparallel nucleic acid strands, not two alternative directions of synthesis. The enzyme needs a pre-existing paired strand end to extend; the diagram omits the machinery that starts and coordinates copying. See Alberts et al.: template-directed synthesis and the requirement for a primer.
The strand accounting predicts observable differences between copying mechanisms. In 1958, Meselson and Stahl grew Escherichia coli with the heavier nitrogen isotope , then supplied and measured extracted DNA by density-gradient centrifugation. After one generation their samples contained intermediate-density DNA; after two, intermediate-density and light DNA occurred in equal amounts. This supported semiconservative replication in the tested Escherichia coli culture. It was an isotope assay of sampled DNA, not simultaneous testing of every kind of DNA or direct colored-strand photography. See The replication of DNA in Escherichia coli by Matthew Meselson and Franklin W. Stahl.
In semiconservative replication, each daughter duplex retains one strand of its immediate parent. Under complete copying without strand loss or exchange, one starting duplex gives duplexes after rounds, but still only two original strands. For , the fraction of duplexes containing an original strand is : all after one round, half after two, a quarter after three. The fraction of all strands that are original is instead . A strand made in round 1 is parental when round 2 begins.
A replicating DNA polymerase is an enzyme that extends a paired strand end with nucleotides selected against a DNA template. New DNA grows while the template is read . Base pairing specifies the partner; the DNA polymerase catalyzes its incorporation. See Alberts et al.: DNA polymerase.
Taq polymerase is a heat-resistant DNA polymerase used in PCR amplification. It requires a paired strand end and nucleotide substrates; heat resistance does not confer target recognition.
A deoxynucleoside triphosphate is a nucleotide containing deoxyribose and three phosphate groups. DNA polymerases use these substrates to extend DNA; the four standard substrate types carry adenine, cytosine, guanine or thymine.
A DNA replication inhibitor interferes with DNA replication; the observed effect depends on exposure and assay conditions.
A replicon is a DNA unit replicated from an origin of replication. A plasmid can form a replicon separate from a host chromosome.
An origin of replication is a DNA region at which DNA replication is initiated. Its function depends on compatible cellular machinery.
DNA repair addresses damage to DNA. Incorporation of a labeled precursor during DNA repair need not indicate duplication of the whole genome in S phase.
Gene expression uses a gene's information to produce functional RNA or a protein. Transcription makes RNA from a DNA template; for a protein-coding gene, biological translation then uses messenger RNA to specify an amino acid chain. Many genes instead produce functional RNA, including transfer RNA and ribosomal RNA, without a translated protein product. See Alberts et al., Molecular Biology of the Cell, 4th edition (2002): from DNA to RNA.
Follow the chosen coding strand : transcription of its complementary template gives in messenger RNA. In the stated reading frame, its three codons are AUG, GCU and UAA: methionine, alanine and a stop codon. Thus nine nucleotides specify two amino acid residues followed by termination, not three residues. This is an illustrative coding segment embedded in suitable expression and initiation context, not a claim that an isolated nine-nucleotide RNA is sufficient to initiate biological translation.
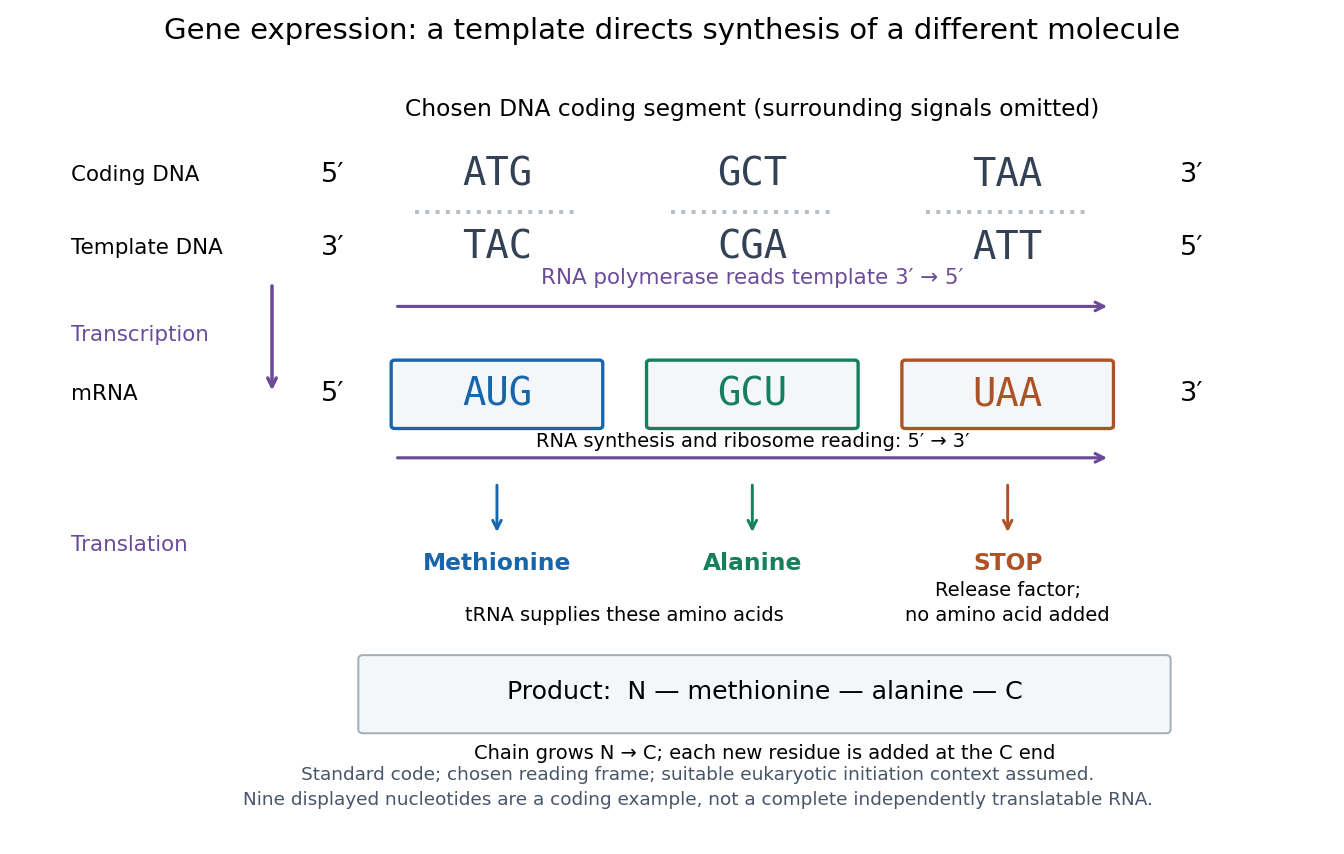
The distinction between copying and use explains how biological cells can preserve the same DNA yet produce different products. DNA replication duplicates the record; gene expression selects and uses parts of it. Transcription does not use all DNA at once, and gene expression can be controlled at several steps, including transcription, RNA processing and biological translation. See Clark, Douglas and Choi, Biology 2e: regulation of gene expression. The arrows describe template-directed synthesis: the DNA does not physically turn into a protein, and the messenger RNA does not supply the amino acids from which that protein is assembled.
In the GAL1 gene promoter system used in the yeast cross-species complementation experiment, the inducing sugar galactose promotes gene expression from the engineered construct, whereas glucose provides a noninducing comparison. The comparison concerns an imposed regulatory system, not the donor species’ native regulation. [ref]
Pathways Over Time Plasmids Engage Students in Functional Genomics Research by Clare O’Connor. O’Connor (2018), Plasmid features enable multiple student experiments and Complementation reveals conservation of function: GAL1 promoter
A gene promoter is a DNA region involved in initiating transcription. Moving a coding sequence into a nuclear genome does not guarantee that its original gene promoter can drive nuclear gene expression.
A transcription factor is a protein that regulates transcription. Combinations of transcription factors help select gene expression patterns during cell differentiation. [ref]
Anatomy and Physiology 2e by J. Gordon Betts and others. Anatomy and Physiology 2e, §3.6, Differentiation and Figure 3.35: transcription factors
Transcription is synthesis of RNA using one DNA strand as a template by an RNA polymerase. During elongation the RNA polymerase reads that template while extending RNA . Only the selected region is transcribed; other regions need not be active, and the template strand can differ between genes. See Alberts et al.: RNA polymerase and selection of transcribed DNA regions.
For the displayed example, align these three nucleotide sequences in the same left-to-right positions:The first template triplet TAC selects AUG: T pairs with A, A with U, and C with G. The next CGA selects GCU, and ATT selects UAA. The coding strand therefore matches the RNA lettering except for T versus U, whereas the template is complementary. Reading that template in its own direction gives ; orientation cannot be discarded. The gene expression diagram keeps all three rows aligned. See Clark, Douglas and Choi, Biology 2e: template and coding strands in transcription.
This correspondence makes nucleotide sequences interpretable, but replacing T by U is valid only after identifying the coding strand. Moreover, RNA may be processed after transcription, so the initial product and mature messenger RNA need not have identical uninterrupted nucleotide sequences. Transcription also makes functional RNA that will not undergo biological translation. See Alberts et al.: RNA processing and RNA as the final gene product.
An RNA polymerase used in transcription is an enzyme that synthesizes RNA from a DNA template. Unlike a replicating DNA polymerase, it can start a new strand without a pre-existing paired strand end; initiation still requires the appropriate DNA signals and associated machinery. See Alberts et al.: RNA polymerase and transcription initiation.
For a specified transcription unit, the coding strand is the DNA strand matching the initial RNA product in the direction, with T in place of U. The opposite DNA strand is the template. The name does not imply that every transcribed gene encodes a protein. See Clark, Douglas and Choi: coding and template strands.
Biological translation uses a ribosome to read messenger RNA codons and assemble the corresponding amino acid chain. Transfer RNA adaptors match codons through base pairing and carry the amino acids; the genetic code supplies the correspondence. The chain grows from the N-terminus toward the C-terminus, by adding each new residue at the C-terminus. See Clark, Douglas and Choi, Biology 2e: ribosomes, transfer RNA and protein synthesis.
In the gene expression diagram, read in the chosen reading frame. Under the standard genetic code, AUG specifies methionine and GCU specifies alanine; UAA is a stop codon. The result before any subsequent processing is the two-residue chain N–methionine–alanine–C, followed by termination. The stop codon contributes zero amino acids. See Clark, Douglas and Choi, Biology 2e: the standard genetic code. This example assumes appropriate initiation at the displayed AUG in a suitable context in a eukaryote; the diagram displays the coding segment, not a complete independently translatable messenger RNA.
Initiation establishes the starting position and reading frame, using a ribosome, an initiating transfer RNA and additional factors. At a standard stop codon, a release factor promotes release of the chain rather than delivery of another amino acid by transfer RNA. See Clark, Douglas and Choi: initiation and termination of translation. A short two-residue example illustrates decoding, not the size or folding of a typical functional protein.
The useful connection is between two different alphabets: nucleotides specify the order of amino acids through the genetic code. Base pairing helps select transfer RNA, while the ribosome catalyzes joining the delivered amino acids. The messenger RNA remains a template rather than being consumed as the chain's building material. Separating template, adaptor and product makes clear why transcription and biological translation are distinct mechanisms.
The genetic code assigns RNA codons to amino acids or termination signals. Four possible nucleobases at each of three positions give codons. In the standard genetic code, 61 specify amino acids and three are stop codons; several codons can specify the same amino acid. Variants exist, so state which genetic code is being used. See Clark, Douglas and Choi: genetic code assignments and variants.
A codon is a three-nucleotide unit read in a specified reading frame during biological translation. For example, GCU specifies alanine in the standard genetic code. Its letters are read .
For an original example, choose the messenger RNA segment and stipulate initiation at the displayed AUG in a suitable eukaryotic context. Under the standard genetic code, its first three codons specify methionine, alanine and phenylalanine; the fourth is a stop codon. The resulting peptide before processing is N–methionine–alanine–phenylalanine–C. Twelve nucleotides therefore specify three amino acid residues and termination. The displayed segment omits the surrounding initiation signals; its nucleotide sequence alone is not a complete expression system.
A codon belongs to an oriented nucleotide sequence: GCU and UCG are different ordered triplets. Four possible nucleobases, adenine, cytosine, guanine and uracil, allow triplets because each position can be chosen independently when enumerating possible sequences. This is a counting argument, not a claim that nucleobases occur independently in real RNA. Sixty-one triplets are sense codons, meaning amino acid assignments, and UAA, UAG and UGA are stop codons in the standard genetic code.[ref]
Biology 2e by Mary Ann Clark and others. §15.1, The Genetic Code, Figure 15.4 and following paragraph: triplets and standard assignments
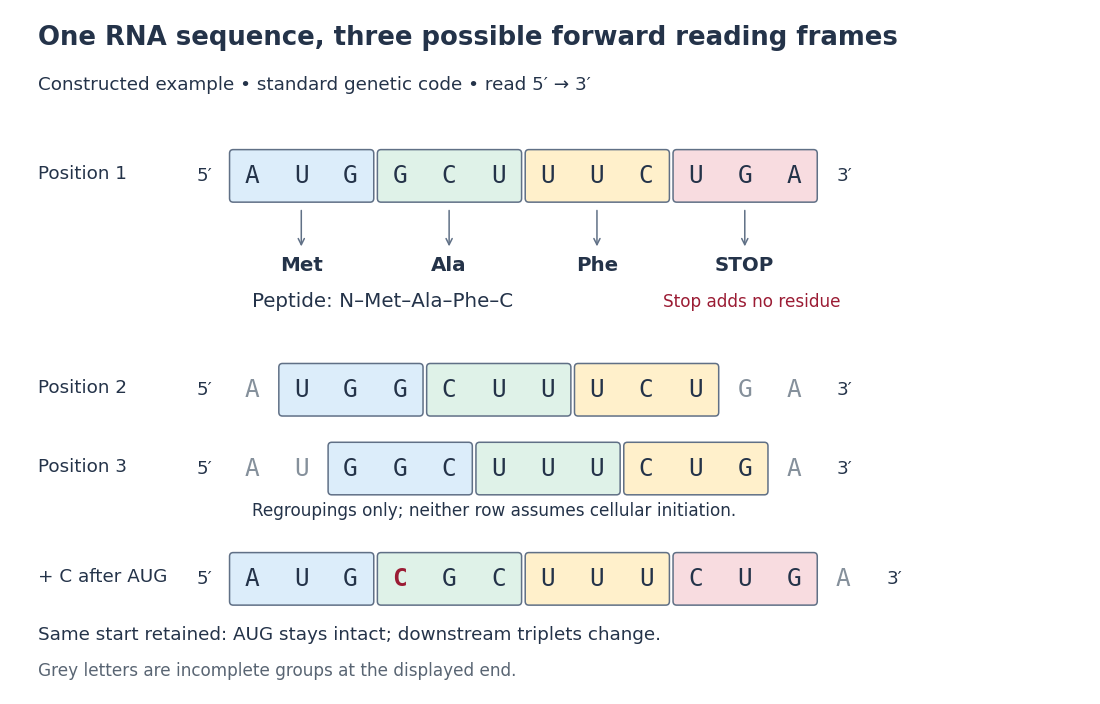
The useful unit is the ordered triplet together with its reading frame and genetic code, rather than three letters viewed in isolation. That combination lets DNA sequencing data support predictions about protein sequences after identifying the relevant messenger RNA. The Nirenberg and Matthaei experiment illustrates how the correspondence became experimentally accessible.
In the standard genetic code, UAA, UAG and UGA are stop codons: they signal termination of biological translation rather than an amino acid assignment. See Clark, Douglas and Choi: stop codons.
A stop codon supplies no additional amino acid residue. In the constructed AUG GCU UUC UGA example, replacing UGA by UAA preserves termination after the same three amino acid residues. Replacing UUC by UAA instead terminates after methionine and alanine. These are consequences of the stated genetic code, not measurements of expression efficiency.
At a standard stop codon, a release factor promotes release of the polypeptide from the ribosome. Ordinary delivery of an amino acid by transfer RNA does not supply a “stop amino acid”.[ref]
Biology 2e by Mary Ann Clark and others. §15.5, Translation, Elongation, and Termination, paragraph beginning “Termination of translation”: stop codons and release factors
A release factor is a protein involved in terminating biological translation and releasing the completed polypeptide at a stop codon.[ref]
Biology 2e by Mary Ann Clark and others. §15.5, Translation, Elongation, and Termination, paragraph beginning “Termination of translation”
A reading frame specifies how consecutive nucleotides are grouped into codons. Starting at position 1 of AUGGCUUAA gives AUG / GCU / UAA; starting at position 2 gives UGG / CUU with AA left over. The letters are unchanged but the groups differ. A possible grouping alone does not establish an actual biological translation initiation site.
For the twelve-nucleotide example, number positions from the end. The three possible forward reading frames start at positions 1, 2 and 3:Parentheses enclose incomplete trailing groups. The second and third rows do not assert initiation of biological translation in a biological cell. A chosen start fixes which positions belong together; the ribosome then advances through consecutive codons rather than searching each three-letter window independently.
A frameshift mutation changes downstream grouping into codons through insertion or deletion of a number of nucleotides not divisible by three. In the constructed messenger RNA example, insert C immediately after AUG while retaining the same initiation position: . The first codon is preserved, but the original downstream groups GCU, UUC and UGA disappear. The displayed fragment now has no complete standard stop codon; what happens later depends on its continuation.
The short proof is positional: every downstream nucleotide moves by positions after an insertion of length . Boundaries recur every three positions, so they retain the original phase exactly when is divisible by three. An insertion of three nucleotides can still change the peptide, but it does not shift the downstream reading frame. This distinction helps interpret genetic variants without predicting a particular phenotype from grouping alone.[ref]
Biology 2e by Mary Ann Clark and others. §15.1, The Genetic Code, Figure 15.5: nucleotide deletion and shifted grouping
Degeneracy of the genetic code means that distinct codons can specify the same amino acid. For example, UUU and UUC both specify phenylalanine in the standard genetic code.[ref] In the original AUG GCU UUC UGA example, changing UUC to UUU preserves the predicted amino acid order. This illustrates redundancy of assignment, not equality of every possible effect on gene expression.
Degeneracy of the genetic code differs from ambiguity: multiple inputs share one output, whereas an ambiguous assignment would give a single codon more than one meaning in the same specified decoding context. The standard genetic code table has one listed assignment per triplet. Alternative genetic codes, including those used in some mitochondria, and engineered decoding contexts must be specified separately; the standard table is not a universal statement about all organelles or synthetic systems.
In 1961, Marshall Warren Nirenberg and J. Heinrich Matthaei ground washed Escherichia coli and used centrifugation to prepare a cell-free extract. Reactions at combined ribosomes, soluble components, ATP regeneration and phenylalanine carrying a isotope label, with or without polyuridylic acid, an RNA containing only U. After incubation, trichloroacetic acid precipitation, washing and counting radioactive decay detected label in insoluble material. Added polyuridylic acid strongly increased incorporation; removing ribosomes or ATP regeneration suppressed it. Product characterization supported a phenylalanine polypeptide.[ref]
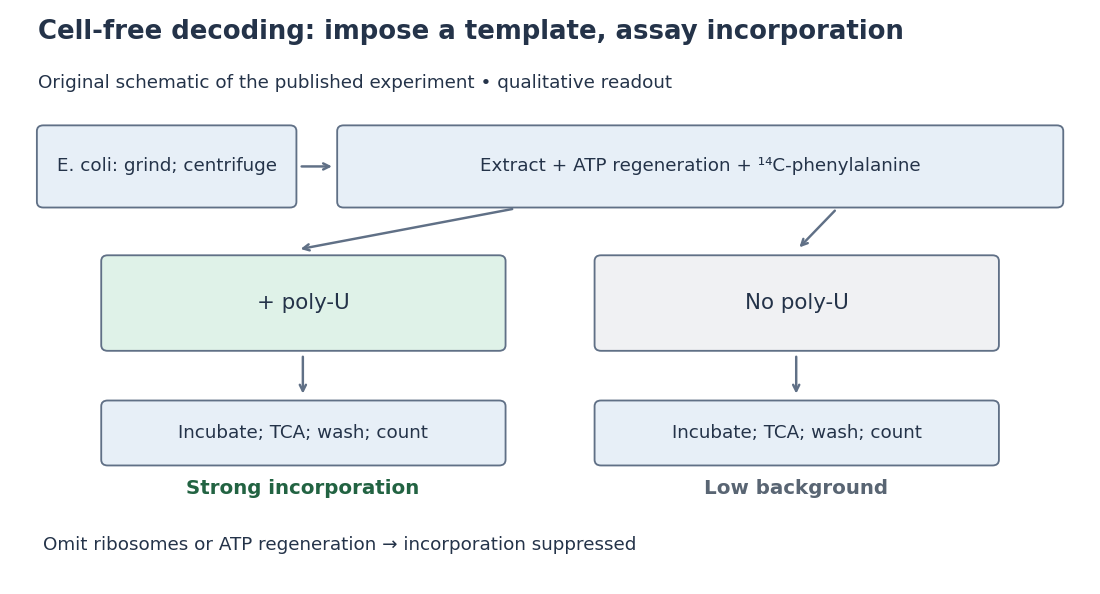
Nirenberg and Matthaei experiment: preparation, comparison and readout
. Original schematic; readout summarizes qualitative published observations. Details.The inference connects an imposed RNA template to a specific amino acid product. Yet repeated U alone cannot distinguish one-, two- or three-letter coding units: every possible group still contains only U. Neither triplet length nor the complete genetic code follows.[ref]
The dependence of cell-free protein synthesis in E. coli upon naturally occurring or synthetic polyribonucleotides by Marshall Warren Nirenberg and J. Heinrich Matthaei. p. 1601, Discussion and Note added in proof: coding-unit length not established
Cell-free translation uses isolated ribosomes and soluble components to make polypeptide chains from messenger RNA outside an intact biological cell.
Auxotrophy is a phenotype in which growth requires an externally supplied substance that a comparison biological strain can make for itself. Growth on supplemented cell culture medium formulations can reveal the requirement without identifying the responsible gene.
DNA ligation joins DNA ends covalently through DNA ligase. Base pairing of complementary ends can align fragments before joining.
Molecular cloning propagates a chosen DNA fragment using a carrier such as a plasmid in suitable recipient biological cells.
Ploidy counts complete sets of chromosomes in a cell nucleus. Write for the number of chromosomes in one set: haploid means one set, diploid two. DNA replication produces sister chromatids without changing ploidy.[ref]
Cell Division. Biology 2e, §10.1, Genomic DNA; Eukaryotic Chromosomal Structure and Compaction, final paragraph
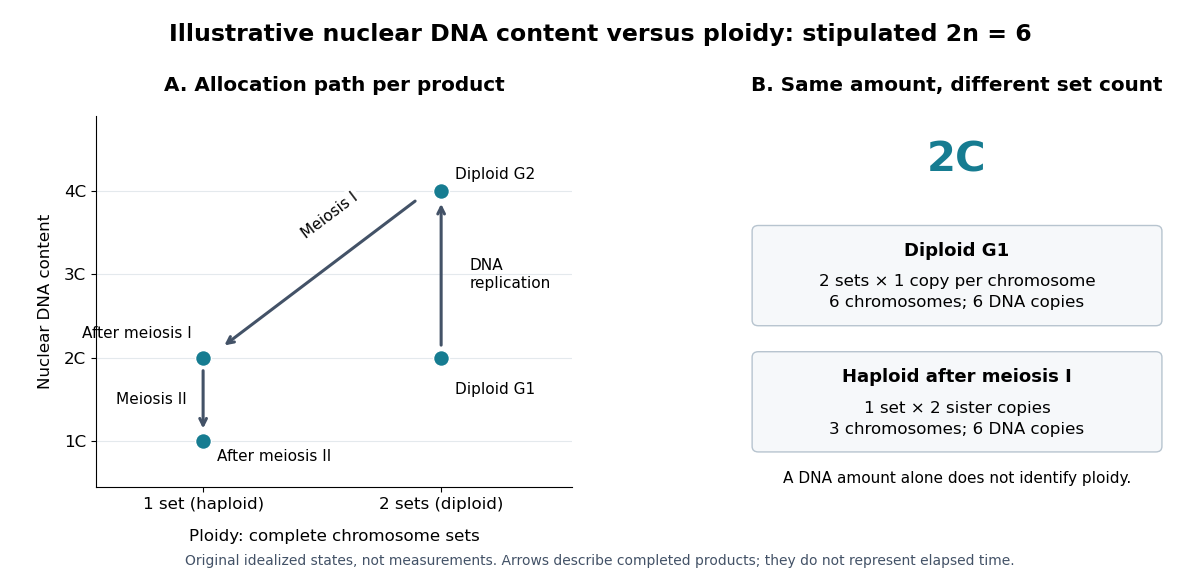
Consider an illustrative species with , hence . One set contains three distinguishable chromosome types, ; the diploid cell nucleus contains two homologous chromosomes of each type. Labels describe chromosome identity, not particular alleles. Let be the Nuclear DNA content of one unreplicated set. All entries below refer to one completed product of division, or the starting cell nucleus, rather than the sum over products. Here “chromatid count” includes the single DNA copy in each unreplicated chromosome.
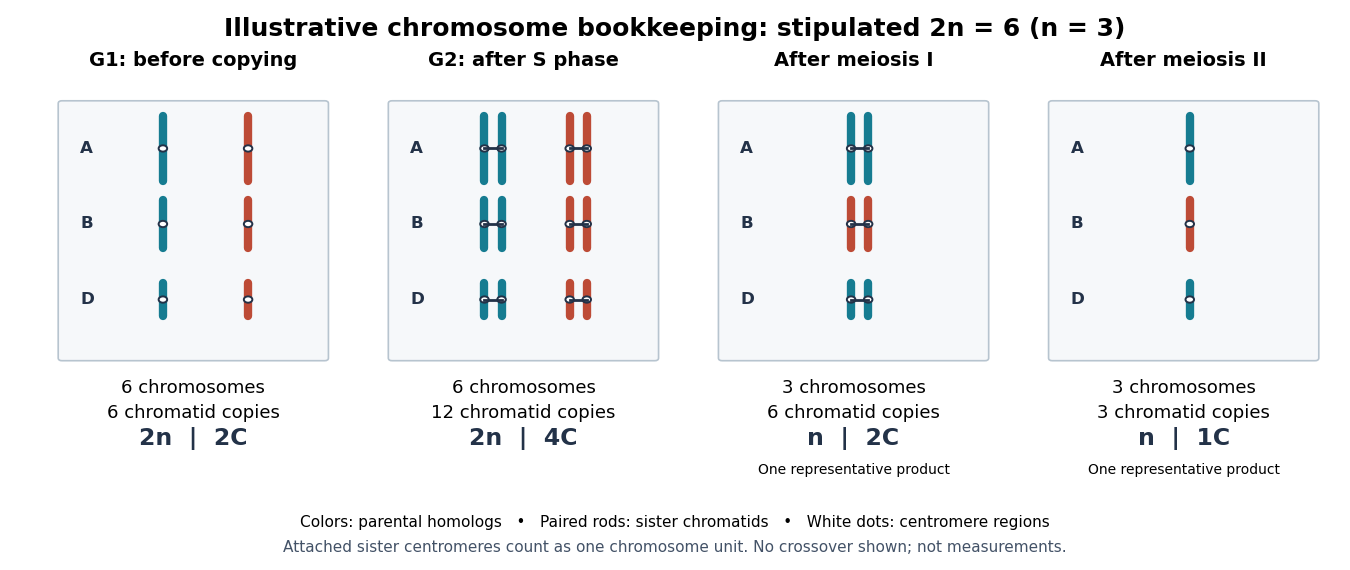
The arithmetic follows the allocation rules. DNA replication replaces each of six single copies with two associated sister chromatids: copies still grouped as six chromosomes. Meiosis I allocates one homologous chromosome of every type to each product: three replicated chromosomes, with copies. Meiosis II allocates one copy from each pair of sister chromatids to each final product: three single-copy chromosomes. Compare meiotic DNA content for the general symbolic bookkeeping. Chromosomal crossover can change the alleles on a chromatid without changing these counts when exchanges preserve material.
Keeping ploidy, chromosome count and Nuclear DNA content separate makes the beauty of meiosis explicit: copying supplies material for two divisions, while sorting determines which complete sets each product inherits. It also prevents interpreting a doubled DNA signal as evidence of an extra homologous chromosome set.
A haploid cell nucleus has one complete set of chromosomes. For the stipulated example, both products after meiosis I and products after meiosis II are haploid; their Nuclear DNA contents differ because the former retain associated sister chromatids. Haploid therefore does not mean “unreplicated”.[ref]
The Process of Meiosis. Biology 2e by Mary Ann Clark and others; §11.1, Telophase I and Cytokinesis, final two paragraphs; Meiosis II, opening paragraph
Diploid biological cells have two sets of chromosomes. In the ordinary one-locus inheritance model, a diploid genotype therefore contains two allele copies at each genetic locus.
Two homologous chromosomes of a given type are distinct inherited members of the two sets; the two sister chromatids of one replicated chromosome are its copied members. In the stipulated example, a diploid G2 phase cell nucleus has six replicated chromosomes, not twelve sets or twelve independently counted chromosomes.
Nuclear DNA content is the amount of DNA in a specified cell nucleus. Define relative to one unreplicated haploid set of the chosen species. It includes coding and non-coding DNA and excludes DNA outside the cell nucleus, such as a mitochondrion's genome. is an amount, whereas is a chromosome count; neither fixes the other across different species.
For an original numerical model, assign the three chromosome types unreplicated DNA amounts of 3, 2 and 1 arbitrary units. Then units: diploid G1 phase contains 12 units, G2 phase 24, each completed meiosis I product 12, and each completed meiosis II product 6. The totals and check conservation after copying. Equal chromosome counts alone would not justify equal DNA amounts if the sets had different sequence lengths.
How can an experiment measure the amount independently of chromosome counting? UCL's Cell Cycle Analysis by Propidium Iodide Staining, pp. 1–2, specifies a flow cytometric DNA-content assay. Washed biological cells receive cold 70% ethanol dropwise while vortexing, then at least 30 minutes on ice. After centrifugation and two washes, ribonuclease A removes RNA that would also bind the dye. Propidium iodide stains the preparation. A flow cytometry instrument such as the listed BD LSR II records individual-event fluorescence on a linear scale. Signal area versus height or width excludes doublets and clumps; acquisition is below 400 events per second, retaining at least 10,000 single-cell events. These are protocol settings, not measured results.[ref]
For a ploidy comparison, add a known diploid G1 phase reference processed with the same staining and detector settings, and an unstained background control. These are proposed comparison controls, beyond the protocol's clump-exclusion procedure. Proportional fluorescence then estimates relative Nuclear DNA content; it does not count chromosomes. A event could be a diploid G1 phase product or a replicated haploid product; could be replicated diploid material or an unreplicated four-set cell nucleus. Peaks alone therefore cannot establish ploidy or cell cycle stage without a reference and biological context. Uneven staining, residual RNA and unresolved doublets limit this inference; two particles can mimic one event.
Panmixia is random mating within a breeding population, without systematic choice by genotype or phenotype. In a homogeneous genetic model it makes the two parental gamete draws independent, yielding the Hardy-Weinberg equilibrium genotype probabilities and . It is a modelling assumption; assortative mating and population stratification are distinct ways a population can depart from it.
// Target: causal-inference.bigb
A mutation changes inherited genetic sequence. Under an infinite sites mutation model, every mutation occurs at a previously unmutated position, so mutations below the sample's common ancestor correspond to segregating sites.
More precisely, a mutation changes a genetic nucleotide sequence; in cellular organisms this is a DNA sequence. An altered sequence can be copied by DNA replication into descendant biological cells, changing their genotype whether or not an observable phenotype changes. Inheritance along a cell lineage does not require transmission to an offspring organism. In animals, germline mutations can enter offspring through gametes, whereas somatic mutations remain in body-cell lineages.[ref]
Mutation by National Human Genome Research Institute. Definition and Narration: DNA sequence change, germline transmission and descendants of somatic cells
A DNA lesion is damage to the physical DNA molecule, such as a damaged nucleobase or a broken strand. It need not become a lasting mutation: DNA repair can restore the original sequence. Conversely, a copied nucleotide substitution can leave an ordinary, correctly paired DNA duplex whose sequence differs from the ancestor. The distinction is between a damaged template and a changed inherited message, not simply between harmful and harmless effects.[ref]
Molecular Biology of the Cell, 4th edition by Bruce Alberts and others. Chapter 5, DNA Repair, Without DNA Repair, Spontaneous DNA Damage Would Rapidly Change DNA Sequences; Figures 5-46–5-49
Small mutations include nucleotide substitutions and indels. Larger changes can remove a gene, duplicate a chromosome region or rearrange its order. Genetic recombination can bring existing alleles together without creating a new nucleobase at the exchanged positions; the mechanism and the resulting sequence change are different questions. A molecular description of a mutation, its effect on a gene product and its effect on a phenotype are likewise three separate statements.
For an original consequence ledger, choose the coding strand segment with initiation at the first displayed codon. Use the standard genetic code, the same reading frame and suitable gene expression context throughout. Its messenger RNA has U in place of T, and the predicted amino acid chain is methionine–phenylalanine–glutamic acid residue, followed by a stop codon. This is a constructed coding segment, not an experimentally measured gene.
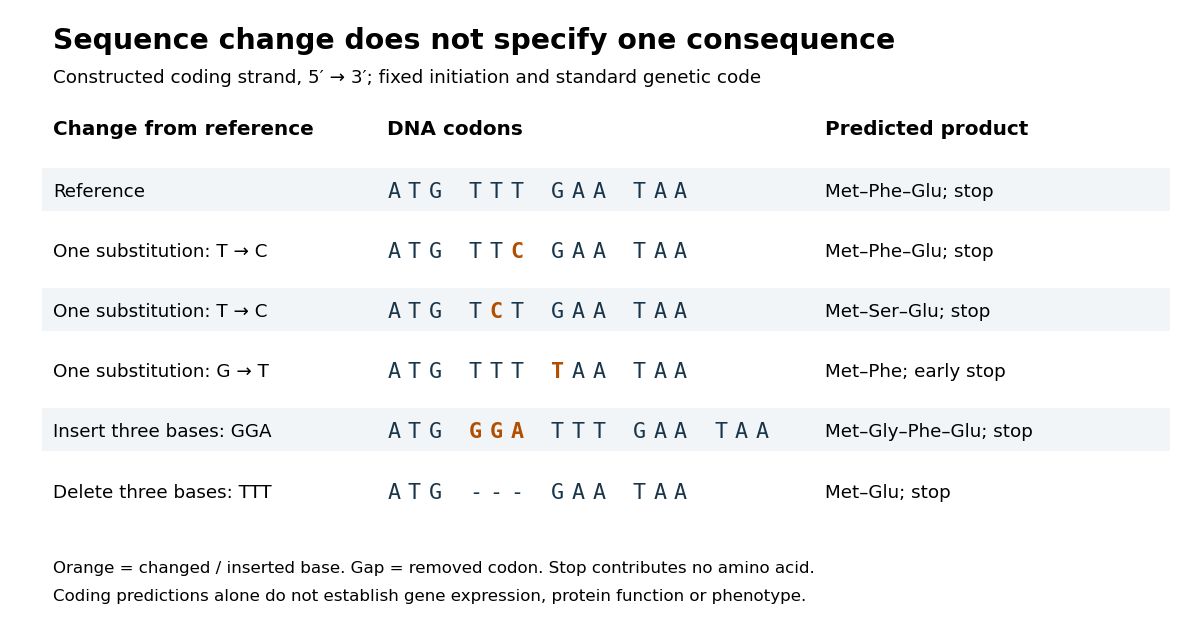
In the second row, position 6 changes from T to C, replacing TTT by TTC. Both corresponding RNA codons specify phenylalanine, so the predicted chain is unchanged. Changing position 5 from T to C instead gives TCT, whose RNA codon specifies serine. Changing position 7 from G to T gives TAA and therefore a stop codon before the original glutamic acid residue. Each is one nucleotide substitution, but their coding consequences differ. Even preservation of the amino acid chain does not guarantee unchanged gene expression or phenotype.
Insert GGA after ATG to add a glycine codon, or remove the complete TTT codon to remove phenylalanine. Both indels preserve the downstream reading frame because their lengths are three nucleotides. A one-nucleotide insertion at that location instead produces a frameshift mutation; the positional explanation and a worked regrouping appear under frameshift mutation. The ledger illustrates why interpreting a genetic variant requires its position and context, rather than just the label mutation.
Mutation supplies new inherited variation on which natural selection can act. The Luria-Delbrück experiment makes the distinction unusually visible: natural selection reveals resistant descendants, while the timing of a prior mutation determines how many descendants are available to reveal. This connects an invisible change in one biological cell to a visible pattern across cell cultures.
A point mutation affects a single base pair. Terminology varies: the broad usage includes a one-base pair insertion or deletion as well as a nucleotide substitution. Describing the actual sequence change avoids this ambiguity.[ref]
Point Mutation by National Human Genome Research Institute. Definition: a single base pair added, deleted or changed
A nucleotide substitution replaces a nucleotide at a specified position without changing sequence length. In a fixed reading frame, a single substitution can preserve an amino acid assignment, change it or introduce a stop codon; the mutation ledger exhibits all three possibilities.
An indel is an insertion or deletion of nucleotides relative to a specified reference nucleotide sequence. Its length and location matter: within a coding region, a length not divisible by three changes the downstream reading frame, producing a frameshift mutation. A gene deletion is a larger removal defined by the gene it eliminates.
A germline mutation occurs in the lineage that makes gametes and can therefore be inherited by an offspring organism. Transmission depends on whether the affected lineage actually contributes a gamete to that offspring. Compare somatic mutation.
A somatic mutation occurs in a body-cell lineage outside the germline mutation route. Its descendant biological cells can inherit it through DNA replication, even though it is not transmitted through gametes. Thus heritability within a cell lineage differs from inheritance between sexually reproducing organisms.
In 1943, Salvador Luria and Max Delbrück grew separate Escherichia coli B cell cultures from small equal inocula, without the challenging bacteriophage. They used nutrient broth or an asparagine–glucose cell culture medium. On nutrient agar plates, they first spread excess bacteriophage and then the bacterial sample centrally, leaving an outer margin. After incubation, resistant biological colonies provided the readout; counts were usually made at 24 and 48 hours. Their control plated repeated samples from one shared culture. Independently grown cultures varied much more than this sampling comparison. That contrast supported resistant lineages arising before challenge: early mutations could produce many resistant descendants before natural selection revealed them.[ref]
Mutations of Bacteria from Virus Sensitivity to Virus Resistance by Salvador Luria and Max Delbrück. pp. 501–504, Material and Methods; Experimental, plating reliability, Table 1 and independent cultures, Table 2
This was evidence about the timing of heritable resistance, not DNA sequencing of the responsible genes. It does not establish uniform mutation rates or exclude environmentally induced mutations; the paper itself discusses physiological dependence and delayed expression.[ref]
Mutations of Bacteria from Virus Sensitivity to Virus Resistance by Salvador Luria and Max Delbrück. pp. 505–507, discussion of excess variation, physiological state, delayed resistance and genetic relatedness
Now construct a deliberately small mathematical model of the timing effect. Start with one sensitive biological cell at generation . Every biological cell divides into two in each of five synchronous rounds, with no death or growth difference. There are biological cells immediately after round , ending with . In each scenario, exactly one newly formed daughter changes to resistance immediately after round ; its descendants inherit resistance without reversion or further mutations. Resistance is expressed immediately, and the final challenge allows every resistant biological cell, and no sensitive one, to form one separate biological colony.
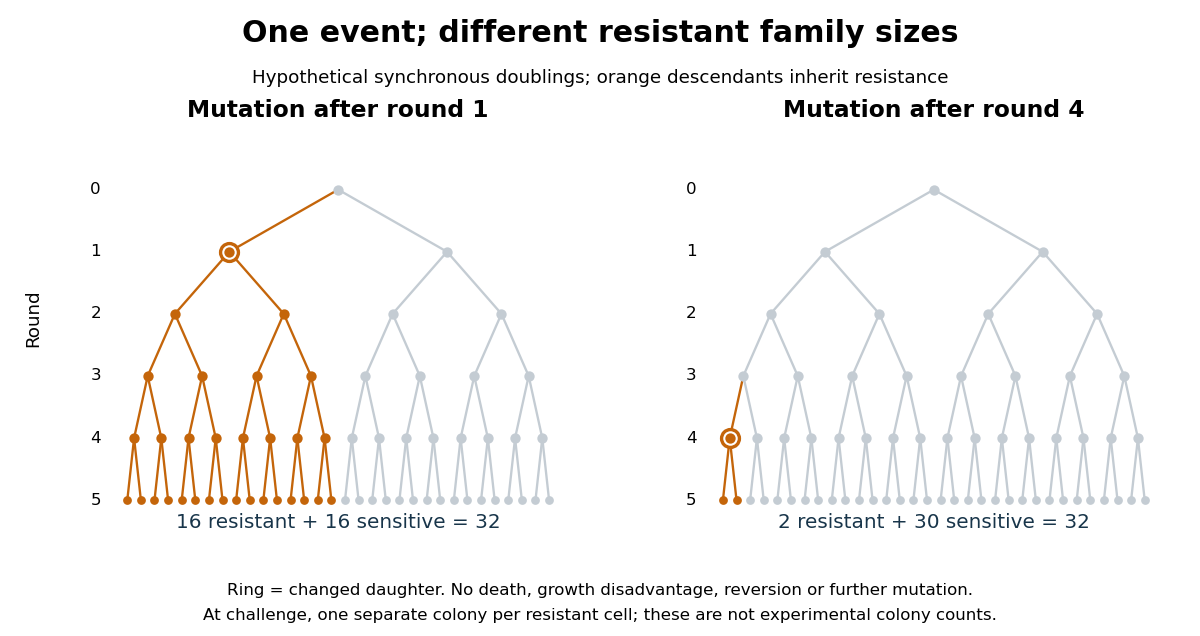
The descendant count obeysAt the moment of the event there is one resistant biological cell; each remaining round doubles its descendants. This proves the formula by repeated multiplication, with terminal case . An event after round 1 gives resistant and 16 sensitive biological cells; an event after round 4 gives resistant and 30 sensitive biological cells. Both scenarios contain one mutation event. A culture with no event gives zero resistant biological colonies under these assumptions. The difference is family size, rather than the number of events.
For comparison, suppose each of the 32 final sensitive biological cells independently acquires resistance only on challenge, with probability and no subsequent multiplication before counting. Then the resistant count has a binomial distribution, with expected value and variance . This alternative mathematical model has no pre-challenge resistant family to amplify. Its independent trials are an assumption of the comparison, not a consequence of using physically distinct biological cells. The clonal scenarios explain how a jackpot can occur; they do not assign probabilities to the event times or estimate a real mutation rate.
// Target: biology.bigb
A gene deletion removes a chosen gene sequence from a genome. An experimental gene deletion tests the consequences of that removal in a specified genetic background and environment; lack of an observed phenotype does not prove that the gene has no function under other conditions.
A mutation rate measures the frequency of mutation events per specified unit, such as per chromosome segment per generation. Its units and the population-size convention must be specified. If time is measured in generations and , each ancestral lineage has mutation intensity per unit of coalescent time.
A chromosome carries genes and other genetic material. A haplotype records the alleles carried on one chromosome at specified genetic loci.
In a typical eukaryotic cell nucleus, an unreplicated chromosome comprises one long double-stranded DNA molecule with associated proteins; a replicated chromosome comprises two associated sister chromatids. It need not be X-shaped: that familiar outline depicts a condensed, replicated state.[ref]
Cell Division. Biology 2e by Mary Ann Clark and others; §10.1, Genomic DNA; Eukaryotic Chromosomal Structure and Compaction, especially Figure 10.4 and final paragraph
For these ordinary centromere-bearing chromosomes, count by centromere units before separation: the paired sister centromere regions count together as one replicated chromosome. Once sister chromatids separate in anaphase of mitosis or meiosis II, each becomes a daughter chromosome. Thus the undivided anaphase biological cell in the mitotic example transiently contains twelve daughter chromosomes, but each pole receives six and each completed daughter cell nucleus remains diploid. State the counting compartment and stage; summing both poles is not the ploidy of one daughter.
Chromosome segregation allocates chromosomes to the products of division. Mitosis separates sister chromatids, preserving ploidy in completed daughter cell nuclei. Meiosis I separates homologous chromosomes with their sister chromatids still associated, reducing diploid to haploid ploidy; meiosis II separates the sister chromatids. Only the first of the two divisions reduces the number of complete sets.[ref]
The Process of Meiosis. Biology 2e by Mary Ann Clark and others; §11.1, introduction comparing mitosis and meiosis; Telophase I and Cytokinesis; Meiosis II
For example, correct chromosome segregation of the stipulated three homologous chromosome pairs gives each meiosis I product one , one and one , each replicated. Giving one product both members and the other none would preserve the total DNA across products while failing to give each a complete set. Conservation of material alone does not prove correct chromosome segregation.
Articles were limited to the first 100 out of 234 total.
Articles by others on the same topic



High level DNA studies? :-)