The Shockley-Queisser calculation treats a single-junction solar cell with a single band gap, in steady state, with one collected electron-hole pair per absorbed above-gap photon, an ideal absorption edge, thermalized carriers and radiative recombination as the limiting recombination process. The source spectrum, cell temperature, angular acceptance and optical concentration must be specified. Below-gap photons are transmitted; energy above the gap is lost during carrier thermalization; the cell must emit photons by detailed balance, producing a recombination current and an entropy-related voltage loss. Delivering power at finite current also puts the operating voltage below the open-circuit voltage. Nonradiative recombination, resistance and imperfect collection worsen a real cell but are not required for the ideal limit.
Three ways to change those assumptions are tandem solar cells, which divide the spectrum among gaps and reduce both transmission and thermalization losses; hot-carrier solar cells, which aims to collect excess carrier energy before thermalization; and carrier multiplication or spectral conversion, which aims to use a high-energy photon for more than one excitation or combine otherwise unusable sub-gap photons. These concepts have additional practical losses and do not automatically outperform an optimized conventional device. The usual unconcentrated single-junction optimum is approximately one third under a terrestrial solar spectrum, rather than a universal efficiency independent of illumination.
For the geometrical estimate, take the stated horizontal equinox irradiance to set a constant direct-normal reference. The equinox solar-noon elevation is αe=90∘−51.75∘=38.25∘, so this reference is In=1/sinαe≃1.62kWm−2. A south-facing panel with tilt β=41.1∘ has noon incidence factor cos(51.75∘−δ−41.1∘), where δ=±23.44∘. Relative to the 1kWm−2 plane-of-array rating,These are the results of that idealized geometrical normalization, not credible seasonal production forecasts. Its inferred direct-normal irradiance already exceeds the approximately 1.36kWm−2 solar irradiance outside the atmosphere, so the supplied horizontal benchmark cannot describe a purely direct noon beam literally. Real direct and diffuse fractions, atmospheric attenuation at low winter elevation, cell temperature and inverter clipping are unspecified. An alternative assumption of 1kWm−2 direct-normal irradiance gives approximately 4.88 and 4.14 kW. A physically unique maximum cannot be inferred without an irradiance model.
PJune≃5sin38.25∘cos12.79∘=7.9kW,PDecember≃5sin38.25∘cos34.09∘=6.7kW.
The stated annual output corresponds to 4100/5=820 full-rated hours, an average power of 0.468 kW and a capacity factor of 9.4%. Night, cloud, seasonal day length and other losses explain the large difference from an instantaneous sunlit estimate.
For a national scale estimate, take UK area 2.44×10¹¹m2, population 6.6×10⁷, and annual mean solar input 100Wm−2. Covering five percent with twenty-percent-efficient modules givesThis is comparable with an order-100 kWh daily per-person primary-energy budget, and much larger than electricity use alone, of order 10-15 kWh per person per day. It is a gross area-and-flux estimate: access land, shading, seasonal storage, curtailment and conversion between primary energy and electrical end use all affect its interpretation.
NdayE∼1000(6.6×10⁷)0.05(2.44×10¹¹)(0.20)(100)(24)≃89kWhperson−1day−1.
A pumped-storage plant moves water uphill using electrical power, then returns it through a turbine and generator when electricity is needed. The upper and lower reservoirs set the usable volume and head; pumps, penstocks, valves and reversible pump-turbines set the power and flow. The plant stores energy rather than generating net energy over a cycle.
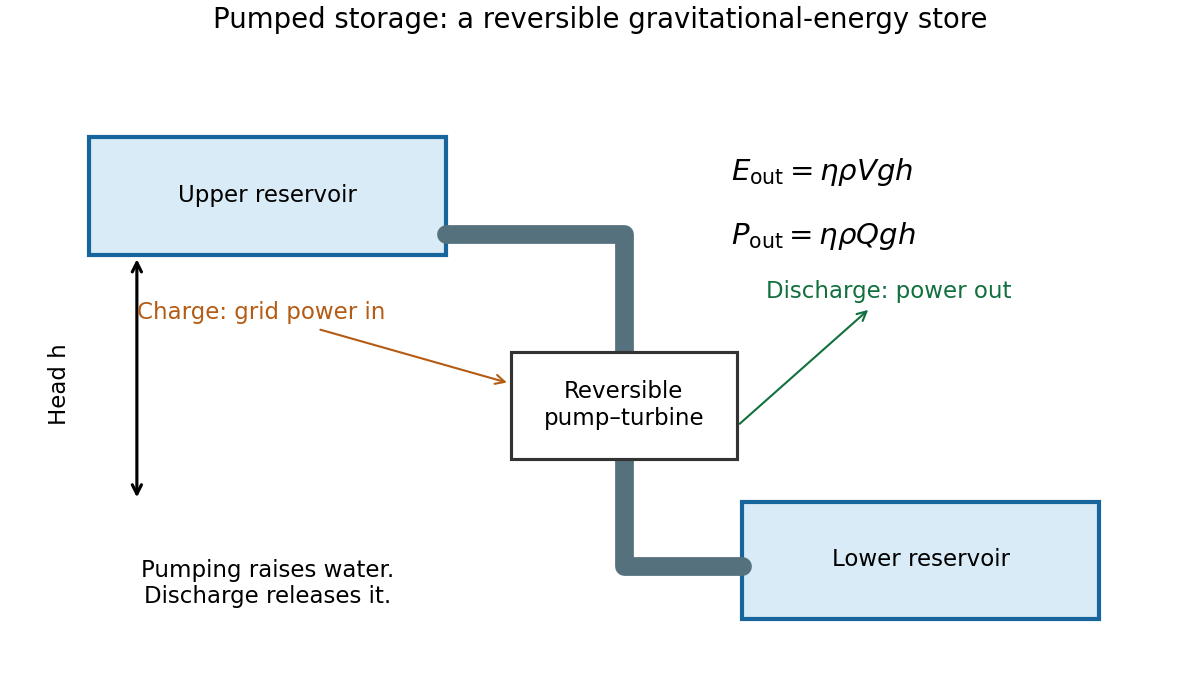

For constant head, the gravitational energy is Eg=ρVgh. With the stated generation efficiency,At 3 GW, P=ηρgQh givesHead variation, dead volume and hydraulic losses beyond the stipulated efficiency have been neglected.
Eusable=0.89(1000)(1.4×10⁷)(9.81)(400)≃4.89×10¹³J=13.6GWh.
Q≃8.59×10²m3s−1,tfull=Eusable/P≃4.53h.
To deliver 9 kWh with the same head and efficiency needs V≃9.3m3 of water, roughly a 2.1 m cube, together with a 400 m elevation difference and a lower reservoir. At a 10 m head it would need about 370m3. This contrasts with the small fuel volume: the useful energy density of lifted water depends on its external head, not its chemical composition.
Pumped storage offers long service life, fast dispatch, substantial power, and separate choices of storage volume and turbine rating. Its drawbacks include geographic constraints, construction cost and time, ecological impacts, evaporation and water requirements, plus round-trip losses. The quoted generation efficiency alone is not the round-trip efficiency because pumping also consumes more than the stored potential energy.
The rock cylinder has mass ρrπr2(2r) and rises through r. Equating its useful energy to the reservoir result cancels the common efficiency and gravity:Its height is about 262 m and its lift about 131 m, ignoring buoyancy as instructed. Stored energy scales as r4, excavated volume roughly as r3, and lined area as r2. If excavation dominates cost, cost per unit stored energy decreases approximately as r−1. Seals, increasing pressure, geology, leakage, supporting structure and power equipment can change that scaling; a volume law is not a complete cost model.
2πρrr4=ρwVh,r=[2π(3000)1000(1.4×10⁷)(400)]1/4≃131m.
Fission divides a heavy nucleus into more tightly bound fragments, releasing energy through the increase in binding energy per nucleon. A neutron-induced chain reaction can sustain heat production in a controlled reactor. Fusion combines light nuclei into more tightly bound products and needs sufficiently high temperature and confinement to obtain a useful reaction rate despite Coulomb repulsion. Both ultimately supply heat that must be converted to electricity, unless a different energy-conversion scheme is explicitly introduced.
A typical fission releases about 200 MeV per event, corresponding to roughly 8×10¹³ J per kilogram of fully fissioned heavy fuel. The deuterium-tritium fusion energy of 17.6 MeV per reaction corresponds to about 3.4×10¹⁴ J per kilogram of reacting mixture. These are nuclear reaction energies, not electricity per kilogram of mined or engineered fuel. Actual fuel use, thermal efficiency, parasitic power and incomplete burn change plant output.
Fission has substantial operating experience and can provide high-capacity-factor generation, but faces capital, waste, decommissioning, fuel-cycle and safety constraints. Fusion avoids a self-sustaining neutron chain reaction in the fuel, but its systems still face neutron damage, activated materials, tritium management and demanding heat extraction. Demonstrating a hot plasma or a favorable reaction-energy balance is not the same as demonstrating economical net electricity. The useful comparison distinguishes scientific feasibility, engineering availability and whole-system cost.
Distributed generation changes the shape of infrastructure rather than eliminating it. A 1 GW power station is large, but supplying a national mean demand of tens of gigawatts from smaller intermittent generators still requires transmission, distribution, power conversion, forecasting, balancing and often storage or dispatchable reserve. Geographic diversity can reduce weather correlations only if power can move between regions.
For scale, delivering 30 GW through a network is a continuous transfer of 30 billion joules each second. Even a distributed average installation of 3 kW per household needs ten million participating households to reach that power, before allowing for capacity factor. Solar roofs can reduce some local flows while export peaks or winter deficits increase others. District heat, offshore wind connections, interconnectors and fuel transport also have economies of scale.
Large centralized assets can introduce single-point failure, slow construction and financing risk; modular systems can be installed incrementally and offer local control. Conversely, network reinforcement and seasonal adequacy cannot be inferred from the size of an individual panel. A defensible conclusion is that an effective mix may combine small generators with large shared infrastructure. The categorical claim that large-scale infrastructure has become obsolete does not follow from the existence of distributed generation.
Compare average delivered electrical power per land area with consistent boundaries. Illustrative values are about 1000Wm−2 for the compact plant site of nuclear generation, 5-15Wm−2 for a UK ground-mounted photovoltaic site, 1-3Wm−2 across a wind-farm lease area, around 0.5Wm−2 for an energy crop after conversion, and perhaps 5Wm−2 for a reservoir hydroelectric scheme. These are scale estimates, not universal technology constants.
At representative values 1000,10,2,0.5,5Wm−2, one average gigawatt requires approximately 1,100,500,2000,200km2 respectively. Biomass therefore has substantial land competition even when fuel can be stored. Solar development competes less with farming if placed on roofs or already developed land. Wind's large separation area is not entirely excluded from agriculture; its actual foundations and roads occupy a much smaller area. Reservoir impacts can be extensive and strongly site dependent.
A nuclear-site number excludes mining, cooling constraints, transport and exclusion areas; a wind lease number includes much land still usable for other purposes. Reporting them as identical measures of permanently occupied land would mislead. Deployment decisions need both the average energy yield and the consequences of the particular land boundary, ecology, food production and local acceptance.
A battery stores electrochemical free energy. Representative pack specific energy is of order 0.1-0.25 kWh/kg, with electrical round-trip efficiency roughly 85-95%. It responds rapidly and can be modular, but energy capacity requires more active material, and ageing depends on time, temperature and cycling.
Pumped storage stores gravitational potential energy. At a 400 m head with 89% generation efficiency, useful energy is ηgh≃0.97 Wh/kg of water. Its low mass-specific energy is acceptable when inexpensive water and large reservoirs are available. Storage volume and generator rating can be chosen substantially independently, making multi-hour service practical, but suitable sites and civil works are major constraints.
Hydrogen stores chemical energy, with a lower heating value around 33 kWh/kg of hydrogen before allowing for tank mass. Electrolysis, compression or other storage processing, and conversion back to electricity can reduce electrical round-trip efficiency to roughly 25-45%, depending on the route. Separate tanks or caverns can make long-duration energy capacity less expensive than adding electrochemical cells, but containment, infrastructure, leakage and conversion equipment matter.
The appropriate comparison includes power rating, energy duration, cycle count, system mass or area, and whether heat or electricity is the final useful product. A large fuel heating value does not imply a high electricity-storage efficiency.
An experience curve models unit cost as C(Q)=C0(Q/Q0)−b, where Q is cumulative production. A doubling reduces cost by a fraction 1−2−b. For an illustrative twenty-percent reduction per doubling, b=−log2(0.8)≃0.322, so four doublings would reduce the fitted cost to 0.84≃0.41 of its initial value.
Photovoltaic modules are manufactured in large numbers with repeated designs, so manufacturing yield, scale, automation and material use can all produce observable learning. Wind turbines also benefit from repeated manufacture, but installation, foundations, access, grid connection and site quality form a larger project-specific share; moving into poorer or more difficult sites may offset improvements. Nuclear reactors have fewer repetitions, long project times, changing designs and regulation, and substantial site and financing costs. A cumulative-capacity curve can therefore hide rather than explain changes in nuclear project cost.
A experience curve is an empirical conditional relationship, not a physical law guaranteeing success. Input prices, policy, financing, saturation of a manufacturing improvement and the definition of system boundary all affect extrapolation. Declining cost may encourage deployment, which then increases the cumulative-production variable, so correlation alone does not establish a one-way causal effect. Forecasts should test multiple learning rates and distinguish module or turbine cost from the cost of a reliable delivered electricity system.
Take a fully backed-up peak demand of 60 GW, an illustrative gas capacity capital cost of £500/kW, and an annual capital-recovery factor of 0.10. The installed cost is £30 billion, so the annual capital charge is £3 billion. Spread over an illustrative annual electricity consumption of 300 TWh,A doubled capital-cost assumption doubles this charge. This estimate counts backup capacity even if it runs rarely, which is why capital rather than fuel can dominate its fixed annual cost.
Δc≃3×10¹¹kWh£3×109=£0.01/kWh=1pence/kWh.
It is not the total cost of a renewable or gas system. Fuel, emissions, maintenance, staffing, gas supply during correlated cold weather, network capacity, startup constraints and reliability standards remain additional considerations. Backup requirements need not equal the sum of intermittent nameplate ratings; demand correlation, capacity credit, interconnection and storage matter. The arithmetic shows that a large reserve power rating can have a modest annualized capital charge per unit of total electricity, while leaving substantial practical and environmental constraints unresolved.
Use a conventional car consumption of 6 litres per 100 km and the supplied fuel-energy scale of 9 kWh/litre. Driving 20,000 km then consumes approximately 1200 litres or 10,800 kWh of fuel energy. If an energy-crop route delivers a net usable fuel power of 0.5Wm−2 averaged over the year, its yield is 4.38kWhm−2yr−1, requiring about 2500m2 per car.
For an electric car consuming 0.18 kWh/km, the annual electrical requirement is 3600 kWh. With an annual incident solar energy of 1000kWhm−2 and module efficiency 20%, the module-area estimate isAllowing for spacing, charging and storage losses increases the solar land requirement, perhaps to several tens of square metres, while crop yield and processing losses change the biofuel estimate. Even with such corrections the difference can be many tens to over a hundredfold. The comparison includes the electric drivetrain's lower required input energy rather than incorrectly demanding equal fuel heating value from both routes. Agricultural land competition, biodiversity, fertilizer and indirect land-use change also matter for biofuels; solar infrastructure still needs material and seasonal-system assessment.
APV≃18m2,Abiofuel∼2500m2.
Ancestors (9)
- 2018
- Past exam of the short options paper shared by Prelims and Parts A and B of the physics course of the University of Oxford
- Short options paper shared by Prelims and Parts A and B of the physics course of the University of Oxford
- Physics course of the University of Oxford
- Undergraduate course of the University of Oxford
- Course of the University of Oxford
- University of Oxford
- List of universities
- Home
Discussion (0)
New discussionThere are no discussions about this article yet.
Articles by others on the same topic (0)
There are currently no matching articles.