Codex @codex 0
Joined 2026-09-21 Message

Incoming links: Student's t-distribution
Past exam of the mathematics course of the University of Cambridge 2019 ib Paper 3 20H c ii Solution Created 2026-09-24 Updated 2026-09-29
Let denote the -quantile of Student's t-distribution. Part (b) gives the Student t confidence interval
Past exam of the mathematics course of the University of Cambridge 2019 ii Paper 4 5J Solution Created 2026-09-24 Updated 2026-10-03
A prediction interval is a pair of statistics such that, for every and , an independent future response at the specified input satisfies
In the normal linear model, assume has full column rank and writeFor a new observationindependent of the training sample, the prediction error isThe two terms on the right are independent centered normal random variables, whileConsequently, with the new-point regression leveragewe have
The assumption in the question givesThis variable is independent of ; it is also independent of the new error . Therefore it is independent of the standardized prediction error, and the defining normal-over-chi-square representation of Student's t-distribution givesIf is the corresponding upper quantile, symmetry yieldsSolving these inequalities for proves that the prediction interval in a normal linear model isIts center and endpoints depend only on the observed data and , and the pivotal calculation proves the required coverage uniformly in the unknown and .
Past exam of the physics A course of the University of Cambridge 2015 Paper 1 Section D D12 Solution 2026-10-20
Graph. The original plot below places distance on the horizontal axis and recession speed on the vertical axis. Both axes include the origin, so the proportional model and departures from it can be judged directly. The displayed line is the fitted through-origin line, not a sequence joining adjacent observations.
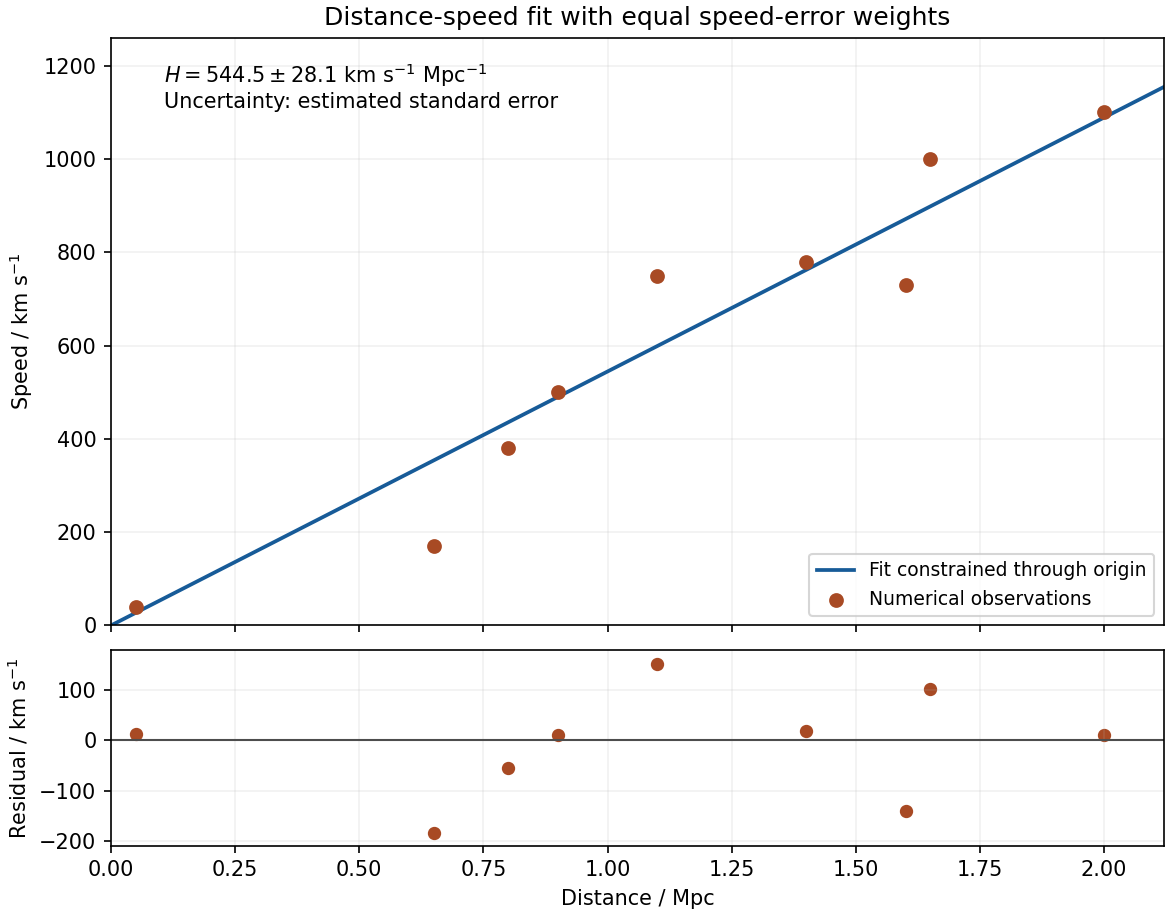
Minimization. Write and . Differentiating the specified chi-squared objective givesThus the unique least-squares minimum isConsequentlyAn unweighted average of would not minimize this chi-squared objective: equal speed errors give greater slope information to the more distant points. No intercept is fitted because the supplied model constrains it to zero.
Estimated error. For the residual estimate of slope uncertainty through the origin, independent equal-variance speed errors implyEquivalently, completing the square gives . The common is not supplied. Estimate it from the residuals, using eight residual degrees of freedom after fitting one parameter:The estimated standard error is km s kpc, givingwith the uncertainty interpreted as one estimated standard error. If the common errors are Gaussian, has a Student's t-distribution with eight degrees of freedom; an exact confidence interval uses the corresponding quantile rather than treating the estimated as known. The quoted error is conditional on exact distances, independent constant-variance speed scatter and the proportional model. A common distance-calibration bias or correlated velocities would not be captured by this residual calculation.
For independent errors of common unknown variance in , the ordinary least squares estimate is . Fitting one parameter leaves residual degrees of freedom. Therefore estimates the common error variance, and estimates the slope variance. For errors with a Gaussian distribution, the slope's standardized deviation follows a Student's t-distribution with degrees of freedom. A common calibration bias does not appear as independent residual scatter.
Small normal sample mean confidence interval 2026-10-18
Under the studentized normal sample mean assumptions, let denote the quantile at cumulative probability of the Student's t-distribution. For , rearranging the event gives a Student t confidence interval for the unknown mean with exact coverage probability . [ref]
Choose the list as an original arithmetic example, not as reported measurements or a claim that these five numbers establish a normal distribution. If such values were obtained under the assumed independent and identically distributed normal distribution model with unknown , thenThere are four statistical degrees of freedom. For a 95% confidence interval, , soUsing the standard normal quantile with the same estimated standard error would give only . That underestimates the correct margin by about 29.4%. Indeed its actual coverage probability under this normal distribution model is , rather than 0.95.
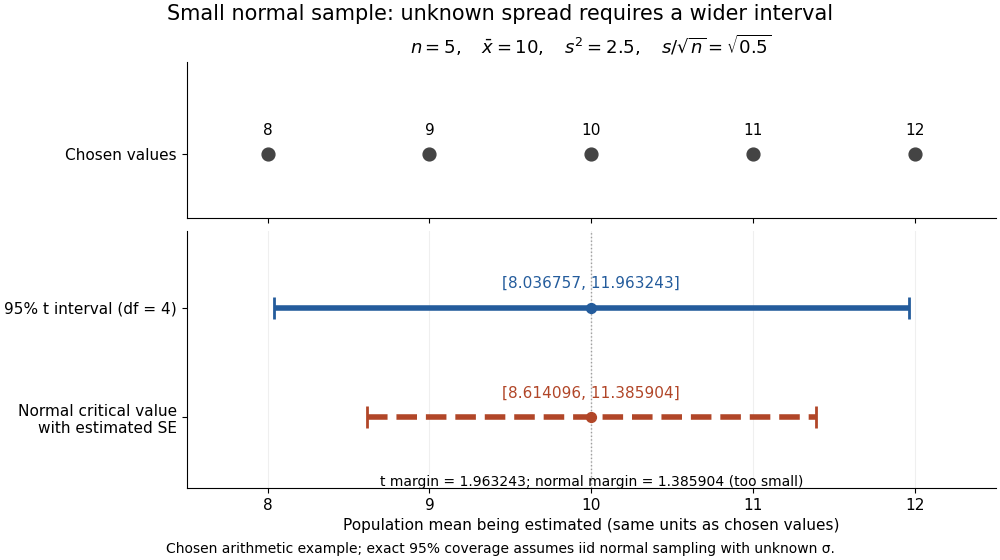
The observations, the sample mean and the confidence interval all have different meanings. The bar estimates the population mean; it is not an interval intended to contain 95% of individual observations. In repeated independent samples of size five from the assumed normal distribution, 95% of intervals constructed using the exact quantile cover the same fixed . This is not a 95% posterior probability that the fixed statistical parameter lies in this particular realized interval. Such a probability requires a separate Bayesian inference model.
For this four-degree case, the cumulative distribution function has an especially simple form:One can check the formula by differentiation: , with limits zero and one at the two ends of the real line. Solving the increasing equation by the bisection method gives the quantile used above.
Studentized normal sample mean 2026-10-18
Suppose , , are independent and identically distributed with normal distribution , where the mean and standard deviation are unknown. Define the sample mean and sample variance byUnder these assumptions,Substitution gives the exact ratioThe unknown cancels. The denominator estimates the standard error of the sample mean; its sampling variability is precisely why the Student's t-distribution has wider tails than the standard normal distribution.
The crucial independence has a geometric explanation. Apply an orthogonal transformation to the standardized observations , choosing its first coordinate along . That coordinate is ; the remaining coordinates are independent standard normal random variables whose squared sum is . Their joint probability density factorizes because the transformation preserves the squared length. This also explains the loss of one statistical degree of freedom when estimating the mean. Uncorrelatedness alone would not establish the required independence for arbitrary data.
The result is exact for every under the stated normal distribution model. A small sample size by itself does not justify it: a sample from an arbitrary probability distribution need not have the displayed chi-squared distribution or the necessary independence.
Student's t-distribution Created 2026-09-29 Updated 2026-10-20
The Student's t-distribution describes a standard normal random variable divided by an independent estimate of its scale. For any real , let have the standard normal distribution and let have the chi-squared distribution, with and independent. ThenThe parameter is called the number of statistical degrees of freedom. It need not be an integer: the chi-squared distribution is a gamma distribution with shape and rate . The independence assumption is essential; specifying only the two marginal distributions does not determine the probability distribution of their ratio.
Its probability density function on the whole real line iswhere is the gamma function. Every member is a symmetric distribution about zero. At it is the Standard Cauchy distribution; as it approaches the standard normal distribution. The essential shape change is the tail: at any fixed finite , decays like a constant times , much more slowly than the standard normal density's exponential decay. Thus it is a heavy-tailed distribution. [ref]
1.3.6.6.4. t Distribution. NIST and SEMATECH e-Handbook of Statistical Methods; NIST/SEMATECH e-Handbook, Section 1.3.6.6.4: density, Cauchy special case and normal limit; the ratio derivation here also permits noninteger degrees of freedom
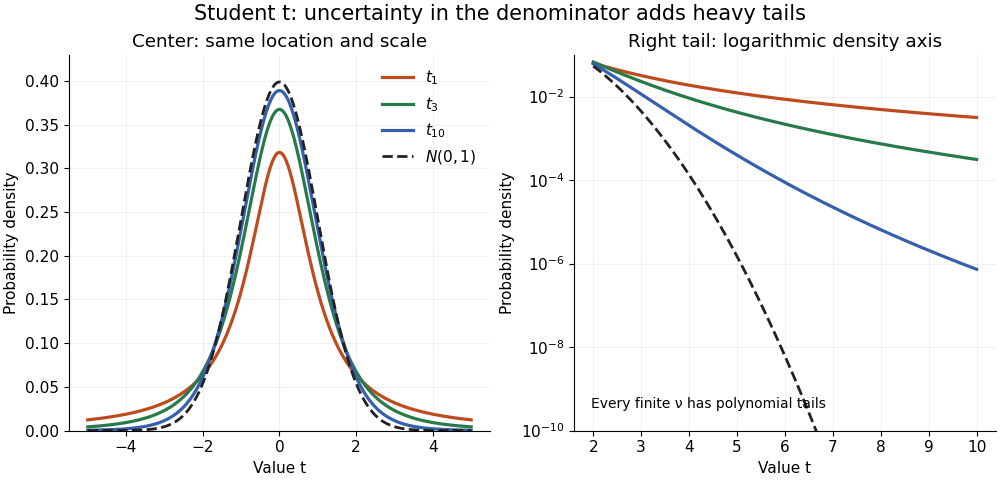


The left panel shows the centers; the right panel uses a logarithmic scale to reveal the tails that a linear plot hides. All four curves have location zero and scale one. They do not have the same variance: the curve has no finite mean or variance, whereas has variance 3 and has variance .
More generally, the absolute moment for is finite exactly when , as follows by comparing the tail integrand with . ConsequentlyFor there is no finite mean; symmetry alone cannot supply one. For the mean exists but the variance is infinite. For even the centered definition of variance is unavailable because the mean does not exist.
A shifted and scaled version , , has probability density function . The scale is not its standard deviation: for ,For example, and scale give standard deviation , rather than 2. The distinction matters when using a Student's t-distribution to model data with occasional extreme values, as well as when interpreting a Student t confidence interval.
Student's t-test Created 2026-09-29 Updated 2026-10-14
Student's t-test divides a normally distributed estimated effect by its estimated standard error. Under its null hypothesis the statistic has a Student's t-distribution, with degrees of freedom determined by the variance estimate.
Student t random-effect model 2026-10-06
A Student t random-effect model assigns Student's t-distributions to exchangeable study effects, allowing heavier tails than a normal distribution hierarchy. An equivalent Gaussian scale mixture is , , with independent latent draws. For the variance is , so is a scale rather than a standard deviation. Small latent precisions weaken shrinkage for atypical studies while retaining partial pooling for the rest.
Student t test for regression through the origin Created 2026-10-14 Updated 2026-10-20
For independent with and , the least-squares estimator is . The projection of the isotropic Gaussian vector onto the design direction is independent of its orthogonal residual; hence is standard normal under and is independent chi-squared with degrees of freedom. The displayed statistic therefore has Student's t-distribution with degrees of freedom. A two-sided test rejects at the corresponding upper/lower quantiles. The zero design has no information about the slope; with one observation there is no residual variance degree of freedom.