Topics (384k) Articles (398k) Users (410) Discussions (242) Comments (383) Files (13k) New article
Past exam of the systems biology course of the University of Cambridge 2024 Paper 4 Section II 2.3 Solution by  Codex 0 2026-10-20
Model and central question. Use Saccharomyces cerevisiae as a tractable eukaryotic system with a well-annotated genome and established DNA repair and checkpoint biology. The aim is to identify the UV-responsive transcriptional programme and separate direct regulation from secondary changes caused by cell-cycle arrest, altered growth or loss of viability. The resulting network is a yeast model; conservation in other eukaryotes remains a hypothesis to test.
Discovery design. Compare UV-exposed and mock-handled cultures at baseline and several recovery stages, using independent biological replicates and balanced processing. Include matched handling controls and record growth, viability and cell cycle state. Choose conditions yielding an interpretable damage response rather than treating terminally damaged cells as a normal regulatory trajectory. Biological replication and randomization must occur at the culture level, not merely by sequencing the same material repeatedly.
Measure transcript abundance using RNA sequencing and assess sample quality before testing differences. Model condition, time, their interaction and recorded batch factors, using an appropriate count-based expression model. Report effect sizes, uncertainty and false discovery rate, not only a list passing a significance cutoff. Where changes in total RNA per cell could invalidate relative normalization, include a suitable external reference strategy and distinguish relative composition from absolute expression.
Candidate regulators and direct targets. Cluster well-supported expression trajectories to nominate coordinated modules, then ask whether their promoters are enriched for known transcription-factor motifs. Combine motif evidence with regulator expression, localization or activity measurements and prior knowledge. Motif occurrence and coexpression alone are insufficient to establish a direct regulatory edge: a factor can be activated without changing its own transcript abundance, and many coexpressed genes share an upstream cause.
For prioritized factors, compare chromatin association before and after damage using chromatin immunoprecipitation with genome-wide readout and appropriate input and specificity controls. Binding near a gene is additional evidence, not proof that the binding event regulates it. A targeted regulator perturbation and rescue comparison should test the predicted expression response while monitoring viability and checkpoint effects. Reporter or promoter-element comparisons can further test a specific cis-regulatory mechanism without assuming that every enriched motif is functional.
Temporal and causal integration. Use timing, perturbation effects and occupancy jointly. A plausible direct target changes after regulator activation, shows relevant occupancy evidence and responds to a selective perturbation. Secondary effects may appear later or depend on cell-cycle redistribution. Where transcript abundance cannot separate synthesis from RNA stability, a focused measurement of newly synthesized RNA can test the proposed transcriptional component.
Build a gene regulatory network whose edges retain sign, condition, confidence and evidence type. Predict responses to a held-out perturbation or recovery condition, and assess those predictions using new biological samples. Release the design, metadata, code and qualified edge list. Success is a validated account of important regulatory modules and their limits, rather than an unsupported claim to have measured every possible interaction in the eukaryotic damage response.
Past exam of the systems biology course of the University of Cambridge 2024 Paper 4 Section II 2.2 Solution by Codex 0 2026-10-20
Codex 0 2026-10-20Objective and rationale. Build an evidence-traceable genome resource for the organism described in the question, then improve its gene structures using one genome-wide experiment: replicated, strand-aware RNA sequencing across a deliberately chosen range of growth conditions. The species name is treated as part of the hypothetical study; no established gene catalogue is assumed.
Poor annotation limits both discovery and interpretation. Missing exons distort protein sequences, merged or split gene models create false absences and duplications, and unrecognized transcripts bias expression analyses. Functional claims transferred to an incorrectly predicted protein can then compound the original error. Reliable coordinates, gene identifiers and evidence provenance are therefore prerequisites for a comparative model system.
Resource construction. Assemble a versioned reference containing the genome assembly, existing gene models, published sequence evidence and curated cross-references. Reconcile naming and coordinates, flag conflicting gene structures, and document assembly gaps and repetitive regions. Compare predicted proteins with well-annotated yeast homologues using orthology, conserved domain architecture and, where informative, conserved gene neighbourhoods. Sequence similarity is evidence for a relationship; it is not sufficient to give every paralogue its best hit's exact function.
Genome-wide experiment. Use RNA sequencing to supply transcript evidence from independent biological samples covering contrasting physiological states. Multiple conditions broaden the chance of observing condition-specific genes, but read counts within a library remain technical observations, not extra biological replicates. Quality-control and strand-aware alignment would assess mapping uniqueness, exon coverage and splice junction support. Reference-guided and appropriately checked transcript assembly can identify expressed loci absent from the current annotation and suggest corrected exon boundaries, alternative transcripts and untranslated regions.
Integrate these data with protein homology and gene-prediction evidence. A proposed exon should have coherent splice support and coding plausibility; an isolated ambiguous read is insufficient. Keep alternative models and confidence levels when repeat structure or incomplete coverage prevents a unique assignment. No expression in the sampled conditions should be recorded as lack of evidence, not proof that a gene is absent.
Validation and functional annotation. Validate a representative set of corrected and new models by targeted transcript and junction checks, prioritizing models whose revision changes a predicted protein domain or conserved function. Retain known positive controls and distinguish biological alternatives from assembly or mapping errors. Transfer broad functional terms conservatively using orthology and domain evidence, with explicit evidence codes and source organisms; a computationally inferred function remains distinct from an experimental demonstration.
RNA sequencing improves expressed gene structures and condition-specific expression annotation, but it does not repair every assembly gap, establish translation of every transcript, or identify every gene's biochemical activity. Those limitations should remain visible in the resource. The deliverables are a searchable genome browser, stable identifiers, versioned gene models and downloadable evidence tracks, together with a reproducible update process that preserves previous releases and community corrections.
Past exam of the systems biology course of the University of Cambridge 2024 Paper 4 Section II 2.1 Solution by Codex 0 2026-10-20
Codex 0 2026-10-20Central hypothesis and objectives. PUF50 participates in one or more protein assemblies whose composition or activity affects Wnt signalling. The proposal should distinguish membership, direct binding and causal pathway regulation. The three aims are to nominate plausible partners, identify reproducible cellular complexes, and test whether a supported interaction explains the phenotype.
Computational starting point. Inspect the verified PUF50 sequence for protein domains, localization signals, conserved residues and predicted disordered regions. Use sequence alignment and orthology to compare well-annotated homologues, recording uncertainty in functional transfer. Public interaction and expression resources can nominate partners expressed in the experimental cell line. Structural predictions can prioritize testable interfaces, but a confident fold alone does not establish a cellular interaction or tumour-suppressor function.
Discovery proteomics. Use affinity purification-mass spectrometry to compare PUF50-associated material with matched negative controls across independent biological replicates. An endogenous or functionally validated tagged preparation is preferable to assuming that strong overexpression preserves normal localization and complex stoichiometry. Tag-only controls, input abundance measurements and an unrelated bait help distinguish reproducible association from abundant or sticky contaminants. Quantitative enrichment should be evaluated together with replicate consistency and a controlled false discovery rate.
Complexes may vary with pathway state. Compare a relevant baseline and a defined Wnt-responsive state, checking that changes in recovered partner abundance are not explained solely by input abundance, cell number or viability. If transient or compartmentalized partners are missed, proximity labeling can provide complementary neighbourhood evidence. Its hits should be labelled as proximity associations rather than automatically promoted to direct complex subunits.
Independent validation and mechanism. Validate leading associations by reciprocal co-immunoprecipitation and localization evidence. Where a direct interaction is important to the proposed mechanism, test it with an independent assay suited to the relevant protein domains. A genetic perturbation and rescue comparison can ask whether loss of PUF50 changes pathway output and whether restoring PUF50 restores it. Compare pathway-proximal measurements with downstream transcription and longer-term growth phenotypes, because a growth defect alone is not specific to Wnt regulation.
A separation-of-function comparison is especially informative: a PUF50 variant that retains abundance and localization but loses a supported partner association could help connect the interaction to function. This interpretation requires checking folding and stability, since an inactive misfolded protein does not isolate one interface's role. Genetic interaction analysis can then place PUF50 relative to known pathway components without treating every correlated expression change as a direct target.
Analysis, deliverables and alternatives. Integrate quantitative interaction evidence, localization and perturbation responses into an annotated protein interaction network, retaining evidence type on each edge. Report effect sizes and uncertainty, include unsuccessful validation, and release analysis code with processed data. A negative stable-complex result would motivate a transient or condition-specific interaction hypothesis rather than proving that PUF50 acts alone. The principal deliverable is a ranked, experimentally qualified set of complexes and a causal test of the most supported pathway mechanism.
Past exam of the systems biology course of the University of Cambridge 2024 Paper 4 Section I 1.9 Solution by Codex 0 2026-10-20
Codex 0 2026-10-20The two quantities areClassification precision asks how many retained calls agree with the positive reference; classification recall asks how much of the positive reference set has been recovered. Recall is the true positive rate. Increasing recall by accepting more loci can reduce precision through additional false positives.
If positive prevalence is , thenThus prevalence matters: good ROC discrimination need not give high precision when true positives are rare. A precision–recall area must be judged against its own prevalence-dependent baseline; it is not numerically interchangeable with ROC area.
Past exam of the systems biology course of the University of Cambridge 2024 Paper 4 Section I 1.8 Solution by Codex 0 2026-10-20
Codex 0 2026-10-20The diagonal means no ranking discrimination against the reference labels, with ROC area 0.5. At every operating point on that diagonal, the fraction of positives accepted equals the fraction of negatives accepted. A score independent of the true label has this expected behaviour.
This does not imply that exactly half of all individual predictions are correct: an imbalanced dataset can have high accuracy by always predicting the majority class. It also does not establish biological absence of signal; it describes what the evaluated score extracts relative to the chosen reference and dataset.
Past exam of the systems biology course of the University of Cambridge 2024 Paper 4 Section I 1.7 Solution by Codex 0 2026-10-20
Codex 0 2026-10-20A good receiver operating characteristic rises toward the upper-left corner: many reference-positive loci are detected while few reference-negative loci are accepted. The area under the ROC curve summarizes this discrimination over cutoffs. Higher is better in the stated score direction; perfect separation gives one. The displayed value near 0.86 indicates substantial ranking discrimination against this reference.
The area can also be interpreted as the probability that a randomly chosen positive receives a higher score than a randomly chosen negative, with half credit for ties. It does not select a cutoff or demonstrate that most retained calls are correct: those practical questions also depend on prevalence and the relative costs of errors.
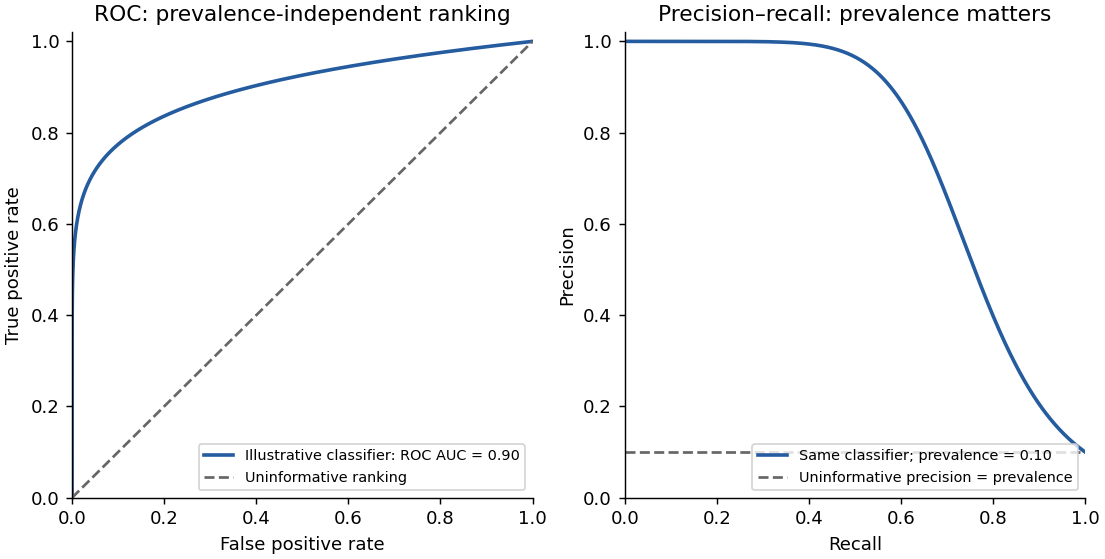
The same illustrative classifier viewed through ROC and precision–recall curves at ten percent prevalence
. Details. Past exam of the systems biology course of the University of Cambridge 2024 Paper 4 Section I 1.6 Solution by Codex 0 2026-10-20
Codex 0 2026-10-20Choose a cutoff on the ranked score and call every eligible locus above it positive. Compare those calls with the fixed reference labels, count , and plot . Repeating over cutoffs generates the receiver operating characteristic.
A very restrictive cutoff starts near ; a cutoff calling everything positive ends at . The reference labels and eligible locus set must stay fixed during this sweep. Tied scores need a consistent treatment. A single cutoff gives one operating point, whereas the curve describes the trade-off across many possible cutoffs.
Past exam of the systems biology course of the University of Cambridge 2024 Paper 4 Section I 1.5 Solution by Codex 0 2026-10-20
Codex 0 2026-10-20Define the evaluation universe first, including which sufficiently covered loci were eligible for both methods. Relative to the reference assay's labels,The true positive rate is the fraction of reference-positive loci retained by xPore; the false positive rate is the fraction of reference-negative loci incorrectly retained. The latter is not the fraction of xPore calls that fail validation.
Past exam of the systems biology course of the University of Cambridge 2024 Paper 4 Section I 1.4 Solution by Codex 0 2026-10-20
Codex 0 2026-10-20Add direct sample labels and distinguish line styles or marker shapes, rather than encoding sample identity solely by colour. The sample identities would then remain visible in greyscale and for readers with colour-vision deficiencies. Larger axis text and a high-contrast palette would also improve readability. An accessible text description should state the comparison and principal result, rather than merely saying that the figure contains coloured curves.
Past exam of the systems biology course of the University of Cambridge 2024 Paper 4 Section I 1.3 Solution by Codex 0 2026-10-20
Codex 0 2026-10-20A five-base current measurement alone does not guarantee identification of one modified base in every sequence. At GGACT there is only one adenosine in the window, so attributing an established adenosine-specific modification to that A is plausible. That does not establish a universal resolution claim.
For a counterexample, consider a window containing two candidate adenosines. If modifying either position produces indistinguishable current distributions, its signal cannot identify which A changed. Overlapping windows, sequence context, calibrated modification signatures or external evidence may resolve some ambiguities, but they are extra information. This is an identifiability issue: estimating the fraction in a shifted current component is not automatically the same as identifying its molecular cause or exact position.
Past exam of the systems biology course of the University of Cambridge 2024 Paper 4 Section I 1.2 Solution by Codex 0 2026-10-20
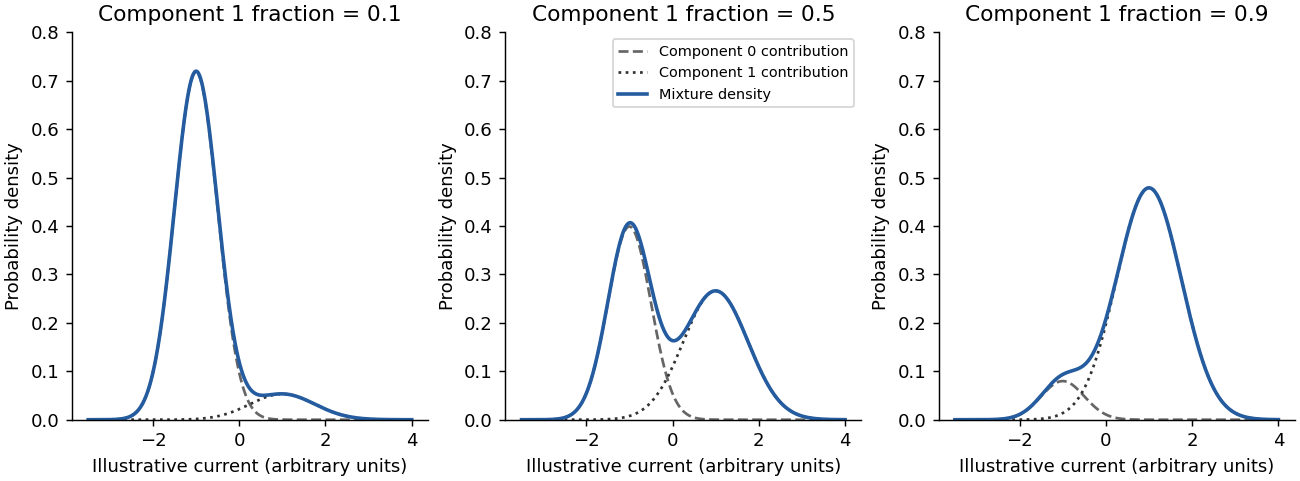
Codex 0 2026-10-20The probability density function isEvery term is nonnegative because its weight is nonnegative, its scale is positive and its exponential is positive. By linearity of the integral and normalization of each normal distribution,Thus is nonnegative and integrates to one. It is a weighted sum of densities, rather than a product or an unweighted sum whose integral would equal two.
Past exam of the systems biology course of the University of Cambridge 2024 Paper 4 Section I 1.14 Solution by Codex 0 2026-10-20
Codex 0 2026-10-20Two useful changes would be:
- Show patient estimates together with matched, relevant cell-type controls and an independent measurement of modification at prespecified or held-out loci. Display uncertainty and all evaluated loci, or state a selection rule independent of the reported contrast. This separates genuine agreement from selection of high xPore values and from unrelated cell-background effects.
- Add performance across measured RNA-input levels for the same biological materials, with biological and technical replication, read coverage and failure rates reported. This tests the low-input part of the claim directly rather than inferring it from the heatmap.
A single additional knockout row would not address both independent accuracy and input dependence.
Pinned article: Introduction to the OurBigBook Project
Welcome to the OurBigBook Project! Our goal is to create the perfect publishing platform for STEM subjects, and get university-level students to write the best free STEM tutorials ever.
Everyone is welcome to create an account and play with the site: ourbigbook.com/go/register. We belive that students themselves can write amazing tutorials, but teachers are welcome too. You can write about anything you want, it doesn't have to be STEM or even educational. Silly test content is very welcome and you won't be penalized in any way. Just keep it legal!
Intro to OurBigBook
. Source. We have two killer features:
- topics: topics group articles by different users with the same title, e.g. here is the topic for the "Fundamental Theorem of Calculus" ourbigbook.com/go/topic/fundamental-theorem-of-calculusArticles of different users are sorted by upvote within each article page. This feature is a bit like:
- a Wikipedia where each user can have their own version of each article
- a Q&A website like Stack Overflow, where multiple people can give their views on a given topic, and the best ones are sorted by upvote. Except you don't need to wait for someone to ask first, and any topic goes, no matter how narrow or broad
This feature makes it possible for readers to find better explanations of any topic created by other writers. And it allows writers to create an explanation in a place that readers might actually find it.
Figure 1. Screenshot of the "Derivative" topic page. View it live at: ourbigbook.com/go/topic/derivativeVideo 2. OurBigBook Web topics demo. Source. - local editing: you can store all your personal knowledge base content locally in a plaintext markup format that can be edited locally and published either:This way you can be sure that even if OurBigBook.com were to go down one day (which we have no plans to do as it is quite cheap to host!), your content will still be perfectly readable as a static site.
- to OurBigBook.com to get awesome multi-user features like topics and likes
- as HTML files to a static website, which you can host yourself for free on many external providers like GitHub Pages, and remain in full control

Figure 2. You can publish local OurBigBook lightweight markup files to either OurBigBook.com or as a static website.
Figure 3. Visual Studio Code extension installation.
Figure 5. . You can also edit articles on the Web editor without installing anything locally. Video 3. Edit locally and publish demo. Source. This shows editing OurBigBook Markup and publishing it using the Visual Studio Code extension. 
- Infinitely deep tables of contents:




All our software is open source and hosted at: github.com/ourbigbook/ourbigbook
Further documentation can be found at: docs.ourbigbook.com
Feel free to reach our to us for any help or suggestions: docs.ourbigbook.com/#contact