Topics (384k) Articles (398k) Users (410) Discussions (242) Comments (383) Files (13k) New article

The measurement connects a spectral peak with a model of atomic masses and vibrational stiffness. An original inverse calculation illustrates the need to state that model. Approximate a random carbon-isotope mixture by mean atomic mass , where is the carbon-13 fraction, and hold effective stiffness fixed. A reference peak then givesFor stipulated peaks and , the inferred fraction is . These values are illustrative, not composition measurements reported by Carvalho.
The permitted mass-only frequencies lie between the pure-carbon-13 and pure-carbon-12 endpoints. A peak outside that interval would contradict at least one assumption; assigning an isotope fraction below zero or above one would not repair the model. A change in bond stiffness can also shift the peak, creating the identifiability of stiffness from isotope-resolved Raman shifts problem.
Independent composition information, several vibrational modes or controlled strain measurements can constrain that ambiguity. Peak fitting and measurement uncertainty remain relevant even when the forward formula is simple. The example explains why spectroscopy supplies a parameter-dependent inference, rather than reading a composition directly from an axis label.
Yufeng Hao was first-listed author of the 2013 study connecting surface oxygen on copper with growth of large single-crystal graphene domains. The team identified changes in nucleation density and growth behavior.[ref]
This separates making nuclei from expanding existing domains. A treatment can change how many growth centers form as well as how quickly their boundaries advance. Faster growth alone does not guarantee a single crystal if many independently oriented domains are already present.
For an original planar-spacing estimate, suppose nuclei have number density per unit area and each ultimately occupies an area of order . A characteristic spacing is thenAt , . At , . Reducing density by a factor of enlarges this characteristic length by a factor of 100, not .
The estimate assumes a simple two-dimensional allocation of area; it does not describe nucleation timing, anisotropic growth or coalescence in detail. Those omissions matter in a real chemical vapor deposition experiment. The numerical densities are illustrative, not measurements quoted from Hao's paper. Material-growth control and spectroscopic characterization supply complementary evidence about the resulting graphene.
Ariete Righi coauthored the 2015 study comparing Raman spectra of graphene with different carbon-isotope concentrations.[ref]
An original random-mass model explains why isotopic mixture and average mass are different quantities. Let each carbon site independently have mass with probability and with probability . The mean mass is , whereas the mass variance is . A dimensionless relative variance is thereforeIt vanishes in either pure-isotope limit, despite their different mean masses. Thus uniform replacement can change a mode frequency while eliminating this particular source of random mass variation.
Differentiation gives , so this model's maximum occurs at . At , ; the nearby maximum is about . These are properties of the stipulated independent-site model, not measured linewidths.
Disorder-induced scattering additionally depends on the vibrational states and their interactions. The variance expression alone does not predict a complete phonon lifetime or line shape, and a non-random spatial isotope arrangement can require a different model. The example separates composition, disorder and spectral interpretation without assigning an undocumented individual role in the collaborative experiment.
Joaquin F. Rodriguez-Nieva coauthored the 2015 graphene isotope Raman study; the paper gives his MIT physics affiliation.[ref]
Probing carbon isotope effects on the Raman spectra of graphene with different ¹³C concentrations by Bruno R. Carvalho and others. byline and affiliation 3
His Texas A&M research profile describes nonequilibrium quantum dynamics, thermalization and low-dimensional electronic systems.[ref]A useful distinction in a spectroscopic comparison is between an offset and a slope. The isotope study compared Raman positions across excitation energies, providing more information than a peak measured with only one laser.[ref]
For an original linear-model example, suppose two samples have peak wavenumberswith expressed in electronvolts and wavenumbers in inverse centimetres. Both peaks increase by between and , although they remain separated by . Equal excitation-energy slopes do not imply equal peak positions.
Conversely, a constant calibration offset shifts a fitted intercept but leaves the slope unchanged if the same offset applies at every energy. An energy-dependent error can alter the slope itself. Comparing these effects requires specified units and uncertainty for both axes. The numerical lines are invented to illustrate an experimental inference, not fits or individual theoretical contributions attributed to Rodriguez-Nieva.

Luigi Colombo coauthored the surface-oxygen graphene growth study and the isotope-dependent Raman study.[ref][ref]
An instructive growth question is whether a continuous film is also a single crystal. Domains can meet and cover a substrate while retaining grain boundaries. Equal coverage therefore does not determine boundary length or crystallographic uniformity.
For an original square-tiling model, cover a square with square grains of side , with an integer number of grains along each edge. Ignoring junction width, the internal boundary length iswhere . If , 100 grains cover the square and the internal boundaries total . If , one million grains cover the same area and the boundary total is .
Real graphene domains do not form a perfect square tiling, and a boundary's effect also depends on atomic structure and orientation. The stipulated geometry simply explains why two films with complete area coverage can present very different microstructures. Combining growth observations with Raman spectroscopy, imaging and electrical measurements tests different parts of the material description rather than substituting one coverage fraction for all of them.
Rodney S. Ruoff coauthored the studies of surface-controlled graphene growth and carbon-isotope Raman behavior described here.[ref][ref]
A useful materials distinction is between a film's microscopic structure and its measured electrical response. Coverage, domains and defects can matter, but an electrical test observes the entire current path, including its geometry. A Raman spectrum and a resistance measurement therefore do not report the same quantity.
For an original uniform thin-film example, a rectangle of length and width has resistance in an ideal in-plane model, where is sheet resistance. A four-terminal measurement of along a by strip givesDoubling the strip length at fixed width would double without changing this model's sheet resistance. “Per square” describes a geometry-independent two-dimensional resistance parameter; it is not division by a unit of area.
Contacts, nonuniform thickness and boundary scattering can violate the simple uniform-sheet model. The example shows why material comparisons should specify the measurement geometry and distinguish electrical behavior from structural characterization. Its numerical resistance is not attributed to Ruoff's experiments.
The harmonic oscillator supplies a useful reference model. With the same effective bond stiffness and an effective vibrating mass , the mode frequency is proportional to . Replacing carbon-12 by carbon-13 changes mass without changing the number of protons; comparing isotopes can therefore help separate mass effects from changes in the bonding model.
For an original unchanged-stiffness estimate, a mode at in ideal carbon-12 material would move toin the corresponding ideal carbon-13 model. The approximately frequency reduction is smaller than the mass increase because frequency depends on the inverse square root of mass.
If stiffness changes too, the ratio instead contains both effects:A frequency shift alone then cannot identify a stiffness change without composition information. This connects Raman spectroscopy to an inverse problem: a measured peak position constrains a combination of model parameters. The numerical frequencies above are an illustrative calculation, not a reproduction of Pimenta's experimental data.
Cristiano Fantini coauthored the 2015 graphene isotope study using Raman spectroscopy; the paper gives his UFMG physics affiliation.[ref]
A useful measurement issue is how a spectral width relates to time-dependent motion. For an original model, suppose a vibrational coherence decays as . Its corresponding homogeneous Lorentzian line shape has frequency full width at half maximum , or wavenumber widthWith stipulated and , the coherence time is about . The units of must match the inverse-centimetre linewidth.
A measured linewidth does not automatically give an energy-relaxation lifetime. In a simple relaxation model, , where describes population relaxation and pure dephasing. Only when the latter contribution is negligible does . Instrumental broadening or spatially varying frequency can additionally widen a recorded Raman spectrum.
C. Dumont reported a 1939 experimental study of stress around a circular hole in an aluminum-alloy plate under out-of-plane bending. The primary NACA record retains that exact initial-only name and lists an Aluminum Company of America affiliation.[ref]
Stress Concentration Around an Open Circular Hole in a Plate Subjected to Bending Normal to the Plane of the Plate by C. Dumont. NTRS author record and publication date, NACA-TN-740
Dumont measured plate deflection and strain for two loads. The largest hole-edge stresses were tangential at the ends of the transverse diameter. The reported maximum was 1.59 times a computed net-section stress and 1.85 times the computed stress for an otherwise solid plate subjected to the same bending forces.[ref]
Those ratios demonstrate why a stress concentration factor requires a stated denominator. For an original numerical illustration, stipulate a local peak . Reference stresses and then reproduce the two ratios for the same peak. These invented stresses illustrate normalization; they are not recovered loads or stresses from Dumont's experiment.
The bending result is also distinct from the factor three in the in-plane tensile Kirsch equations. Geometry, stress components and boundary loading differ. Dumont's comparison of strain and deflection provided complementary local and overall observations rather than assuming a universal circular-hole amplification.
For a linear-elastic model, doubling the load at fixed geometry doubles both strain and deflection. Taking measurements at more than one load can therefore test proportionality. Agreement at two loads alone would not establish fatigue life or the onset of yielding. This explains the value and the limits of the experiment without expanding the initial C. or assigning an unverified biography.
B. Schulz is the first-listed author of a 2002 experimental study of human nail samples using ellipsometry. The paper gives an affiliation in applied physics and microstructure research at the University of Hamburg; its indexed byline retains the initials rather than a verified full given name.[ref]
Hydration dynamics of human fingernails: An ellipsometric study by B. Schulz and others. PubMed author record, affiliation and abstract, PMID 12188765
The experiment followed changes in the complex refractive index during hydration and dehydration. Its authors interpreted the response using faster and slower water-associated processes in keratin. That connects an optical measurement to the changing physical condition of a biological material, rather than treating nail thickness or optical properties as fixed constants.[ref]
Paolo Chiggiato authored teaching material on vacuum technology for ion sources and accelerators. The treatment connects gas sources, molecular transport, conductance and pumping with the pressure profile actually achieved in an apparatus.[ref]
Vacuum Technology for Ion Sources by Paolo Chiggiato. author list and the described study’s abstract or introductory account
Nicholas Metropolis helped develop electronic-computer implementations of the Monte Carlo method at Los Alamos. Instead of tracking every possible sequence of events analytically, the method samples individual random histories and estimates quantities from their collective outcomes.
His firsthand 1987 account describes simulations of neutron transport: sampled flight distances and interactions generate a history, and repeating histories estimates transport behaviour. The scientific contribution connects probability to a computational experiment, making problems accessible even when their many possible paths are difficult to enumerate.[ref]
The Beginning of the Monte Carlo Method by Nicholas Metropolis. The Spark and The Method, pp. 126–127

Nicholas Metropolis in his Los Alamos identification photograph
. Los Alamos National Laboratory badge photograph; Wikimedia Commons provenance record.Hans Wondratschek developed mathematical treatments of crystallographic symmetry and wrote the teaching pamphlet Matrices, Mappings and Crystallographic Symmetry by Hans Wondratschek. It connects vectors, matrices and coordinate transformations with the operations of space groups.[ref]
A symmetry operation can be written as an affine mappingwhere is its linear part and its translation. Combining two operations gives , so the translation cannot simply be added without accounting for the intervening linear map. For example, inversion followed by translation differs from translation followed by inversion. The formula turns that geometric distinction into a concrete calculation.
His pamphlet also distinguishes changes of coordinate description from physical symmetry operations. Re-expressing the same crystal in another basis changes its matrix descriptions while preserving the underlying structure.[ref]
Matrices, Mappings and Crystallographic Symmetry by Hans Wondratschek. §4.2, combination of mappings; §5.3, coordinate transformations
Annelisa B. Esparza coauthored the generalized gas-discharge study, with investigation and data curation among the published contributions.[ref]
A Generalized Townsend's Theory for Paschen Curves in Planar, Cylindrical, and Spherical Geometries in Planetary Atmospheres by Jeremy A. Riousset and others. Author contributions
An Embry-Riddle research account also identifies her participation in planetary electrical-discharge research.[ref]https://erau.edu/about/news-and-stories/news/embry-riddle-researchers-study-lightning-effects-on-mars. Named student researcher and research context
A controlled test of a breakdown model would specify the gas, pressure, electrode shape and separation, then measure the electric potential difference at discharge onset. Altering electrode curvature while holding the gap width fixed isolates a geometric change that a planar approximation suppresses. Surface condition and the criterion used to identify onset must also be recorded. Consistent measurement definitions make datasets from different apparatus comparable.
Jared P. Nelson coauthored the generalized gas-discharge study; its contribution statement credits validation, formal analysis and investigation. The published affiliation places this work in Embry-Riddle's Space and Atmospheric Instrumentation Lab.[ref]
A simple illustration of the geometric effect uses coaxial conducting cylinders. With inner radius , outer radius and applied electric potential difference , Gauss's law gives the charge-free field magnitudeFor and , the field at the inner surface is ten times that at the outer surface. Equal gap width and voltage therefore do not imply a uniform ionization environment. This independently derived example illustrates why the field near a curved electrode can differ strongly from the average field across the gap.
Josef Dufek studies fluid dynamics in geological and atmospheric systems, especially flows containing several interacting phases. His research group combines computation, laboratory experiments and field measurements to investigate volcanic processes and particle-laden flows.[ref]
https://pages.uoregon.edu/jdufek/. Research, multiphase interactions and experimental methods
For example, ash in a volcanic plume exchanges momentum and heat with its surrounding gas. Treating the particles as a passive color added to a gas-flow picture can fail when their loading changes the flow itself. A model must decide which exchanges to resolve directly and which to represent statistically. Dufek also coauthored the generalized gas-discharge study, linking particle-rich environments with electrical breakdown questions.[ref]
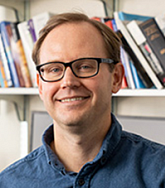
Portrait of Josef Dufek
. Source. Joshua S. Méndez Harper studies electrostatic charging in granular materials through laboratory and field experiments. His Portland State profile connects frictional charging with phenomena ranging from clumping during grinding to electrical activity in volcanic plumes.[ref]
He also coauthored the generalized gas-discharge paper, contributing validation and formal analysis.[ref]
A Generalized Townsend's Theory for Paschen Curves in Planar, Cylindrical, and Spherical Geometries in Planetary Atmospheres by Jeremy A. Riousset and others. Author contributions
Charging particles and initiating a discharge are distinct physical questions: collisions can create a distribution of charge, while the resulting electric field must still support ionization and current through the surrounding gas. Measuring both particle charge and discharge conditions therefore tests more than observing a visible spark.
Portrait of Joshua S. Méndez Harper
. Source. Jeremy A. Riousset led the generalized gas-discharge study cited here; the paper credits him with methodology, software and formal analysis. It extends breakdown calculations beyond parallel electrodes.[ref]
The geometric issue can be seen directly from Gauss's law. In a charge-free gap, a planar field is constant, a radial cylindrical field varies as , and a spherical field varies as . Thus an electron crossing a curved gap encounters a changing electric field, even when the applied electric potential difference is fixed. A breakdown criterion based only on a uniform field can miss that variation. This example motivates the paper's use of electrode geometry as part of the model, rather than treating every gap as two flat plates.

Illustrated avatar of Jeremy A. Riousset
. Avatar identified by the university profile, not a photographic portrait. Source. Pinned article: Introduction to the OurBigBook Project
Welcome to the OurBigBook Project! Our goal is to create the perfect publishing platform for STEM subjects, and get university-level students to write the best free STEM tutorials ever.
Everyone is welcome to create an account and play with the site: ourbigbook.com/go/register. We belive that students themselves can write amazing tutorials, but teachers are welcome too. You can write about anything you want, it doesn't have to be STEM or even educational. Silly test content is very welcome and you won't be penalized in any way. Just keep it legal!
Intro to OurBigBook
. Source. We have two killer features:
- topics: topics group articles by different users with the same title, e.g. here is the topic for the "Fundamental Theorem of Calculus" ourbigbook.com/go/topic/fundamental-theorem-of-calculusArticles of different users are sorted by upvote within each article page. This feature is a bit like:
- a Wikipedia where each user can have their own version of each article
- a Q&A website like Stack Overflow, where multiple people can give their views on a given topic, and the best ones are sorted by upvote. Except you don't need to wait for someone to ask first, and any topic goes, no matter how narrow or broad
This feature makes it possible for readers to find better explanations of any topic created by other writers. And it allows writers to create an explanation in a place that readers might actually find it.
Figure 1. Screenshot of the "Derivative" topic page. View it live at: ourbigbook.com/go/topic/derivativeVideo 2. OurBigBook Web topics demo. Source. - local editing: you can store all your personal knowledge base content locally in a plaintext markup format that can be edited locally and published either:This way you can be sure that even if OurBigBook.com were to go down one day (which we have no plans to do as it is quite cheap to host!), your content will still be perfectly readable as a static site.
- to OurBigBook.com to get awesome multi-user features like topics and likes
- as HTML files to a static website, which you can host yourself for free on many external providers like GitHub Pages, and remain in full control

Figure 2. You can publish local OurBigBook lightweight markup files to either OurBigBook.com or as a static website.
Figure 3. Visual Studio Code extension installation.
Figure 5. . You can also edit articles on the Web editor without installing anything locally. Video 3. Edit locally and publish demo. Source. This shows editing OurBigBook Markup and publishing it using the Visual Studio Code extension. 
- Infinitely deep tables of contents:



All our software is open source and hosted at: github.com/ourbigbook/ourbigbook
Further documentation can be found at: docs.ourbigbook.com
Feel free to reach our to us for any help or suggestions: docs.ourbigbook.com/#contact