Topics (384k) Articles (398k) Users (410) Discussions (242) Comments (383) Files (13k) New article

Edward O. Stejskal was a physical chemistry researcher known for nuclear magnetic resonance methods. His Illinois doctoral work used nuclear spin relaxation to investigate molecular motion in solids. At Wisconsin he developed pulsed field gradient NMR with his first doctoral student, John E. Tanner; later he worked at Monsanto and became a professor at North Carolina State University.[ref]
Obituary: Edward Stejskal by the University of Illinois Department of Chemistry. Graduate research, Wisconsin collaboration, Monsanto and NC State appointments

Their 1965 apparatus measured proton spin echoes at using opposed gradient coils. Keeping the applied magnetic field gradient small during the radio frequency pulses and echo detection removed two limitations of continuously strong gradients: difficult excitation across a broad resonance and an echo too narrow to measure easily. They tested the method on dry glycerol and reported a diffusion coefficient of at . This is their reported measurement, rather than a general reference value for all glycerol samples.[ref]
Spin Diffusion Measurements: Spin Echoes in the Presence of a Time-Dependent Field Gradient by E. O. Stejskal and J. E. Tanner. pp.288–289: measurement motivation; pp.291–292: 20MHz apparatus and glycerol result
The Stejskal-Tanner equation gives a useful ideal prediction. For unrestricted diffusion, two equal rectangular gradient pulses of duration and magnitude , with starting times separated by , giveHere is the diffusion coefficient, the diffusion weighting b-value, and the angular gyromagnetic ratio; is the otherwise matched echo without the applied diffusion-encoding gradients. An intervening spin echo pulse reverses their effective encoding sign, although the two physical gradient pulses have the same sign. The accumulated encoding returns to zero for stationary atomic nuclei, while random displacements attenuate the ensemble signal.[ref]
Spin Diffusion Measurements: Spin Echoes in the Presence of a Time-Dependent Field Gradient by E. O. Stejskal and J. E. Tanner. pp.289–290: Theory and rectangular-gradient case
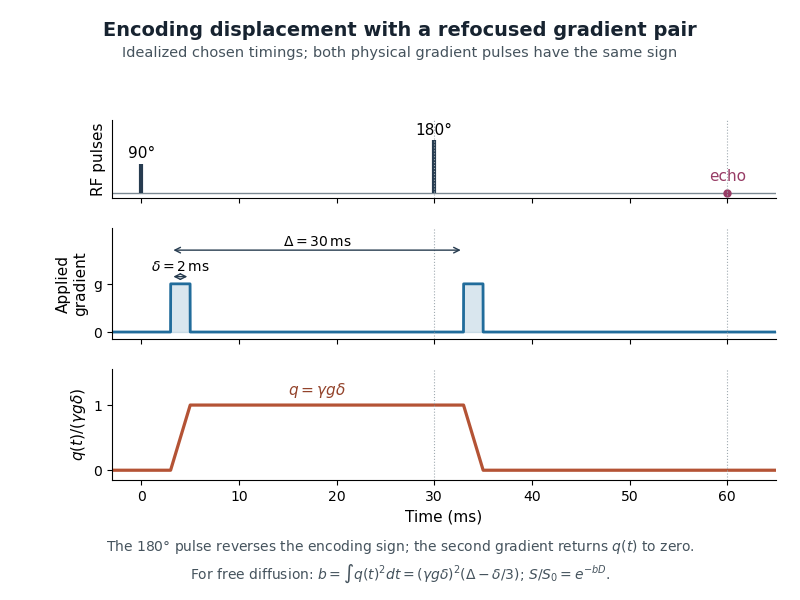
An original idealized gradient-pair diagram: identical physical pulses, refocusing of the stationary position tag, and the time integral of squared encoding that determines diffusion attenuation
. Details. The finite-duration correction can be checked directly. In this ideal diagram, rises linearly to , remains there for , then falls linearly to zero. Each ramp contributes to , giving . This integral explains why replacing the pulses by instantaneous position tags loses a correction when is appreciable.
At Monsanto, Stejskal and Jacob Schaefer combined cross-polarization (nuclear magnetic resonance) with magic angle spinning to obtain high-resolution solid-state nuclear magnetic resonance. In cross-polarization magic-angle spinning, polarization transfer strengthens weak nuclear responses while sample rotation averages appropriate anisotropic interactions; the two operations address different experimental obstacles.[ref]
Obituary: Edward Stejskal by the University of Illinois Department of Chemistry. Monsanto collaboration with Jacob Schaefer and combined cross-polarization/magic-angle spinning
John E. Tanner was a physical chemistry researcher whose work with Edward O. Stejskal established pulsed field gradient NMR as a method for measuring self-diffusion. He studied physical chemistry at Oberlin, Indiana and Wisconsin, and later worked at Idaho National Laboratory. His early NMR work received renewed recognition with an honorary fellowship in 2016.[ref]
John Tanner obituary by Michigan Cremation and Funeral Care. Life dates, education, Idaho career and 2016 recognition
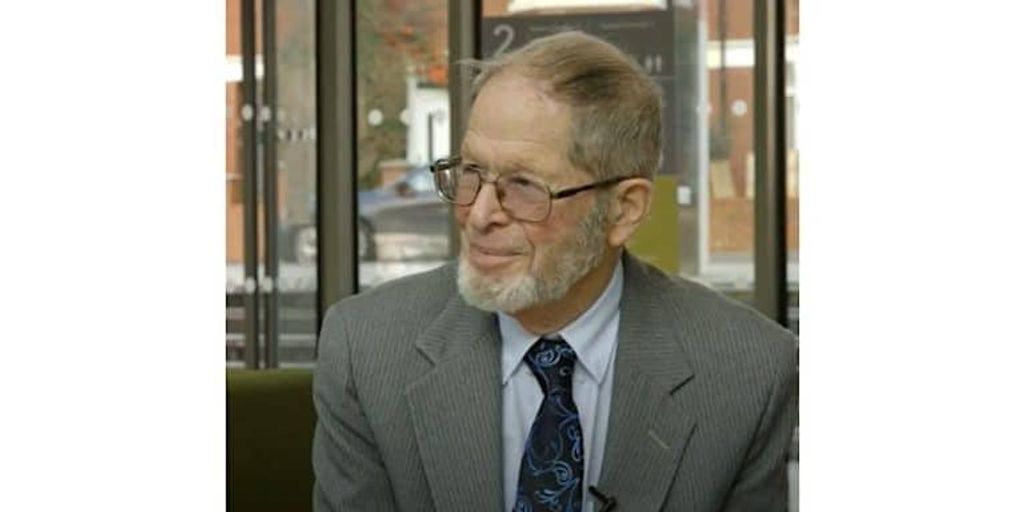
John E. Tanner, from the profile portrait accompanying his family memorial
. The appeal of pulsed field gradient NMR was practical as well as theoretical: strong magnetic field gradients could encode motion without remaining strong during excitation or detection. In a 2017 interview with Derek Jones, Tanner recalled choosing Stejskal's laboratory because it had a magnet and because he wanted to measure slow diffusion. He also described rebuilding the probe to deal with eddy currents generated by switching the magnetic field gradients.[ref]
John Tanner, the return to Germelshausen, and the work that nearly never happened by Derek Jones. pp.4 and7: choice of doctoral work, gradient switching and probe redesign
Tanner made restricted diffusion experimentally concrete. He described assembling 99 layers of mica with aluminium foil spacers, carefully removing wrinkles and burrs to obtain regular gaps. Such a controlled geometry lets an echo probe displacement between known barriers, rather than treating every loss of NMR signal as free diffusion with a smaller diffusion coefficient.[ref]
John Tanner, the return to Germelshausen, and the work that nearly never happened by Derek Jones. p.6: mica-stack construction and interpretation of restricted geometry
His 1970 work used a stimulated echo to extend the observation interval when spin-lattice relaxation is slower than transverse relaxation. The interval can store the relevant pattern as longitudinal magnetization, rather than keeping it transverse throughout.[ref]
Use of the Stimulated Echo in NMR Diffusion Studies by J. E. Tanner. Original abstract: three-pulse method, T1 greater than T2 and experimental square-gradient test
For an illustrative ideal comparison, take , and storage time . The storage-dependent nuclear spin relaxation factors are and . Even allowing the ideal three-pulse pathway's initial factor of , the former factor is about 45 times larger. This compares only that storage contribution: pulse losses, the other transverse intervals and diffusion attenuation still matter.[ref]John Tanner, the return to Germelshausen, and the work that nearly never happened by Derek Jones. p.6: Tanner's explanation of the half-signal cost versus longer T1 storage
Jacob Schaefer was a physical chemistry researcher who developed methods for studying complex solid materials using solid-state nuclear magnetic resonance. After his 1964 doctorate he worked at Monsanto, then joined Washington University in 1986. His contributions included cross-polarization magic-angle spinning with Edward O. Stejskal and rotational-echo double resonance with Terry Gullion.[ref]
Jacob Schaefer obituary by Washington University in St. Louis. Education, appointments and joint CPMAS/REDOR contributions

Jacob Schaefer, in the portrait accompanying Washington University's institutional memorial
. The materials in the 1976 cross-polarization magic-angle spinning demonstration made the method's reach tangible. They included polysulfone, ebony wood and a cylinder cut from an ivory billiard ball. Schaefer's father and grandfather were billiards champions; a familiar object became a specimen for measuring carbon-13 responses in a complex solid. Combining polarization transfer with magic angle spinning made weak and broadened solid-state responses much more accessible.[ref]
Jacob Schaefer, 1938-2022 by Lynette Cegelski and Terry Gullion. Tribute: family connection,1976 sample choices and high-sensitivity/high-resolution CPMAS demonstration
REDOR addresses another measurement problem. Magic angle spinning averages interactions that broaden spectra, but some of those interactions carry structural information. Appropriately timed radio frequency pulses restore sensitivity to NMR dipolar coupling between different nuclear species. Comparing a reference echo with a deliberately dephased echo then probes that coupling, with structural interpretation supplied by a suitable spin model.[ref]
Schaefer reproduced a laboratory record from 29 May 1987 in which Gullion measured carbon-13 spectra of nitrogen-15-labelled alanine. Carbon remained at natural isotopic abundance. The record compares full and dephased echoes at a carbon frequency of , using magic angle spinning at and 10 rotor periods of dipolar evolution. The corresponding duration isThe reproduced record does not give sample mass or number of accumulated scans. Later use of XY8 NMR phase cycling suppressed pulse-train amplitude and phase errors, enabling measurements of weaker couplings over longer pulse trains.[ref]
Development of REDOR rotational-echo double-resonance NMR by Jacob Schaefer (2011). p.422, Figure1 caption: sample, frequencies and missing acquisition quantities; following paragraphs: XY8 and weak-coupling measurements
Derek Jones is a physicist at Cardiff University whose research develops quantitative magnetic resonance imaging, especially diffusion tensor imaging. He trained in physics at Nottingham, medical physics at Leeds and completed a Leicester doctorate on diffusion tensor imaging. His work asks how acquisition design changes what can be inferred from a measured signal.[ref]
Derek Jones profile at Cardiff University. Overview, Research and Biography: research focus and1993/1995/1998 education

Derek Jones, from his labeled Cardiff University staff-profile portrait
. Jones investigated how diffusion MRI gradient sampling affects the measurement uncertainty of inferred diffusion tensors. In 2004, Jones used Monte Carlo simulations to compare sampling schemes at a diffusion weighting b-value of , tracking tensor orientation, trace and fractional anisotropy. It showed why a minimal set of directions need not give robust estimates; its numerical findings belong to the tested models and noise conditions.[ref]
The effect of gradient sampling schemes on measures derived from diffusion tensor MRI: A Monte Carlo study by Derek K. Jones. Original abstract: controlled b-value, tensor-derived outcomes and comparison of angular sampling schemes
An earlier conference report made the comparison with a fixed observation budget: one baseline and 60 diffusion-weighted observations. Six unique orientations repeated 10 times and 30 orientations repeated twice therefore used the same number of diffusion-weighted observations. Varying angular coverage while controlling that budget separates a direction-design question from simply acquiring more data.[ref]
The Effect of Gradient Sampling Scheme on Estimates of Fiber Orientation: Implications for Fiber Tractography by D. K. Jones. Methods and Table1:61 total rows, unique orientations and repetition counts
A noise-free calculation illustrates diffusion tensor identifiability. With separately known baseline , fixed and a unit direction , the Gaussian diffusion tensor model givesThe symmetric matrix has six independent coefficients. Its quadratic form produces a row in a linear least squares design. Directions give six observations but only matrix rank three: opposite directions repeat a row and the off-diagonal coefficients remain undetermined.
Adding the normalized mixed directions , and to the three positive coordinate axes instead gives matrix rank six. For example,This establishes uniqueness in the stated noise-free model. It does not establish small measurement uncertainty or an optimal experimental design.
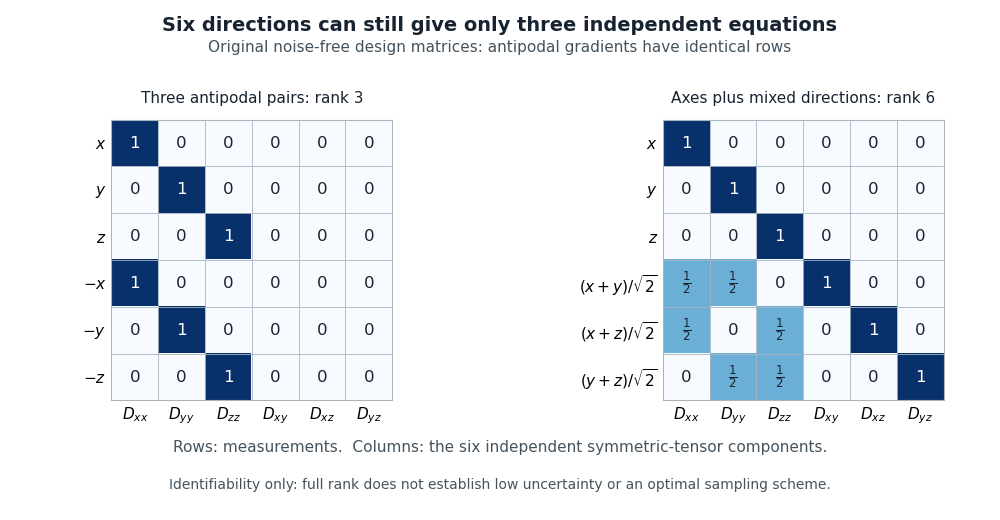
Original noise-free diffusion-tensor design matrices: six antipodal directions give rank three, while axes plus three mixed directions give rank six
. Details. Jones also interviewed John E. Tanner about the physical origins of pulsed field gradient NMR. The interview preserved concrete details of the apparatus, including Tanner's carefully spaced mica stack and the practical difficulties of rapidly switching magnetic field gradients.[ref]
John Tanner, the return to Germelshausen, and the work that nearly never happened by Derek Jones. pp.6–7: restricted-diffusion apparatus and switching problems
Terry Gullion is a physical chemist whose work develops solid-state nuclear magnetic resonance. With Jacob Schaefer, he developed rotational-echo double resonance, or REDOR, which restores sensitivity to heteronuclear NMR dipolar coupling in a spinning solid. His first-person retrospective describes the method as a way to measure couplings and infer structural information.[ref]
Recollections of REDOR by Terry Gullion. Original author abstract and1989-paper commentary relationship
[ref]Development of REDOR rotational-echo double-resonance NMR by Jacob Schaefer (2011). 2011 first-person retrospective on the1989 Gullion–Schaefer report
Institutional profile: www.chemistry.wvu.edu/directory/professors/terry-gullion
The physical problem is that magic angle spinning suppresses interactions that broaden spectra but can also remove useful structural information. REDOR uses controlled pulse timing to reintroduce a selected interaction. A paired acquisition compares a reference signal with a dephased signal under matched conditions. Varying the evolution time supplies more information than a single intensity difference.[ref]
Development of REDOR rotational-echo double-resonance NMR by Jacob Schaefer (2011). Pulse-train development, magic-angle spinning and dipolar recoupling discussion
For an original arithmetic example, and give fractional dephasing . This does not directly mean that 28 percent of the atoms occupy a particular state. Structural inference requires an appropriate spin model, evolution times and controls on the acquisition. The example shows the inferential step that Gullion's method makes possible: a controlled change in a spectrum can encode an otherwise hidden interaction.
Lynette Cegelski is a Stanford chemist who develops and applies solid-state nuclear magnetic resonance to determine composition and structure in complex materials. Her work connects the measured spectrum with the quantities that can be inferred from it.[ref]
Lynette Cegelski profile at Stanford University. Official Stanford profile, appointment and research/publications

Lynette Cegelski, from her labeled Stanford institutional portrait
. Source. In a coauthored 2019 materials study, carbon-13 cross-polarization magic-angle spinning spectra of individual polymer components were compared with spectra of intact polymer materials. The comparison yielded approximate carbon contributions from major components. Measuring the material itself provides information different from estimating its composition only from unused starting components.[ref]
Carbon compositional analysis of hydrogel contact lenses by solid-state NMR spectroscopy (2019). Author-hosted original abstract: individual-component spectra, intact materials and approximate carbon contributions
An original calibration example explains why spectral response matters. Suppose two separately resolved contributions have intensities and , with known spectroscopic response factors and in a model . The inferred carbon counts are proportional to 30 and 40, so the A fraction is , rather than the raw-intensity fraction .
These invented coefficients are not results from the paper. They illustrate the distinction between observing a spectral feature and calibrating its contribution to composition. Cegelski's materials measurements exemplify how solid-state nuclear magnetic resonance can make insoluble samples accessible to direct compositional analysis while retaining explicit limits on quantification.
James Keeler works on high-resolution nuclear magnetic resonance methods and explains their physical basis through experiments and mathematical models. His university profile identifies this research focus and his authorship of Understanding NMR Spectroscopy.[ref]
James Keeler at the University of Cambridge. Research and Textbooks sections
The author-hosted Irvine notes give a particularly concrete account of how receiver electronics turn rotating nuclear magnetization into a signed frequency measurement.[ref]A single receiver channel proportional to cannot distinguish offsets and , because cosine is even. Two receiver references separated in phase by give quadrature detection: the two outputs represent and and combine into the complex number . This determines the sense of rotation in the rotating frame as well as its rate.[ref]
For an original numerical illustration, offsets of and at have phases and . Both give the same real channel , but the imaginary channels are respectively and . This is why retaining both receiver channels preserves information lost by a single real measurement.

James Keeler, portrait linked from his University of Cambridge staff profile
. Fei Wang is the first author, printed as F. Wang, of the 2016 experimental study of robust dynamical decoupling with finite-strength control pulses. The corresponding 2017 APS abstract identifies Fei Wang and the same five coauthors under the same research title.[ref]
The experiment controlled an electron-spin qubit at a nitrogen-vacancy center in diamond. A laser initialized and read out the center through fluorescence; a transmission line delivered microwave control and deliberately injected noise. Comparing pulse sequences tested whether slow, finite-duration pulses could suppress dephasing and relaxation noise, rather than requiring ideal instantaneous rotations. The study found that appropriately arranged slow pulses could approach the performance of strong fast pulses.[ref]
Experimental realization of robust dynamical decoupling with bounded controls in a solid-state spin system by F. Wang and others. Introduction, results figure 1 and Appendix, Experimental Setup
An original pulse-area example explains the constraint. For resonant control , a constant pulse of duration rotates through . A pulse with lasts ; at it lasts . Both have the same rotation angle, but the system experiences noise for ten times longer during the second pulse. The demonstrated sequence design addresses that finite-duration problem; pulse area alone does not establish noise cancellation.
Steve R. Domen developed physical water calorimetry methods at the National Institute of Standards and Technology. His 1994 sealed-water instrument measured absorbed dose from a minute radiation-induced temperature rise, while investigating how dissolved gases change the fraction of deposited energy that appears as heat.[ref]
A Sealed Water Calorimeter for Measuring Absorbed Dose by Steve R. Domen. Title-page byline, abstract and section 1
The apparatus enclosed water in a thin glass vessel immersed in a larger water tank. Two calibrated thermistors in glass capillaries formed part of a Wheatstone bridge that detected the temperature response. The vessel also limited convection. Comparing different dissolved-gas conditions tested the heat defect, rather than assuming that all absorbed energy immediately becomes heat.[ref]
A Sealed Water Calorimeter for Measuring Absorbed Dose by Steve R. Domen. Sections 2.1–2.3, figures 1–4; abstract, approximately 3700 measurements
For an original ideal calculation, neglect the heat defect and heat transfer during a reading. With water specific heat capacity and measured rise ,This illustrates why sub-millikelvin thermometry matters. It is not a reported run: the real measurement model must include the instrument's corrections and measurement uncertainty.
Emilio Alfaro-Bou contributed experimental crashworthiness research at NASA Langley, including the use of measured aircraft crash pulses to test energy-absorbing seat structures. The publisher names him in full as the first author of the 1981 paper whose citation abbreviates the name to E. Alfaro-Bou.[ref]
Determination of crash test pulses and their application to aircraft seat analysis by E. Alfaro-Bou and others. Publisher author list and citation, DOI10.4271/810611
The study analyzed acceleration histories from twelve light-aircraft crash tests. It then used two vertical drop tests at to assess an energy-absorbing seat prototype under a specified impact pulse, comparing instrumented dummy and structural response with a finite element method model.[ref]
Determination of crash test pulses and their application to aircraft seat analysis by E. Alfaro-Bou and others. Author abstract, NASA NTRS19810058363 and publisher abstract
The physical question is how a load path changes the acceleration-time history; a static strength measurement alone does not answer it.For an original ideal pulse comparison, take a rigid test mass initially moving at . A constant opposing acceleration of stops it in over . Halving that acceleration to doubles the time to and the stopping distance to :Both pulses remove the same momentum per unit mass, , but require different deformation strokes. These stipulated constant pulses illustrate the tradeoff; they are not measured histories from the paper.
Francesco D'Angelo is an optical specialist associated with Edmund Optics, whose own laser-optics staff directory identifies him as a Senior Solutions Engineer.[ref]
Laser Optics Expertise staff directory at Edmund Optics. Meet the Team, labeled Francesco D'Angelo entry
He is the named author of the technical note Propagation of a Gaussian Beam Through a Thin Lens by Francesco D'Angelo, which explains Gaussian beam propagation and transformation by a thin lens.The note relates beam waist, beam divergence and Rayleigh range, then uses the complex beam parameter to calculate how a thin lens changes the beam. This connects an optical component specification to the actual position and size of a focused beam, instead of treating every incident beam as a perfectly parallel bundle of rays.[ref]
Propagation of a Gaussian Beam Through a Thin Lens by Francesco D'Angelo. Equations (2)–(5), propagation parameters; later thin-lens transformation
An illustrative consequence of the note's ideal Gaussian beam relation is easy to check. At a fixed wavelength , a beam waist radius of gives a far-field beam divergence half-angle of approximately . Halving the beam waist radius doubles that half-angle. Focusing to a smaller spot and obtaining lower beam divergence cannot be chosen independently within this model.[ref]
Propagation of a Gaussian Beam Through a Thin Lens by Francesco D'Angelo. Equations (3)–(5), ideal Gaussian waist-divergence relation
Stefan Meyer, the mass-spectrometry researcher identified by the 2017 paper below, developed automated analysis of time-of-flight mass spectrometry data with collaborators. The paper lists his affiliation with Space Research and Planetary Sciences at the University of Bern. Its motivation includes handling large numbers of measurements for chemical-composition studies in space instrumentation.[ref]
Fully automatic and precise data analysis developed for time-of-flight mass spectrometry by Stefan Meyer and others. p.580, full byline, affiliation and Abstract
The analysis connects sampled waveforms to mass-related quantities rather than treating every peak position as a known species. Its instrument calibration model relates the flight time to mass-to-charge ratio throughwith instrument-dependent constants and . Identified isotopes provide reference points for fitting the time-to-mass scale.[ref]
Fully automatic and precise data analysis developed for time-of-flight mass spectrometry by Stefan Meyer and others. p.582, equation(2) and calibration paragraph
For an original sensitivity calculation, suppose the corrected flight time is and a timing displacement of is introduced while the fitted constants are held fixed. The inferred ratio changes byor . A0.1-percent timing change therefore produces about a0.2-percent change in this modeled mass-to-charge value. This is a consequence of the square law, not the paper's measured accuracy for an instrument.
P. Matousek, identified by the Central Laser Facility as Pavel Matousek, developed spatially offset Raman spectroscopy for chemical measurements through diffusely scattering material. His institutional profile also describes work on optical parametric chirped pulse amplification and rejection of fluorescence in Raman spectroscopy.[ref]
Pavel Matousek by the Central Laser Facility. staff profile, scientific contributions
The 2005 team measured a buried trans-Stilbene layer below of Poly(methyl methacrylate) powder. The reported 19-fold contrast improvement concerned the buried layer's spectral visibility; it did not mean that the sample emitted 19 times as many Raman photons.[ref]
Subsurface Probing in Diffusely Scattering Media Using Spatially Offset Raman Spectroscopy by P. Matousek and others. Abstract, sample and unprocessed contrast result
For an original contrast example, a collection arrangement yielding 100 surface counts and 10 buried-layer counts has a buried-to-surface ratio . Another arrangement yielding 10 surface counts and 4 buried-layer counts has ratio . The ratio improves fourfold although the buried-layer count decreases. This illustrates why a collection geometry can make chemical identification easier without increasing absolute signal. Whether the second measurement is more precise also depends on noise, collection duration and background.
I. P. Clark coauthored the 2005 spatially offset Raman spectroscopy paper. Its collection geometry changes the mixture of signals arriving from an obscuring surface and the material below it.[ref]
The Research Complex at Harwell identifies Ian Clark as an Ultra instrument scientist and describes his work on a microbolometer array for measuring the focal size of infrared beams. Knowing a beam's size matters when comparing excitation conditions in time-resolved spectroscopy.[ref]
Ian Clark by the Research Complex at Harwell. researcher profile, infrared focal-spot measurement paragraph
For an original Gaussian beam example, suppose the pulse radiant exposure is , with total pulse energy . Integration over the transverse plane gives , so . If the actual radius is but the analysis assumes , it overestimates peak radiant exposure by , or . Measuring pulse energy alone therefore does not determine the excitation delivered per unit area. These values illustrate the dependence on spot size, not a measured error in Clark's apparatus.

E. R. C. Draper coauthored the 2005 demonstration of spatially offset Raman spectroscopy with P. Matousek and colleagues. The method distinguishes contributions from different depths by changing where scattered light is collected relative to the illuminated spot.[ref]
Subsurface Probing in Diffusely Scattering Media Using Spatially Offset Raman Spectroscopy by P. Matousek and others. byline and Abstract, lateral collection displacement
An original two-layer model makes the separation concrete. Let and be fixed surface and buried-layer Raman spectra. Suppose two collection arrangements measure and . The linear combination removes the surface spectrum exactly in this ideal model. The result depends on knowing the relative surface coefficients; it is not a claim that real tissue always follows these two numbers.
This example explains why a displaced detector can supply useful information even when a scattering sample prevents a sharp optical image of its interior. The two measurements have different mixture coefficients. Recovering the buried signal depends on that difference and on measurement noise, not solely on collecting more light.
M. D. Morris, or Michael D. Morris, is a chemist whose research connects Raman spectroscopy and chemical imaging with the composition and mechanics of bone and other tissues. His University of Michigan profile describes both instrument development and image processing for spectroscopic contrast.[ref]
A central idea is to retain a Raman spectrum at each sampled position instead of recording only brightness. A map of a phosphate band can then emphasize mineral, while a different spectral contribution carries information about protein. Morris and W. F. Finney also studied how bone spectra respond during controlled elastic loading.[ref]
As an original two-channel example, suppose reference responses for mineral and an organic component give measured intensities and . Measurements yield and by solving the linear system. These are model response coefficients, not automatically mass fractions: quantitative composition additionally requires suitable reference specimens and measurement calibration. The example shows why spectral information can separate contributions that a single brightness image mixes.

Michael D. Morris, portrait identified on his University of Michigan faculty profile
. A. E. Goodship coauthored the 2005 spatially offset Raman spectroscopy paper with E. R. C. Draper, M. D. Morris and the laser-spectroscopy team. The reported buried-layer demonstration used trans-Stilbene beneath a scattering Poly(methyl methacrylate) layer.[ref]
Subsurface Probing in Diffusely Scattering Media Using Spatially Offset Raman Spectroscopy by P. Matousek and others. byline and Abstract, physical feasibility demonstration
The experiment's motivation is chemical access through an obscuring surface. It should be distinguished from a direct measurement of material strength: identifying a Raman spectrum beneath a surface does not by itself measure a specimen's Young's modulus or establish that it will resist fracture.
For an original illustration, two hypothetical specimens can have equal mineral-to-organic spectral ratios while one contains a large crack. The ratio records a compositional contrast, whereas crack geometry changes the mechanical load path. Combining Raman spectroscopy with a mechanical test can therefore answer a different question from either measurement alone. This is a general measurement distinction, not an additional experimental result attributed to the 2005 paper.
N. Everall coauthored the 2005 demonstration of spatially offset Raman spectroscopy. By changing collection position, the experiment changed the relative surface and subsurface contributions to a measured Raman spectrum.[ref]
The result highlights an experimental distinction between removing an unwanted mean signal and removing its fluctuations. In an original idealized example, suppose a measured spectral channel contains 1000 expected surface counts and 100 expected buried-layer counts. Under independent Poisson photon counting, its variance is . Even if the surface mean of 1000 were known exactly and subtracted, the remaining estimate would still have standard deviation counts, not counts.
A surface estimate obtained from a second noisy spectrum adds further uncertainty. Optical collection that changes the mixture before detection can therefore offer something different from subtracting a large background afterward. The hypothetical counts explain a measurement principle; they are not experimental count values attributed to Everall or the 2005 paper.
M. Towrie coauthored the 2005 demonstration of spatially offset Raman spectroscopy. Its Raman spectroscopy measurement varied the lateral collection position to distinguish buried and surface signals.[ref]
The Central Laser Facility identifies the researcher as Mike Towrie and describes his work in the Ultra group and optical instrumentation. Such apparatus makes time and wavelength controlled experimental variables, rather than recording only a specimen's overall brightness.[ref]
Mike Towrie by the Central Laser Facility. staff profile, scientific background and Ultra work
An original timing example illustrates a constraint in pump-probe spectroscopy. A laser operating at sends successive pulses apart. If a sample takes to recover, approximately 100 pulse intervals fit into that recovery time. Treating every pulse as an independent measurement of an unperturbed sample would then need justification. The numerical sample is hypothetical; the calculation explains why repetition rate, recovery and excitation conditions belong in an experimental description.
W. F. Finney, published in full as William F. Finney, collaborated with M. D. Morris on using Raman spectroscopy to study bone under mechanical loading. Their experiment connected a change in a Raman spectrum to deformation of a living material's mineral component, rather than merely identifying its chemical ingredients.[ref]
The apparatus held hydrated mouse femora in a mechanical tester on a Raman spectroscopy microprobe stage. A load cell monitored the applied loading, which stayed below yielding, while the experiment followed shifts of a phosphate vibrational band. This joined a mechanical measurement to a molecular-scale probe of the loaded bone.[ref]
For an original illustration of the mechanical scale, a specimen segment of initial length that extends by has engineering strain , or . A simultaneous Raman shift measurement could track how a molecular vibration changes during that extension. The numerical extension is illustrative; it is not a reported value from Finney's experiment.
Pinned article: Introduction to the OurBigBook Project
Welcome to the OurBigBook Project! Our goal is to create the perfect publishing platform for STEM subjects, and get university-level students to write the best free STEM tutorials ever.
Everyone is welcome to create an account and play with the site: ourbigbook.com/go/register. We belive that students themselves can write amazing tutorials, but teachers are welcome too. You can write about anything you want, it doesn't have to be STEM or even educational. Silly test content is very welcome and you won't be penalized in any way. Just keep it legal!
Intro to OurBigBook
. Source. We have two killer features:
- topics: topics group articles by different users with the same title, e.g. here is the topic for the "Fundamental Theorem of Calculus" ourbigbook.com/go/topic/fundamental-theorem-of-calculusArticles of different users are sorted by upvote within each article page. This feature is a bit like:
- a Wikipedia where each user can have their own version of each article
- a Q&A website like Stack Overflow, where multiple people can give their views on a given topic, and the best ones are sorted by upvote. Except you don't need to wait for someone to ask first, and any topic goes, no matter how narrow or broad
This feature makes it possible for readers to find better explanations of any topic created by other writers. And it allows writers to create an explanation in a place that readers might actually find it.
Figure 1. Screenshot of the "Derivative" topic page. View it live at: ourbigbook.com/go/topic/derivativeVideo 2. OurBigBook Web topics demo. Source. - local editing: you can store all your personal knowledge base content locally in a plaintext markup format that can be edited locally and published either:This way you can be sure that even if OurBigBook.com were to go down one day (which we have no plans to do as it is quite cheap to host!), your content will still be perfectly readable as a static site.
- to OurBigBook.com to get awesome multi-user features like topics and likes
- as HTML files to a static website, which you can host yourself for free on many external providers like GitHub Pages, and remain in full control

Figure 2. You can publish local OurBigBook lightweight markup files to either OurBigBook.com or as a static website.
Figure 3. Visual Studio Code extension installation.
Figure 5. . You can also edit articles on the Web editor without installing anything locally. Video 3. Edit locally and publish demo. Source. This shows editing OurBigBook Markup and publishing it using the Visual Studio Code extension. 
- Infinitely deep tables of contents:




All our software is open source and hosted at: github.com/ourbigbook/ourbigbook
Further documentation can be found at: docs.ourbigbook.com
Feel free to reach our to us for any help or suggestions: docs.ourbigbook.com/#contact