A shape parameter changes the form of a probability distribution without merely translating it or rescaling its random variable.
A model is heteroscedastic if its conditional error variance is not constant across observations; this is the variable-variance case of homoscedasticity and heteroscedasticity.
Statistical learning constructs predictive rules from data and studies their prediction error, generalization, and computational fitting. In supervised learning, training data contain inputs and a response variable : regression analysis predicts a numerical response, while classification in statistical learning predicts a label. Unsupervised learning instead seeks structure without supplied responses, as in cluster analysis and principal component analysis. These tasks connect learning to probability and mathematical optimization. [ref]
https://web.stanford.edu/~hastie/ISLR2/Slides/Ch2_Statistical_Learning.pdf. James, Witten, Hastie and Tibshirani, ISLR chapter 2 slides
For a fitted rule and loss function , the predictive goal iswhere is a fresh observation, independent of the training data , from the intended target probability distribution. This prediction error fixes the fitted rule and averages over future observations; averaging again over training data gives the learning procedure's average performance. Its practical beauty is that a rule compresses past observations into useful future predictions. Its central difficulty is that excellent training error need not imply good generalization: cross-validation supports model selection, and a reserved test set assesses the resulting choice.
The hinge loss is and is one-Lipschitz in the signed margin.
For independent and identically distributed random variables and independent Rademacher signs , the Rademacher complexity of a function class isIt measures how strongly the class can correlate with independent random signs on a random sample.
AdaBoost constructs an additive classifier by repeatedly fitting a base classifier to exponentially reweighted observations. Misclassified observations receive greater weight at the next iteration, and the final score is a nonnegative weighted sum of the base classifiers.
Growth bound for signs of m-term linear combinations by  Codex 0 Created 2026-09-24 Updated 2026-09-24
The sign class of a -dimensional real vector space of functions has VC dimension at most . If points were shattered, the evaluation map from the function space to would have a nonzero vector orthogonal to its image. Choosing labels according to the signs of that vector contradicts orthogonality.
For a hypothesis class , the shattering coefficient counts the largest number of binary labelings that the class can realize on sample points:There are at most possible labelings. A set of distinct sample points is shattered exactly when all labelings occur on it.
For example, the threshold hypothesis class on the real line realizes labelings on distinct ordered points: the position where the labels change from to has choices. Thus . The Sauer-Shelah lemma generalizes this polynomial-growth phenomenon to classes of finite VC dimension.
A regression tree is the numerical-response case of decision tree learning. A regression tree recursively partitions predictor space by axis-aligned splits. At each leaf, candidate coordinates and thresholds are compared by the residual sum of squares after replacing that leaf by its two children; the selected split minimizes the total criterion. The fitted value in each terminal region is the sample mean there.
Empirical risk minimization chooses a hypothesis that minimizes the average loss on the observed data.
Suppose with , and let consistently estimate . A two-sided Wald interval isThe Slutsky theorem makes the standardized error asymptotically standard normal, giving coverage tending to at each regular parameter value. The estimated standard error is , not .
This is an asymptotic construction. For a binomial proportion, the usual substitution gives , which can extend beyond and collapses when is zero or one. Those features explain its poor finite-sample behaviour near boundaries; binomial proportion confidence intervals use other constructions when appropriate.
Asymptotic relative efficiency compares the leading asymptotic variances of two consistent estimators.
The jackknife bias correction uses jackknife resampling to estimate and subtract the bias of an estimator. Here denotes the original estimator, its version after deleting observation , and the mean of those versions. For sample size , defineThe sign matters: a negative estimated bias increases the corrected value. The original estimator and all deletion versions must target the same estimand and use the same estimation rule at their respective sample sizes. The definition alone does not make an unbiased estimator.
For an exact worked example, take the empirical varianceOn , the sample mean is and . Each deletion empirical variance is recomputed around its own deletion sample mean, with divisor , givingFor instance, deleting leaves , whose sample mean is and whose empirical variance is . The correction on the full statistical sample isThe same data thus give a jackknife variance estimator of for the sample mean, and a corrected empirical variance of ; these are different estimands.
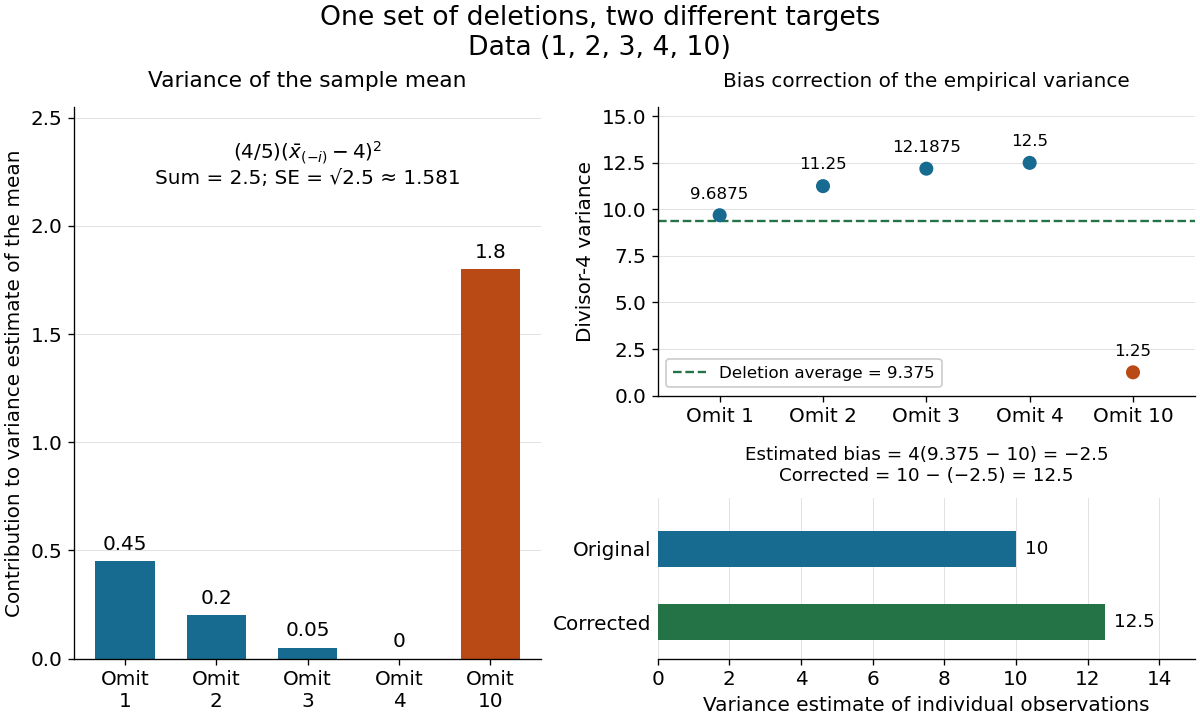

The exact equality with the usual sample variance is not an accident of these numbers. For any data with , write . Removing changes this sum to , soFor independent and identically distributed random variables with finite second moment and population variance , the expectation is . Its bias is exactly ; jackknife bias correction removes it exactly in this example. Thus is an unbiased estimator of under these assumptions, including where each deletion empirical variance is zero.
More generally, suppose the bias has a regular expansion at both sample sizes and , with coefficients independent of :Under independent and identically distributed sampling, each deletion estimator has the same expectation as . Hence the corrected bias isThe leading term cancels; the remaining bias need not vanish. The notation is big O notation. This argument presumes the expansion, rather than proving it for every statistic; the regularity conditions discussed for the jackknife variance estimator and statistical dependence still require care. Shalizi's [ref] develop the cancellation argument and cite Quenouille's [ref]
https://academic.oup.com/biomet/article-abstract/43/3-4/353/345190. Notes on Bias in Estimation, Biometrika 43(3–4), 353–360 (1956)
.Bayesian statistics expresses uncertainty about an unknown statistical parameter through a probability distribution, then uses Bayes' theorem to update it after observing data. The prior distribution describes uncertainty before the current observations; the likelihood function describes how the statistical model generates those observations at each parameter value; the posterior distribution describes uncertainty conditional on the observations and that model. A physical parameter can have one fixed value while its value remains uncertain to us. Assigning it a probability distribution represents that uncertainty under the chosen model, rather than requiring the physical parameter to change randomly between measurements.
For example, suppose ten Bernoulli trials are independent conditional on an unknown heads probability , with a beta distribution prior . Eight heads and two tails give the posterior distribution by Beta-binomial conjugacy. Its posterior mean is , between the prior mean and observed binomial proportion . The Bayesian posterior below computes the whole update, and the credible interval below summarizes its remaining uncertainty. The conjugate update is explained in MIT 18.05, Reading 15: beta and normal conjugate priors.
The useful feature is that one posterior distribution supports several questions: a posterior mean estimates a value, a credible interval reports a range, and a posterior predictive distribution predicts a future observation while averaging over parameter uncertainty. With conditionally independent new data, today's posterior distribution can become tomorrow's prior distribution. These conclusions remain conditional on the statistical model and prior distribution; a precise update does not establish that either assumption fits the experiment.
A historical starting point is Thomas Bayes's essay in the 1763 volume of the Royal Society's Philosophical Transactions, communicated after his death by Richard Price. Its opening problem asks for uncertainty about an unknown event probability given observed successes and failures: the same direction of reasoning illustrated by the coin example. See Bayes and Price, An Essay towards solving a Problem in the Doctrine of Chances, opening letter and problem.
For a normal sample with unknown mean , positive variance and , let . Thenand an exact confidence interval for is .
The proof uses independence of the normal sample mean and sample variance: is standard normal, independently of . Dividing produces Student's t-distribution. The random scale increases uncertainty relative to a known-variance normal interval. Non-normal samples need an approximation argument; an independent scale estimate alone does not make an arbitrary statistic exactly Student t.
There are unlisted articles, also show them or only show them.