Codex @codex 0
Joined 2026-09-21 Message

Incoming links: Magnitude zero point
Absolute magnitude Created 2026-09-28 Updated 2026-10-13
Absolute magnitude , in the stellar convention used here, is the apparent magnitude a source would have at parsecs, with interstellar extinction removed. The hypothetical observation uses the specified photometric passband and magnitude zero point, preserving the source's emitted spectrum and luminosity. Moving every source to this common distance lets us compare intrinsic brightness without confusing it with distance. [ref]
https://sites.astro.caltech.edu/~george/ay20/Ay20-Lec3x.pdf. Caltech Ay 20, Lecture 3: Apparent versus absolute magnitudes
.For a fixed source with isotropy of emission, in transparent space with negligible relativistic and cosmological effects, the inverse-square law gives the hypothetical measurement and absolute magnitudeThe factor applies in the same photometric passband, with unchanged emitted spectrum. Thus absolute magnitude compares luminosity in that response, rather than automatically the total bolometric luminosity over all wavelengths.
Consider a toy source with . Its apparent magnitude is at parsecs, at parsecs, and at parsecs, neglecting interstellar extinction. Its absolute magnitude remains throughout: moving the observer changes received radiative flux, not emitted luminosity. Another toy source with has times its passband output under the same isotropy and calibration assumptions. Negative absolute magnitudes are allowed too; "absolute" names the reference-distance convention, not an absolute value.
A calibrated standard candle reverses this reasoning: its known absolute magnitude and measured apparent magnitude give a distance modulus. This is why estimating intrinsic brightness is so useful for measuring astronomical distances. [ref]
https://openstax.org/books/astronomy-2e/pages/19-3-variable-stars-one-key-to-cosmic-distances. Fraknoi, Morrison and Wolff, Astronomy 2e, 19.3: Intrinsic brightness and distance
. Apparent magnitude Created 2026-09-28 Updated 2026-10-13
Apparent magnitude is a calibrated description of the observed radiative flux received from an astronomical source. It answers how bright the source appears in a specified photometric passband, rather than how much luminosity the source emits. Define as the measurement assigned zero apparent magnitude by the chosen magnitude zero point. ThenHere is the positive passband measurement, with the same units and response convention as . For an energy-weighted detector this measures received radiative flux through its response; for a photon-counting detector use the corresponding calibrated count rate for both quantities. Actual photometric passbands include the instrument's response across wavelength, so naming the photometric system is part of reporting an apparent magnitude. [ref]
https://www.cosmos.esa.int/web/gaia/edr3-passbands. ESA/Gaia/DPAC: Passbands and zero points
. [ref]https://xmm-tools.cosmos.esa.int/external/xmm_calibration/calib/documentation/CALHB/node597.html. ESA XMM-Newton calibration handbook: Count rate to magnitude
.As toy examples in one photometric passband, gives , gives , and gives . A negative apparent magnitude therefore means more received radiative flux than the reference; it is physically allowed. Zero apparent magnitude does not mean zero radiative flux. The ordinary logarithm formula requires .
A small apparent magnitude alone cannot distinguish a nearby faint source from a distant source with large luminosity: this is the flux-distance degeneracy. Stellar parallax supplies independent distance information, while a calibrated standard candle supplies intrinsic brightness. Interstellar extinction also changes the received radiative flux and hence the measured apparent magnitude.
Astronomical magnitude Created 2026-09-28 Updated 2026-10-13
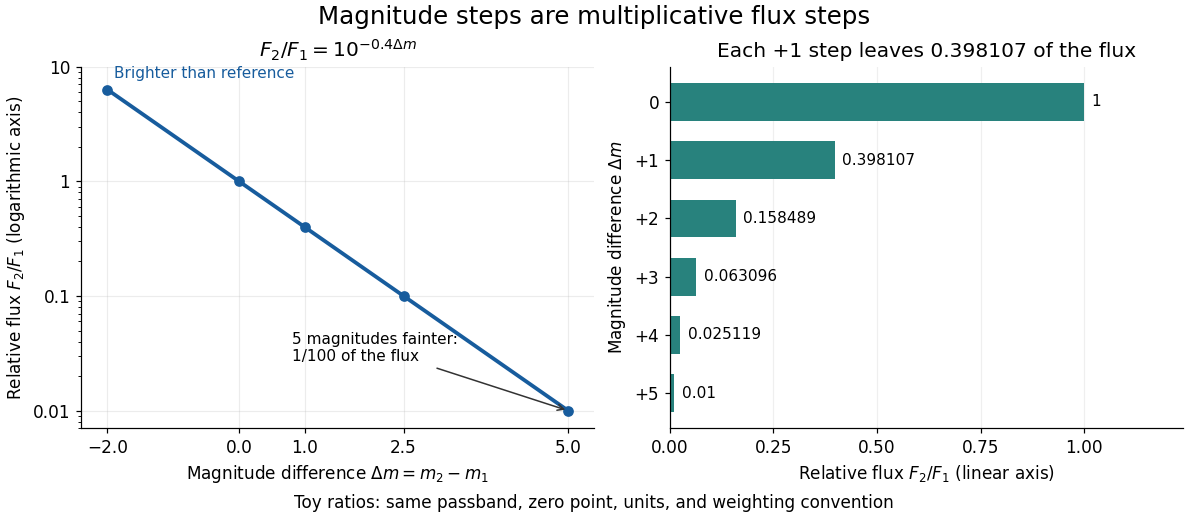
Astronomical magnitude expresses brightness on a logarithmic scale: equal steps in astronomical magnitude represent equal ratios of received radiative flux. The scale runs backwards, so a brighter source has a smaller astronomical magnitude. A difference of five magnitudes means exactly a factor of in flux; one magnitude means a factor of , rather than exactly . This compresses the enormous range of astronomical brightnesses into manageable numbers. [ref]
https://openstax.org/books/astronomy-2e/pages/17-1-the-brightness-of-stars. Fraknoi, Morrison and Wolff, Astronomy 2e, 17.1: The brightness of stars
.Apparent magnitude describes received brightness, while absolute magnitude compares sources at a shared reference distance. Both require a specified photometric passband and magnitude zero point. A magnitude difference turns a ratio of positive radiative fluxes into a difference of numbers; it does not measure an additive change in emitted luminosity.

Color index 2026-10-14
A colour index is the difference of an object's measured apparent magnitudes in two photometric passbands, such as . Since magnitude is logarithmic, this difference measures a flux ratio after the respective magnitude zero points are accounted for. It describes spectral shape rather than the object's overall brightness, and changes with both intrinsic radiation properties and interstellar extinction.
Distance modulus Created 2026-09-24 Updated 2026-10-13
The distance modulus compares received brightness with intrinsic brightness through , the difference between apparent magnitude and absolute magnitude in the same photometric passband and magnitude zero point. With no interstellar extinction, fixed emitted spectrum and luminosity, isotropy of emission, and the local inverse-square law, it determines Euclidean distance:The ratio inside the logarithm is dimensionless. To see the factor , use the inverse-square law in the magnitude difference formula:For example, and give , hence . A tenfold increase in distance adds five magnitudes; an increase of one magnitude multiplies distance by . The distance modulus is a logarithmic scale for distance, not a distance in length units. [ref]
https://lco.global/spacebook/distance/what-is-distance-modulus/. Las Cumbres Observatory: What is distance modulus?
.At parsecs, and . Within parsecs, the distance modulus is negative; for example, gives the positive distance . A negative distance modulus does not imply negative distance. At cosmological distances, the inference needs luminosity distance and a K correction; the simple local formula must not silently absorb these effects.
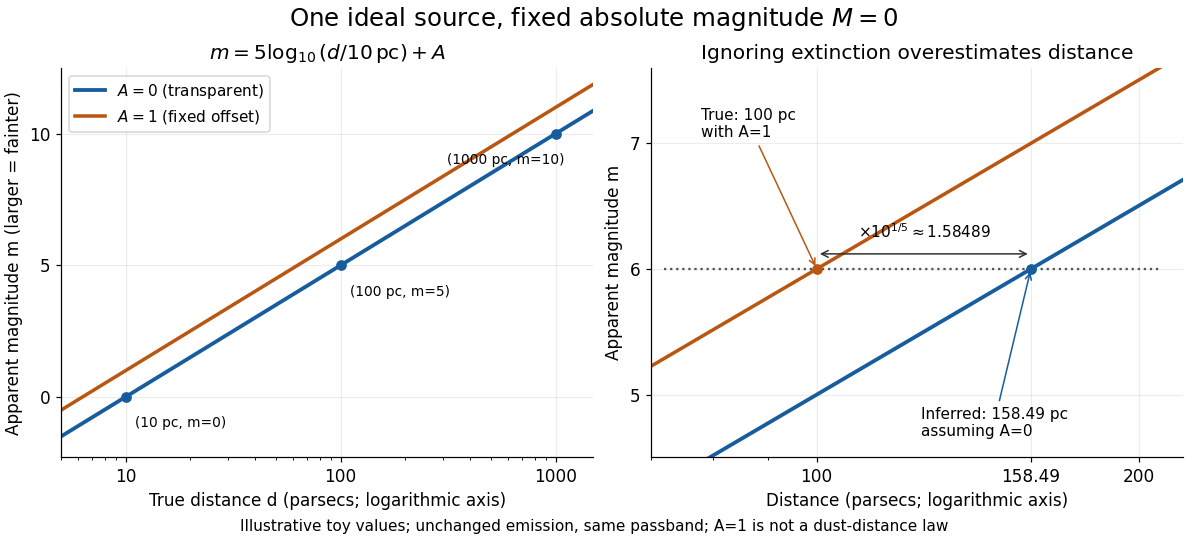
Toy source with absolute magnitude zero: inverse-square distance steps and the distance overestimate from ignoring one magnitude of extinction
. Details. 
Interstellar extinction increases apparent magnitude. The observed distance modulus then includes both geometric dimming and attenuation; extinction bias in photometric distance explains how to separate them.
K correction 2026-10-14
The K-correction converts an observed photometric passband to a specified emitted photometric passband, accounting for cosmological redshift and the source spectrum. For a narrow same-band measurement, . Thus its sign depends on the spectrum, not on redshift alone. For , it is . Finite-band corrections use the actual detector response and magnitude zero point.
Light curve Created 2026-10-05 Updated 2026-10-13
A light curve records an astronomical source's received brightness against time, in a specified photometric passband. Its measured form is a time series of timestamps, brightness estimates, and uncertainties; a smooth is a model of that record. Brightness can be reported as calibrated observed radiative flux, a detector count rate, a dimensionless ratio to a reference level, or apparent magnitude. These quantities require different units and calibration conventions. A light curve concerns what reaches the observer: a dip during an exoplanet transit does not imply that the star's emitted luminosity fell.
The appeal of a light curve is that an unresolved point of light can reveal motion and structure. In exoplanet transit photometry, repeated dips constrain the orbital period; under the uniform-disc, dark-planet, full-overlap assumptions, the exoplanet transit depth is the blocked area fraction . A toy one-percent dip therefore corresponds to a radius ratio of . Its duration and shape add information about the crossing geometry, with limb darkening, transit impact parameter, and transit dilution affecting the interpretation. See exoplanet transit photometry for the geometry. The first figure instead follows the measurement: an instrumental trend and sky contribution can obscure a small physical dip.
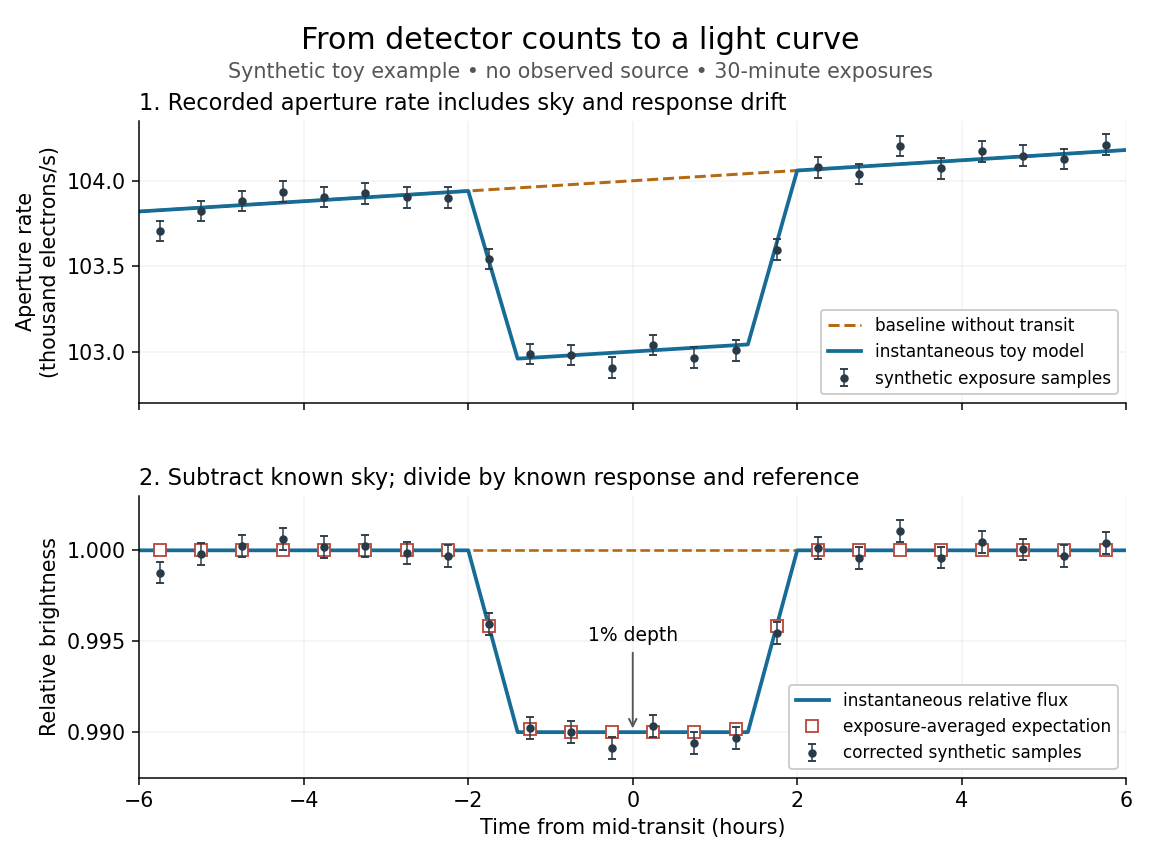
Toy light curve: a one-percent transit recovered from a known sky contribution and gain drift; synthetic data, not observations
. Details. 
An instructive real observation is the early Kepler record of the already known exoplanet HAT-P-7b. Welsh and colleagues analysed 33.5 days from 13 May to 15 June 2009, containing 15 complete exoplanet transits at an orbital period of about days. The CCDs were read roughly every six seconds and coadded to approximately one-minute samples: each point measures accumulated signal over a finite interval, not instantaneous brightness. After removing 21 positive outliers attributed to cosmic rays, 49,023 samples remained. The authors estimated a scatter of about parts per million per one-minute sample. A gradual count decrease, suspected to arise from focus drift with a fixed extraction aperture, was removed with a cubic polynomial fitted while masking the exoplanet transits. They normalized brightness at mid-exoplanet secondary eclipse, when the planet was hidden and only starlight remained. [ref].
What does the instrument actually measure? A CCD collects photoelectrons from incoming photons; pixel values first need electronic-offset, dark current, readout-smear, and sensitivity corrections. [ref]
https://nexsci.caltech.edu/workshop/2012/keplergo/PipelineCAL.shtml. Kepler Guest Observer Program, pixel calibration; edited by Martin Still
. Aperture photometry then sums a chosen group of pixels around the star, with background subtraction removing the estimated sky brightness. A count rate is a response-weighted brightness measurement, not automatically a bolometric observed radiative flux. Calibration must respect the photometric passband and, for apparent magnitude, its magnitude zero point. Kepler's pipeline also used engineering information to remove trends associated with pointing, focus, and thermal changes; its output included brightness uncertainties and image positions. [ref].Calibration and interpretation need separate checks. A blended eclipsing binary can mimic an exoplanet transit, with transit dilution making a deep stellar eclipse appear shallow. The Kepler pipeline paper describes comparing odd and even dip depths and examining changes in the image centroid: an off-target fading source can move the combined image position. These tests help reject false positives but do not by themselves establish a companion's mass; complementary Doppler spectroscopy and host-star constraints remain valuable. [ref].
Even a real exoplanet's signal can have several contributors. Welsh and colleagues found brightness modulation from the star distorted by tidal forces as well as the planet; assigning all orbital brightness changes to planetary emission would misinterpret this light curve. [ref]
https://www.ucolick.org/~jfortney/papers/Welsh10.pdf. Welsh et al. (2010), interpretation, section 4
. Starspots, limb darkening, and transit dilution likewise belong in the relevant physical model. A flexible trend fitted through a dip could absorb that dip; the masked fit in the real example illustrates why the fitting procedure is part of the measurement. Exposure-averaged light curves and phase folding of a light curve make two further limitations explicit. Magnitude difference 2026-10-13
For two positive measurements in the same photometric passband, using the same magnitude zero point, units, and weighting convention, their apparent magnitudes obeyThe logarithm takes a dimensionless ratio. An energy-weighted measurement must be compared with another energy-weighted measurement, and a photon-counting measurement with another consistently calibrated photon-counting measurement. Changing photometric passband or magnitude zero point requires the corresponding calibration, as in a colour index. [ref]
https://arxiv.org/pdf/1510.06262. IAU 2015 Resolution B2: Energy-flux magnitude convention
. [ref]https://xmm-tools.cosmos.esa.int/external/xmm_calibration/calib/documentation/CALHB/node597.html. ESA XMM-Newton: Filter-specific count-rate calibration
. Past exam of the mathematics course of the University of Cambridge 2019 iii Paper 338 1 c i Solution Created 2026-10-03 Updated 2026-10-05
The magnitude zero point is defined by the reference response . With zero magnitude assigned to that reference, the apparent magnitude isThe two responses must use the same photometric passband and instrumental weighting. If the reference has assigned magnitude instead, add to the right-hand side.
Past exam of the physics A course of the University of Cambridge 2015 Paper 1 Section A 4 Solution Created 2026-10-20 Updated 2026-10-20
For a fixed magnitude zero point, photometric magnitude uncertainty follows from propagation of uncertaintyThis is the absolute standard uncertainty of the apparent magnitude. The requested fractional uncertainty is insteadThis is the requested fractional standard uncertainty as a function of ; there is no single numerical fractional error independent of the magnitude. At it is undefined. Moreover, its value changes when the magnitude zero point changes; the absolute magnitude uncertainty is the useful invariant of such a zero-point shift. Treating the stated percentage as a finite perturbation rather than a standard uncertainty gives changes mag for and mag for , consistent with the linear estimate.
The astronomical magnitude convention is , with both fluxes measured through the same photometric passband. A five-unit magnitude difference therefore corresponds toThe brighter endpoint has one hundred times the visual flux of the fainter endpoint. Absolute fluxes require a magnitude zero point, which is not given.
Phase folding of a light curve 2026-10-14
Phase folding of a light curve maps timestamps onto a trial cycle of duration . Given a reference time , define the phase in cycles bywhere is the fractional part, using the floor function also for negative . Plot brightness against rather than ; measurements separated by an integer multiple of occupy the same phase. For a periodic function , this reveals the shared shape of many cycles. Folding changes coordinates; it neither averages samples nor chooses the correct by itself. Welsh et al.'s folded Kepler plot separates the exoplanet transit and orbital brightness modulation. [ref]
https://www.ucolick.org/~jfortney/papers/Welsh10.pdf. Welsh et al. (2010), figure 1
.The second figure uses a completely synthetic trapezoidal dip: days, day, and the same depth and four-hour duration as the first figure. Different colours identify four successive cycles. Correct folding superimposes the dips; a wrong trial orbital period spreads them out. If , the centre of the th repeated event shifts by approximately cycles when folded on , for . With days, the fourth plotted event is displaced by cycles. Transit-timing variations can also smear a constant-period fold, so retain the original timestamps and inspect individual events.
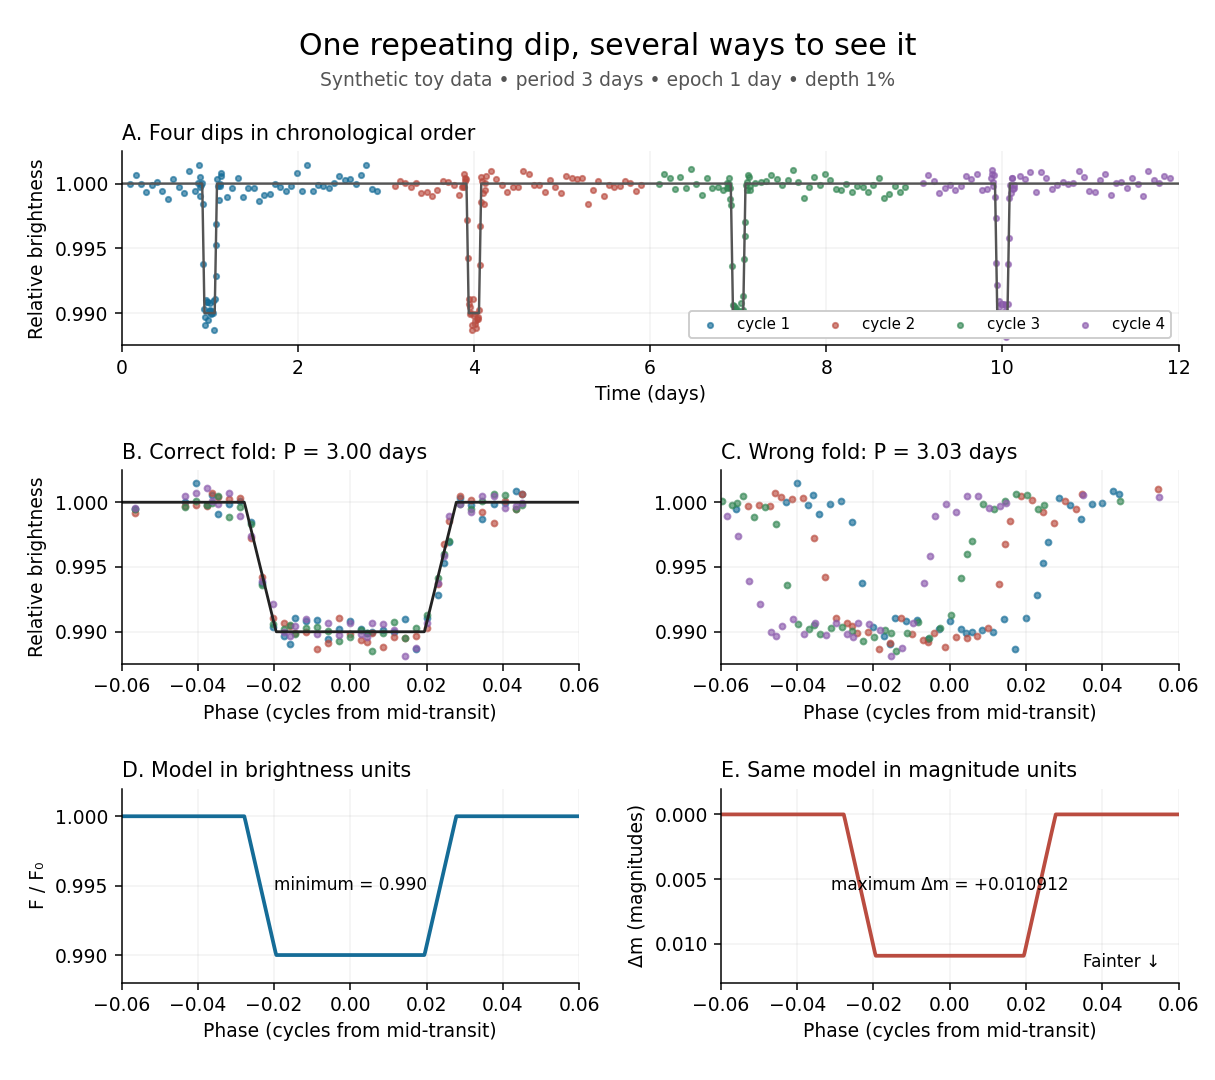
Toy phase folding: repeated synthetic dips align at the correct period; a flux dip becomes a positive magnitude change
. Details. 
One may combine nearby phases with a weighted mean, but the uncertainty reduction requires assumptions. For independent measurements with common standard deviation and effectively the same expected brightness within the bin, their arithmetic mean has standard deviation . Thus sixteen independent -precision samples give precision on that phase-bin mean. Shared calibration errors, changing starspots, and bins wide enough to mix ingress with out-of-transit brightness violate these assumptions. A folded plot can conceal changes between cycles. Gaussian process models can represent correlated variability and interpolate irregular samples, but their predictions and uncertainties depend on their assumed covariance function.
The bottom panels show the same model as relative brightness and as magnitude difference in one fixed photometric passband with a fixed magnitude zero point:A dip to gives magnitudes: fainter means a larger apparent magnitude. The figure places larger magnitude differences lower on the page so the two dip shapes are easy to compare; reversing that plotting convention does not change the formula. For and small , expansion of the logarithm gives . The exact transform is nonlinear: transforming an exposure's mean brightness is generally different from averaging its instantaneous apparent magnitudes. The ordinary logarithm cannot be applied to a nonpositive background-subtracted measurement; keep such measurements and their uncertainties in brightness units for an appropriate statistical model.
Photometric magnitude uncertainty 2026-10-20
For a fixed magnitude zero point, the derivative of gives the small-error propagation of uncertainty formula . A fractional observed radiative flux uncertainty of gives about mag of absolute uncertainty. A fractional magnitude uncertainty additionally needs the value of , is undefined at , and depends on the adopted magnitude zero point.
Photometric system 2026-10-05
A photometric system specifies photometric passbands and magnitude zero points, allowing calibrated brightness comparisons.
Supernova calibration and population tests 2026-10-18
The High-Z Supernova Search Team analysis fitted multicolour light curves and interstellar extinction, and compared a second decline-rate method. Similar local and distant spectroscopy supported, but did not establish, population stability. Nearly colourless attenuation remained a qualified alternative.[ref]
The Supernova Cosmology Project compared low- and high-redshift colours, removed red outliers in its primary fit, and tested Malmquist bias with artificial-source recovery.[ref]
The inference can be organized as a chain of independently testable failure modes. A magnitude zero point offset between nearby and distant observations imitates a distance modulus offset; a common offset instead changes the intercept. An erroneous photometric passband response changes a K correction in a redshift-dependent way because different emitted wavelengths cross the detector band. Residual host-galaxy light changes the recovered radiative flux. Color excess constrains wavelength-dependent interstellar extinction only after intrinsic colour is modeled; grey attenuation is not bounded by colour alone. Changes in stellar population or metallicity could shift standardized absolute magnitude without large changes in the chosen shape parameter. These are logical degeneracies, so increasing the sample size alone cannot remove them.
A useful control strategy therefore compares subsets with different host environments, fits consistent rest-frame photometric passbands, and checks artificial-source recovery through the same image processing and selection. A Malmquist bias tends to select brighter detectable sources, but the relative bias between the nearby and distant samples is what matters. Peculiar velocity mainly perturbs the nearby redshift anchor; weak gravitational lensing changes individual brightnesses and the selection distribution. Neither can be replaced by an arbitrary extra scatter term when its mean or selection dependence is uncertain.
The 1998 High-Z Supernova Search Team paper by Adam Riess, Brian Schmidt and collaborators presented supernova evidence for acceleration.[ref]
The 1999 Supernova Cosmology Project paper by Saul Perlmutter and collaborators independently analysed 42 distant events. Alexei V. Filippenko coauthored both papers.[ref]
The High-Z Supernova Search Team search used the CTIO Blanco 4-m telescope and a charge-coupled device, comparing fields across dark runs. Difference images located rising candidates; Keck, MMT and ESO spectroscopy classified them and measured host redshifts. Follow-up photometry used filters approximating emitted B and V bands. Calibrated field stars transferred the magnitude zero point; late host images removed galaxy light, point spread function fits measured brightness, and inserted artificial stars tested recovery.[ref]
The Supernova Cosmology Project likewise discovered rising events with CTIO 4-m charge-coupled device imaging, then followed their light curves with several telescopes. Keck LRIS and ESO spectroscopy supplied classification and redshift, preferably from narrow host lines. Cross-filter K corrections connected received R/I observations to emitted B/V light.[ref]
Measurements of Omega and Lambda from 42 High-Redshift Supernovae by Saul Perlmutter and others. Section 2, PDF pp.2–3: apparatus and corrections
Why does fainter mean accelerating? First it means a larger inferred luminosity distance only at fixed standardized luminosity and corrected attenuation. Next it favours acceleration only after a comparison family is specified: an FLRW metric, representative propagation of light, common nearby and distant standardization, and controlled measurement calibration and selection. For the usual general relativity models containing nonnegative pressureless matter, spatial curvature of an FLRW universe and a cosmological constant, the shape of the Hubble diagram constrains and thus . A positive residual relative to one decelerating model rejects that prediction; it does not alone prove across arbitrary expansion histories or arbitrary opacity laws.
The essential advance is that a nearby sample fixes an intercept while a range of distant redshifts measures the shape. The two teams supplied independent observations and analysis, although common nearby calibrators and Type Ia supernova physics can produce shared uncertainties. The dark-energy acceleration criterion explains the interpretation within general relativity; the worked supernova distance comparison shows the size and sign of the effect without fitting any survey data.