Use the divisor- sample covariance matrix, since this is the normalization that enters the multivariate normal likelihood function:For a covariance matrix that is a positive-definite matrix , the product of the multivariate normal densities givesTo separate the sample mean from the sample covariance matrix, expand . The cross terms sum to zero because . Also by the trace identity. ThereforeThe printed expression suppresses the parameter-independent constant ; dropping this constant has no effect on maximum likelihood estimation or the likelihood-ratio test.
With the divisor- sample covariance matrix defined above, the maximum-likelihood estimators areTheir joint sampling distribution is specified byHere uses the Wishart distribution convention . Thus the covariance maximum-likelihood estimator has expected value ; the unbiased estimator of the covariance matrix is . These distributions follow from orthogonal projections of the jointly multivariate normal observations onto the constant-observation direction and its orthogonal complement, though no proof is required here. The covariance maximum in the positive-definite parameter space requires nonsingular, which holds almost surely when and is positive definite. Otherwise the rank of a centered sample covariance matrix shows why the usual unrestricted finite maximum does not exist.
Under the unrestricted model, insert the maximum-likelihood estimates . Under the diagonal-covariance restriction, the quadratic form is minimized over the mean at , and the remaining objective separates over the diagonal entries:Differentiating in gives ; the derivative changes from negative to positive there. Put . The fitted trace term is under either model, since . Consequently the likelihood-ratio test statistic is determined byThis is the Gaussian diagonal-covariance likelihood-ratio test. Reject for sufficiently small , equivalently for large . Under the regular large-sample calibration, Wilks theorem gives , since diagonality removes that many free covariance parameters. The exact critical constant can instead be obtained from the null distribution at the actual sample size.
For , write the sample correlation coefficient as . Then , so the likelihood-ratio test rejects for large , not merely for large positive . Under the null, the two variables have a bivariate normal distribution and are independent, and the exact test isIndeed, condition on the centered first-variable observation vector. Decompose the second centered Gaussian vector into its component along that direction and the -dimensional orthogonal complement. Their squared lengths give independent and variables. Their ratio shows that has Student's t-distribution with statistical degrees of freedom.
Treat each row as a set of attributes with response one. The binary option computes the Jaccard distance, rather than counting matches at joint absences. For a pair of rows, let count coordinates equal to one in both, count , count , and count . ThenThe denominator counts coordinates present in at least one row; joint absences do not contribute. If both rows have no presences, use distance zero. This differs from normalized Hamming distance, which would divide by all ten coordinates.
For Philip and Chad, four attributes are present in both and eight in at least one, giving Jaccard distance . Graham and Tim differ in one of eight coordinates present in their union, giving , printed as . Fred and Gbenga have identical profiles, hence distance zero despite being different students. The resulting dissimilarity matrix is symmetric with zero diagonal;
dist2full restores the other half and the diagonal from the stored pairwise entries. The display rounds entries for readability; the agglomerative hierarchical clustering uses the original unrounded distances.The output describes complete-linkage clustering: the distance between two current groups is the largest original Jaccard distance between a member of one and a member of the other. Starting with singleton groups, agglomerative hierarchical clustering merges a closest pair at each step. In the merge array, a negative index denotes the original row of that number, and a positive index denotes the group created at that earlier merge. A printed height is the dissimilarity at which the new group forms.
Reading those references recursively gives the following dendrogram construction, with exact heights recovered from the binary profiles:
- Fred and Gbenga join at ; Graham and Tim join at ; Chad and Nicolas join at .
- Frederic joins Chad–Nicolas at , and John then joins that group at the same height . These tied heights produce successive branches on the same horizontal level.
- Philip and Mark join at ; Garfield joins Fred–Gbenga at .
- Graham–Tim joins Philip–Mark at ; Chad–Nicolas–Frederic–John joins Garfield–Fred–Gbenga at .
- Sauli joins Graham–Tim–Philip–Mark at , and Juliet joins that group at .
- The two remaining groups join at .
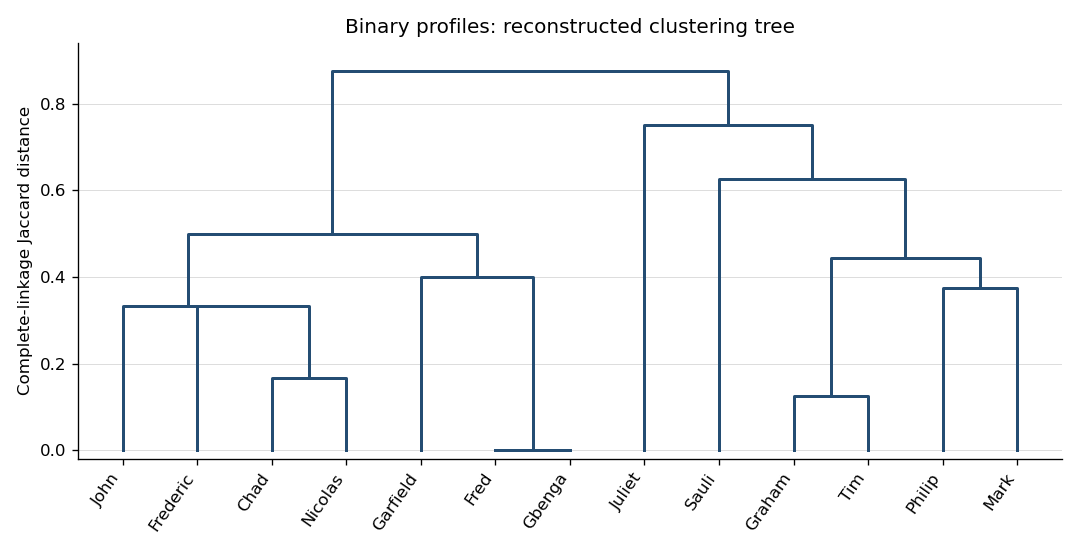
Complete-linkage dendrogram reconstructed from exact binary-profile distances
. Details. For example, a cut strictly between and gives four groups: Chad–Nicolas–Frederic–John–Garfield–Fred–Gbenga, Graham–Tim–Philip–Mark, Sauli, and Juliet. A cut strictly between and gives two larger groups. The leaf order is not intrinsic; the merge memberships and heights are. Reflecting branches leaves the dendrogram unchanged in meaning. The zero-height pair indicates identical recorded responses, while high joins indicate comparatively dissimilar profiles. These conclusions depend on the choice of Jaccard distance, which ignores shared negative answers; the dendrogram itself does not establish substantive demographic classes.
Take logarithms entry by entry before centering. For tree , let , and put . The command
var(log(b)) computes the sample covariance matrix with the unbiased estimator normalizationThus entry is the sum of products of the centered log measurements divided by , not the logarithm of the covariance between the original measurements. Its diagonal entries are the three log-variable sample variances, and the off-diagonal entries are their sample covariances. The positive off-diagonal entries indicate positive association of the log measurements. Taking logarithms turns a multiplicative relation such as into the approximately linear relation , which motivates investigating principal components of these transformed observations.The command centres the log measurements and performs principal component analysis of their covariance matrix. With
cor=F, it does not first standardize the variables to variance one. For a unit principal component loading vector , the score has sample variance . By the spectral theorem for real symmetric matrices, expand in an orthonormal eigenbasis; that variance is a weighted average of the eigenvalues. Its maximum is the largest eigenvalue, reached at the corresponding eigenvector. Repeating subject to orthogonality to previous directions gives the other principal components.The software uses the divisor- sample covariance matrix for its component standard deviations, whereas
var used divisor . Diagonalizing the displayed matrix gives approximatelyTaking square roots of the latter gives , agreeing with the output to the rounding of the displayed sample covariance matrix. The normalization changes these numerical standard deviations but leaves the eigenvectors and proportions of explained variance of a principal component unchanged.The first principal component explains about of the total log-variable variance, the second another , and the last about . Keeping two preserves about . An original scree plot displays the sharp drop after the first component:
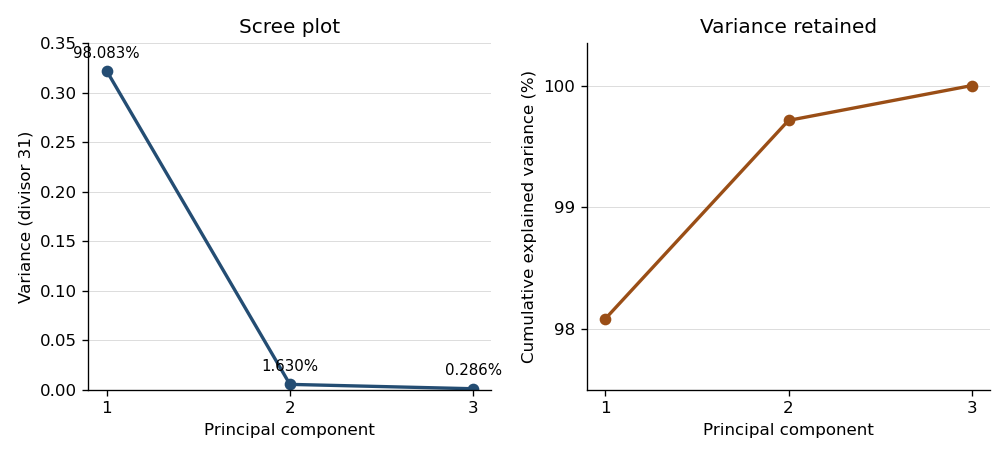


Consequently the centered cloud is very elongated along one direction: a one-dimensional approximation represents almost all of its squared variation. From the displayed covariance matrix, a unit first eigenvector, with its arbitrary sign chosen positive, is approximatelyIts principal component score is therefore . All coefficients have the same sign, so this direction describes overall tree size, with log volume dominating the unstandardized variation. The summary alone supplies proportions, not the loading directions; the displayed sample covariance matrix supplies the latter. This is a geometric approximation, not evidence of an exact deterministic relation or independent original variables.
One further use is principal component analysis on a correlation matrix, obtained with
cor=T, which equalizes marginal variances and answers a different scaling-sensitive question. Another is principal component regression: fit a response to selected principal component scores rather than highly correlated original predictors, choosing the number using prediction assessment. The fitted transformation also projects new measurements into the same low-dimensional coordinates, provided the training centering and scaling are retained.Write the binary incidence matrix of a set system as to avoid confusing it with a sample size. Thencounts the number of blocks containing treatment , and for , counts blocks containing both treatments. The displayed structure therefore makes every treatment replication equal to and every pair concurrence equal to .
Assume the usual nonempty block design, with and . If , any block containing one treatment contains every other treatment: otherwise that treatment's replication would exceed its concurrence with the omitted one. Every block is consequently complete, so and . With random allocation within blocks this is a randomized complete block design. If , the design is a balanced incomplete block design. Counting partners of a fixed treatment in its blocks givesFor , gives , hence . Moreover has eigenvalue on the -dimensional zero-sum subspace and eigenvalue on the constant direction. Thus , while . This proves , the Fisher's inequality for block designs. The case allows singleton blocks; their lack of connectedness prevents general treatment comparison after block adjustment, but does not invalidate the rank inequality.
First ignore the day information and use a one-way normal linear model with five group means and independent errors of common variance. There are observations. The analysis of variance has treatment, residual and corrected-total statistical degrees of freedom , respectively. The mean squares in ANOVA giveUnder equal treatment means this has the F-distribution with degrees. It exceeds the given upper critical value , so the unblocked analysis rejects equality at .
The actual day allocation omits a different treatment on each of the five days. Hence it is a balanced incomplete block design withEvery pair occurs on exactly the three days omitting neither member. In the additive two-way analysis of variance, use an intercept, four independent treatment contrasts and four day contrasts. The design is connected, so the model rank is and its residual has statistical degrees of freedom. Day effects and treatment effects are not orthogonal, because a different treatment is absent each day; the unadjusted treatment sum of squares cannot be used for the adjusted test.
Enter days first and then treatments. The supplied sequential sums of squares giveThe day, treatment-after-day, residual and corrected-total statistical degrees of freedom are . Under the additive normal linear model and the null of equal treatment effects, the adjusted numerator and residual squared lengths are independent chi-squared quantities, so the ratio has the F-distribution with degrees. It is below even the given critical value . After accounting for days there is no significant treatment difference at either or . This inference assumes independent homoscedastic normal errors and an additive day effect; with one observation per observed treatment–day cell, unrestricted interactions cannot also be fitted.
Code each two-level factor as a sign . A factorial contrast indexed by a factor subset has sign column , with the empty subset giving the intercept. Construct a regular fractional factorial design by choosing independent words and retaining the settings satisfying , where each . In binary exponent notation these are independent linear equations over , leaving freely chosen coordinates and exactly settings. Dependence of the chosen words would fail to give the stated fraction size.
The words generated by multiplying the form the defining contrast subgroup , of order . Multiplication cancels a repeated factor, so word multiplication is symmetric difference of subsets. On the fraction, is constant for every , and henceTo see that these are all the aliases, average over the fraction. If , this is a nonconstant character of its freely varying binary coordinates; pairing settings that reverse that character makes the average zero. If , the product is constant. Thus the aliasing in a fractional factorial design classes are exactly the cosets of . For a half fraction, with , and every contrast column is aliased with exactly the other word , with a plus or minus sign according to the chosen fraction. This includes the defining word paired with the intercept.
For the six-factor experiment, take the 32-run half fractionIts resolution of a fractional factorial design is VI. Every main effect is aliased with a five-factor interaction, and every two-factor interaction with a four-factor interaction. In particular, no two required low-order effects are aliased with one another. Under the stated negligible-higher-interaction assumption, all six main effects and the fourteen required two-factor interactions are estimable before introducing blocks.
To form four equal days, classify runs by the two signsTheir product is . The three nonconstant block contrasts therefore coincide with the treatment-column alias classesOnly among the main effects and two-factor interactions is lost to block confounding in a factorial design; the other two block directions involve only negligible three-factor interactions.
Here is an explicit construction of every run without an ambiguous generator convention. For each day sign pair , choose freely and setThere are eight distinct settings per day and 32 in total. Direct multiplication gives , and . Conversely those three equations solve uniquely from , so there are no missing or repeated settings. Assign the four sign pairs randomly to the four days, and randomize the eight runs within each day.
Distinct nonaliased factorial contrasts are orthogonal over the fraction. None of the 20 required low-order contrast columns belongs to a block class, so all are also orthogonal to the three block-effect columns. Their joint design matrix, including an intercept, therefore has rank . The analysis of variance partition isThe eight residual directions are the remaining unconfounded three-factor alias classes. They estimate error only under the negligible-higher-interaction assumption; they are not a separate replicated pure error stratum. This provides the requested comparisons within exactly four days of eight runs.
For the initial normal linear model, the design matrix has rows . The eight factorial corners have balanced signs and orthogonal coordinate columns; the six centre points contribute only to the intercept. ConsequentlyUsing the least-squares normal equations gives the least-squares estimatorIt is a linear transformation of independent normal responses, so its sampling distribution isThe four estimated coefficients are independent, since they are jointly normal with diagonal covariance matrix.
Adding the axial settings produces a central composite design: eight factorial corners, six axial points and six replicated centre points. The axial distance is the rounded value of . With that exact distance it is a rotatable design for a full quadratic model. Indeed, sign symmetry annihilates odd moments, all coordinates have the same second moment, and the fourth moments satisfyRotational symmetry requires the first to be three times the second, giving . Using the printed rounded distance makes rotatability approximate, rather than mathematically exact.
The full quadratic regression mean has ten coefficients:The expanded design matrix has rank ten. To verify this rather than just count parameters, suppose such a quadratic vanishes at every setting. Its centre value sets its constant term to zero; subtracting the values at opposite axial points sets every linear coefficient to zero, and adding them then sets every squared-coordinate coefficient to zero. On the factorial corners, orthogonality of the three pair-product columns forces their coefficients to zero as well. Thus all ten columns are independent, leaving residual statistical degrees of freedom.
There are distinct settings: eight corners, six axial points and the centre. The six centre replicates give the only pure error, with degrees and sum of squares . The saturated setting-mean model has parameters, so the lack of fit beyond the quadratic model has degrees. For any setting with replicates, the identitysplits the residual sum of squares into pure error and lack of fit; the cross term vanishes because the deviations from the setting mean sum to zero. Summing givesUnder a correct quadratic mean with independent errors of constant normal variance, the pure-error and lack-of-fit projections are orthogonal, hence their sums of squares are independent with respective distributions and . The Lack-of-fit F-test therefore usesThis is below the given and critical values and . There is no significant lack of fit at either level. That is failure to reject this quadratic mean, not proof that it is exact or that a maximum has already been located. The pure-error denominator also assumes the error variance at the centre represents the common variance throughout the experiment.
Articles by others on the same topic
There are currently no matching articles.