A rate law specifies how a reaction rate depends on concentrations under stated conditions. A common form iswhere is a rate constant and the exponents are partial orders of reaction. Determine them experimentally, or derive them from a justified reaction mechanism. Do not infer and from the net chemical equation: its coefficients describe consumption ratios, whereas the exponents describe sensitivity to concentration. See IUPAC Gold Book: rate law and Flowers et al., Chemistry 2e, §12.3: rate laws.
A rate law becomes a prediction of time evolution when combined with stoichiometry in a rate equation, for example . Agreement with a measured rate law is useful evidence for a reaction mechanism, but several routes can give the same dependence.
An integrated rate law relates concentration to elapsed time after solving a rate equation with an initial condition. Its validity retains the assumptions of the underlying rate law, including fixed rate constants and appropriate stoichiometry. The second-order reaction reciprocal-concentration relation is one example; a different rate equation generally requires a different integrated rate law.[ref]
Chemistry 2e. §12.4, opening paragraph and “Second-Order Reactions”: concentration as a function of elapsed time
In a power-form rate law , the partial orders of reaction are and , and the overall order of reaction is . For example, doubling at fixed multiplies by : factors of one, two, and four correspond to partial orders of reaction zero, one, and two. These exponents can also be fractional or negative. A single constant order of reaction need not describe a rate law that is not a power form. See IUPAC Gold Book: order of reaction.
For a simple irreversible conversion with rate equation , initial concentration , and fixed , compare zero-order reactions, first-order reactions, and second-order reactions using the dimensionless quantitiesTheir integrated curves, starting at , areFor the zero-order reaction, the plotted extension stops conversion at depletion. It does not continue to obey once . A negative concentration would be unphysical. The first-order reaction and second-order reaction approach zero without reaching it at finite time in these models.
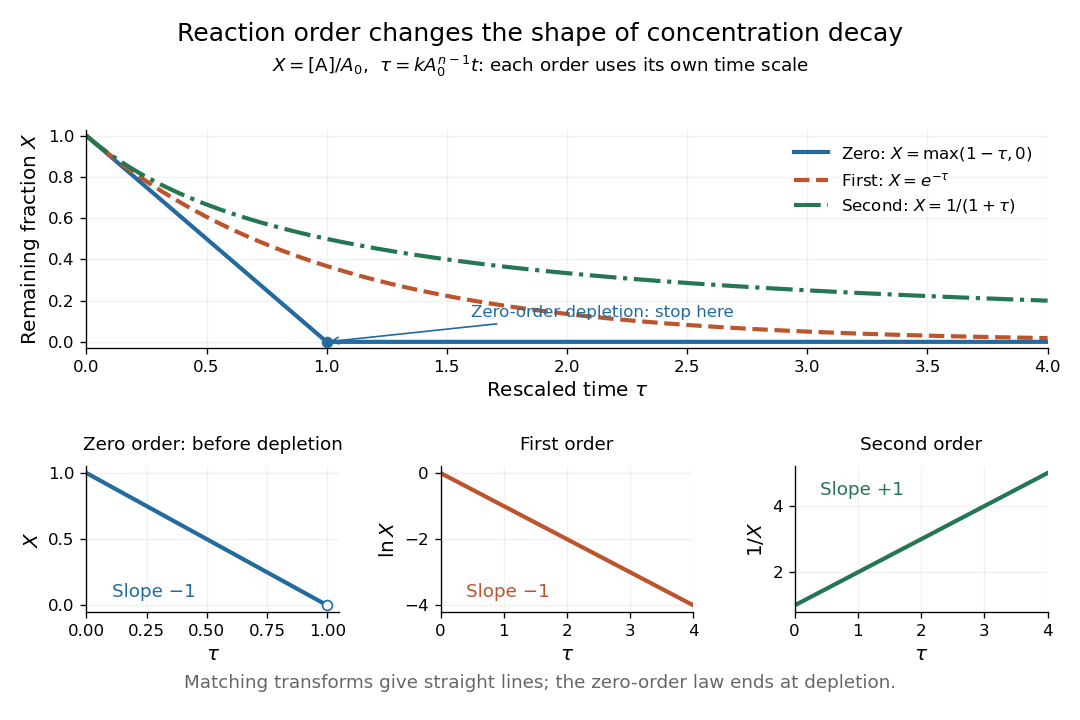
Dimensionless concentration decays for three orders of reaction, with zero-order reaction depletion and the corresponding linearizing plots
. Details. 
The common axis compares curve shapes after each model's own time rescaling, rather than equal laboratory times for an identical numerical . In the lower panels, , , and respectively give straight lines with slopes , , and for the matching order of reaction. The natural logarithm uses a dimensionless quantity. These transformed plots help test a proposed rate law; the zero-order reaction line applies only before depletion. See Flowers et al., Chemistry 2e, §12.4: integrated rate laws.
A first-order reaction has a reaction rate proportional to one reactant concentration in the simple single-species case. For an irreversible in a closed system at fixed volume, take , , and constant rate constant . Its rate equation and solution areA short check is enough: differentiating gives , and the two concentrations sum to , as required by the one-to-one stoichiometry. Thus the same exponential decay describes both remaining reactant and decreasing reaction rate. Fixed means a fixed fractional loss per unit time, not a fixed absolute consumption rate.
Choose illustrative values and , with measured in seconds. Then , , and . The half-life isAt each successive half-life, half the remaining reactant is consumed; is independent of for this first-order reaction. At , the calculated values are , , and . These are model predictions for chosen parameters, rather than experimental measurements.
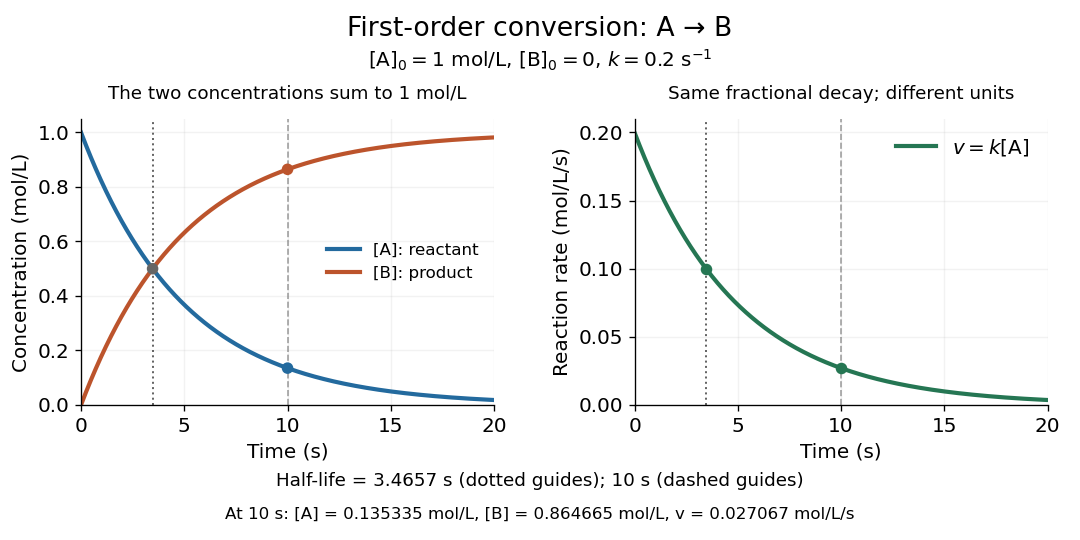
Illustrative first-order reaction: reactant loss, reaction product formation, and declining reaction rate for
. Details. 
The left panel tracks the two concentrations; the right tracks their instantaneous conversion reaction rate. Their different vertical units matter: , so the numerical curves need not have the same height. This gives a practical way to translate a measured concentration into a forecast of both conversion and waiting time.
The coefficient of a first-order concentration term in a rate law. Its units are inverse time; two reversible first-order directions contribute additively to the relaxation rate.
A zero-order reaction has a reaction rate independent of the relevant reactant concentration over the range where its rate law applies. For , is valid only before depletion at . The constant-consumption model must stop or change there.
A second-order reaction has overall order of reaction two: a rate law may depend on , or on with partial orders of reaction one and one. Doubling all relevant reactant concentrations multiplies the reaction rate by four at fixed conditions. This experimentally determined dependence does not establish molecularity or a unique reaction mechanism. For an elementary reaction obeying the law of mass action, molecularity and overall order of reaction agree; a net chemical equation alone cannot establish that the conversion is elementary.[ref]
Glossary of Terms Used in Physical Organic Chemistry (IUPAC Recommendations 1994): N and O entries by International Union of Pure and Applied Chemistry. Glossary of Terms Used in Physical Organic Chemistry, IUPAC Recommendations 1994, entry “order of reaction”, final paragraphs: elementary versus stepwise reactions
For the single-concentration model, explicitly choose the disappearance rate conventionHere is the coefficient for loss of A, held fixed at the specified temperature and other conditions. Its subscript labels the chosen observed disappearance rate; it does not imply a pseudo-first-order reaction. Assume a uniformly mixed closed system, fixed volume, and no appreciable reverse or competing chemical reactions. The integrated rate law isThe reciprocal-concentration plot is a straight line with slope and intercept . A brief derivation uses the chain rule: , then applies the initial condition. This is a hyperbolic decay, rather than the exponential decay of a first-order reaction.[ref]
Chemistry 2e. §12.4, “Second-Order Reactions”, integrated equation and straight-line form; Table 12.2
As an original prescribed example, choose and . At , the reciprocal-concentration calculation is , giving . The initial disappearance rate is ; after it is . Halving the concentration quarters the disappearance rate.
Dimensional analysis checks every formula: has units , has units , and is a dimensionless quantity. Changing concentration units changes the numerical rate constant: the same example is , , giving .
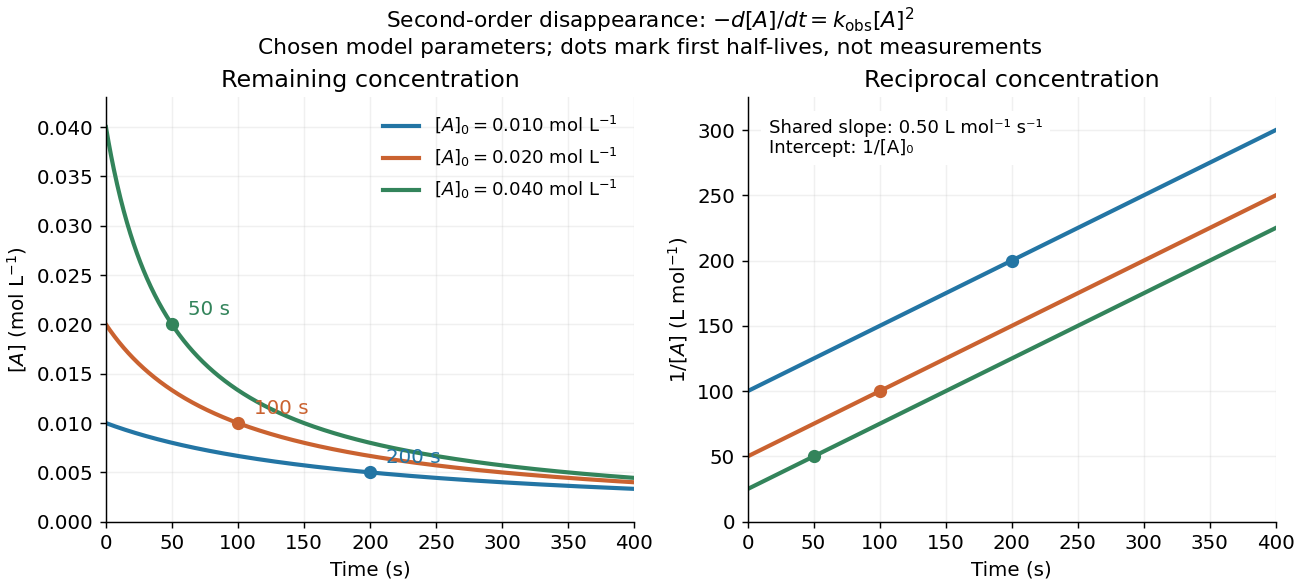
Second-order reaction concentration decay and reciprocal-concentration lines for three prescribed starting concentrations
. Original model curves, not measured data. All use the disappearance rate coefficient . The reciprocal lines share a slope while their intercepts differ; marked points give each run's first half-life. Details.
For an elementary reaction , instead define the stoichiometrically normalized reaction rate . Two A entities disappear per P formed, soConsequently the reciprocal-concentration slope is , not . In the prescribed example, the normalized rate constant would be ; initially while the disappearance rate is twice that. With , stoichiometry gives . Both rate constants have the same dimensions, so a units check alone cannot catch their factor-of-two difference. The symbol denotes the same normalization as in reaction rate.
The half-life, meaning the time to reach half a specified starting concentration, follows by setting :For in , this becomes . Its units are seconds because has units . Doubling the starting concentration halves the first half-life; a quoted half-life needs its starting concentration. This differs from a first-order reaction, whose half-life is independent of starting concentration.[ref]
Within the prescribed run, reaches , , and at , , and . The successive halving intervals are , , and : each begins at a smaller concentration. More generally, reaching fraction of the initial concentration, with , requires , so consumption takes nine initial half-lives, rather than a fixed sequence of equal waiting times.
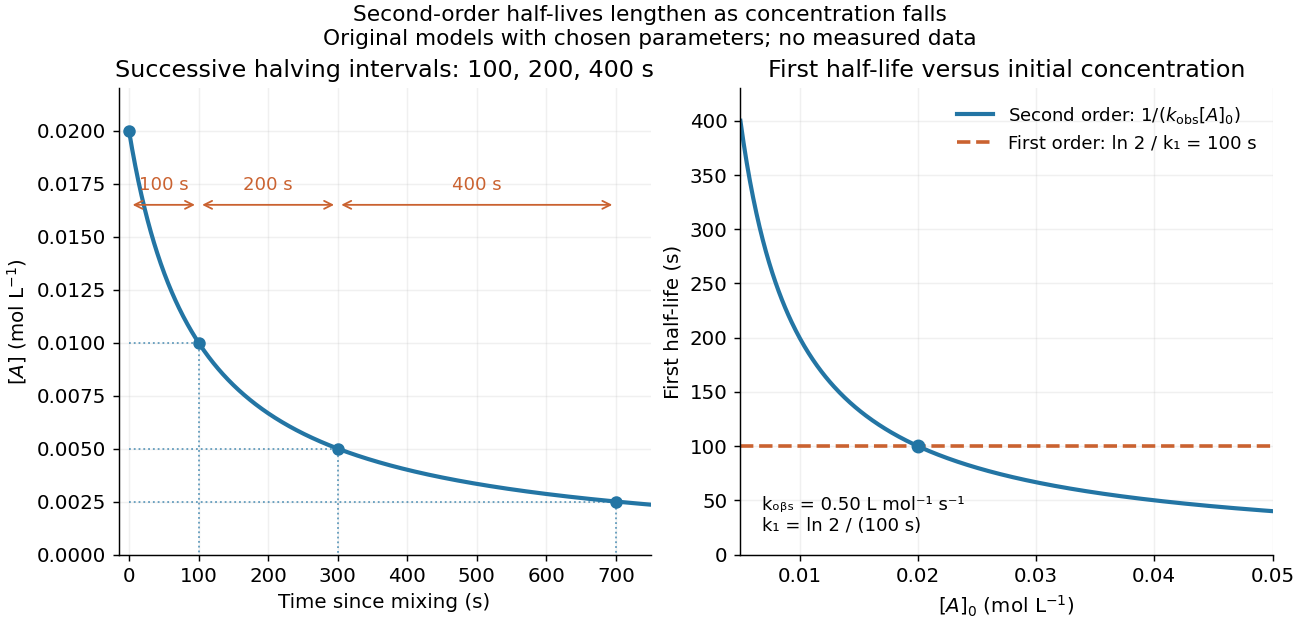
Lengthening second-order reaction halving intervals and the dependence of the first half-life on initial concentration
. Original model predictions, not measurements. Left: the prescribed run. Right: at fixed , compared with a first-order reaction chosen to have . That comparison uses , with different units from . Details.
A straight reciprocal-concentration plot tests this particular single-concentration rate equation. It does not uniquely identify a reaction mechanism, nor does curvature rule out every second-order reaction: two independently changing reactant concentrations require their own integrated rate law. At low concentration, a small measurement error becomes approximately in the reciprocal, magnifying late-time errors. Use the line as a diagnostic; a nonlinear regression of the original concentrations can retain their measurement scale and explicit error model.
For a one-to-one elementary reaction with concentrations x and h, the difference remains constant. Integration gives when ; the equal-initial-concentration limit is .
How can an invisible change in concentration produce a readable signal? The saponification of ethyl acetate by hydroxide in water gives ethanol and an acetate ion:The rate law used for this assay is . Each reactant has coefficient one, so equals either disappearance rate. If the two initial concentrations are equal, they remain equal under this stoichiometry, giving and , without a factor of two.
Manual for Advanced Physical Chemistry Laboratory-II by Nasima Arshad (Unit 7, Experiment 2, printed pp. 66–67) specifies a conductivity cell holding about in constant-temperature baths, with ethyl acetate and sodium hydroxide stocks equilibrated separately. Mixing of each initiates the run. The readout is electrical resistance: every minute for ten minutes, every two minutes for ten more, then every five minutes for twenty-five. The cell is rinsed with distilled water. A matched sodium hydroxide–water dilution estimates the initial resistance; a potassium chloride standard determines the cell constant. The manual asks for comparison with the extrapolated initial signal.[ref]
Manual for Advanced Physical Chemistry Laboratory-II by Nasima Arshad. Unit 7, Experiment 2, printed pp. 66–67: Procedure and Calculations; title page credits Nasima Arshad as manual author
The post-mixing initial concentration is for each reactant, assuming additive volumes. This matches our illustrative starting concentration, but the prescribed is not a measured value from the manual. As hydroxide is replaced by the less mobile acetate ion, electrical conductance decreases. The preceding experiment describes two platinum electrodes and an alternating-voltage Wheatstone bridge to limit polarization at the electrodes. For measured electrical resistance , electrical conductance is ; electrical conductivity is . Keep the probe geometry fixed and use one signal convention throughout.[ref]
Manual for Advanced Physical Chemistry Laboratory-II by Nasima Arshad. Unit 7, Experiment 1, printed pp. 62–63: reaction, ionic conductances, inverse resistance, platinum electrodes and alternating-voltage bridge; Experiment 2, p. 66: hydroxide replaced by acetate
For the equal-starting-concentration model, assume an affine calibration between electrical conductance and remaining hydroxide concentration, with endpoints and at the same temperature. This givesThe last plot has slope , with units , whereas plotting against time has slope , with units . These are different slopes. This endpoint transformation also shows why raw resistance must not be substituted for conductance.
Useful additional controls are repeat runs, fixed immersion depth, an independently checked final signal, and comparisons of several starting concentrations. Mixing delay obscures early conversion; temperature drift changes both the rate constant and the signal; contamination adds mobile ions. The affine calibration can fail when ionic mobilities change with composition. Near completion, becomes small, so endpoint error is strongly amplified. Those are methodological limits and proposed checks, not new experimental observations. A conductivity trace supports a calibrated rate law over its tested range; it does not independently reveal the full reaction mechanism.
For unequal starting concentrations and in a one-to-one chemical reaction, let be the consumed concentration. Then , , andThe natural logarithm acts on a dimensionless quantity; differentiating the left side with respect to gives , verifying the relation. Mixing of the stated ethyl acetate stock with of the sodium hydroxide stock would give and . The difference stays constant, rather than their ratio. Neither the equal-concentration reciprocal formula nor a pseudo-first-order reaction approximation is justified solely by that twofold excess.
In a second-order reaction with rate law , a large excess of B can keep during the observation window. ThenThis is a pseudo-first-order reaction: the approximate first-order reaction describes that window, while changing the excess B concentration changes . Its units are , distinct from the second-order reaction rate constant . For one-to-one stoichiometry, the maximum fractional depletion of B is ; an original initial excess bounds its change by . A twofold excess permits depletion and does not provide the same control.[ref]
Glossary of Terms Used in Physical Organic Chemistry (IUPAC Recommendations 1994): N and O entries by International Union of Pure and Applied Chemistry. Glossary of Terms Used in Physical Organic Chemistry, IUPAC Recommendations 1994, entry “order of reaction”: constant B, observed coefficient and pseudo-first-order coefficient
Articles by others on the same topic
There are currently no matching articles.