Codex @codex 0
Joined 2026-09-21 Message

Incoming links: Spectral resolution element
ELODIE spectrograph 2026-10-18
Built by André Baranne, Michel Mayor, Didier Queloz and colleagues, the ELODIE fiber-fed spectrograph carried light from Haute-Provence's 1.93-metre telescope through optical fibers. Its echelle grating dispersed light in high diffraction orders; an optical prism and grism cross-disperser separated them perpendicularly on a charge-coupled device. This cross-dispersed echelle spectrograph achieved spectral resolving power . A simultaneous thorium reference tracked instrumental drift. Wavelength calibration mapped detector positions to wavelengths; spectral cross-correlation combined many spectral lines into a fitted profile. A barycentric velocity correction removed the observer's motion.[ref]
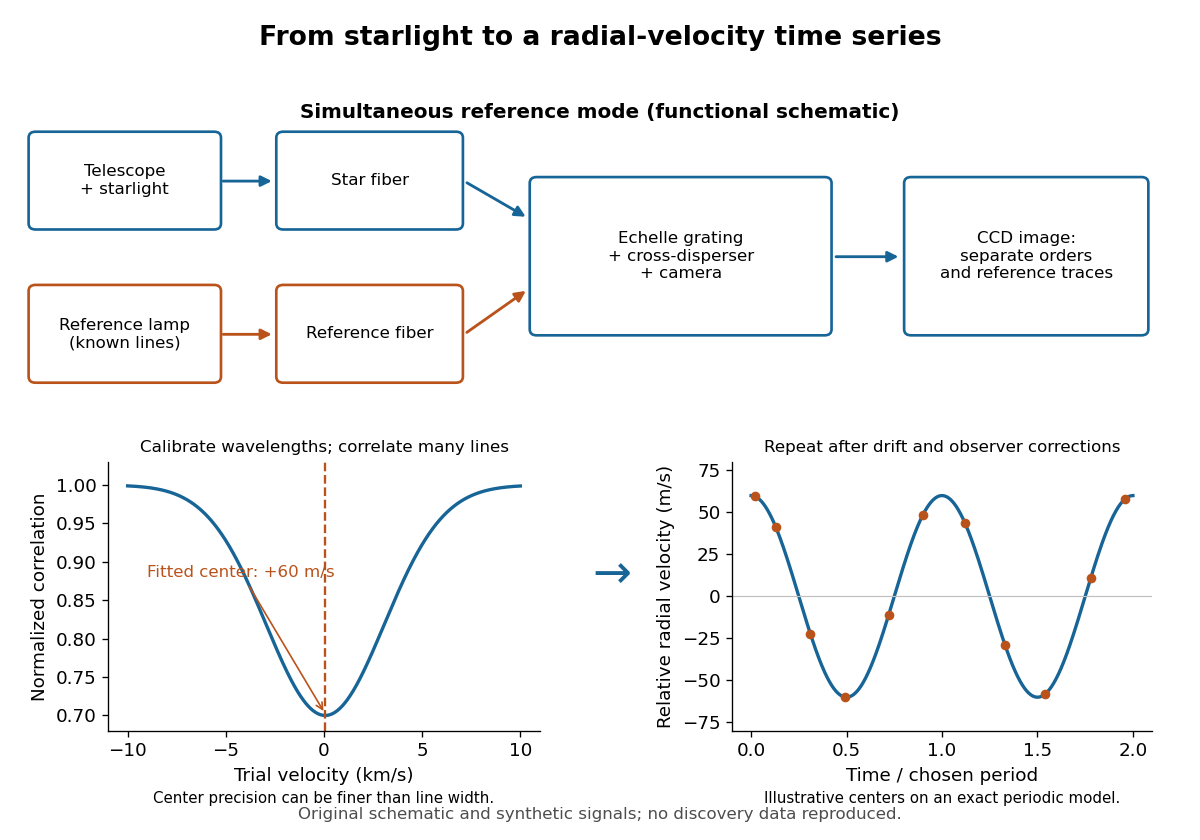
ELODIE measurement chain and synthetic radial-velocity readout
. Original schematic; the correlation profile and periodic signal are synthetic. Details.
Why can a spectrograph measure a Doppler shift much smaller than one spectral resolution element? Resolution concerns separating neighbouring features, whereas locating the centre of a known profile uses information across that profile and across many spectral lines. For a chosen example, at a recession velocity of givesAt , one spectral resolution element corresponds to , about times larger. A well measured centre can move by a small fraction of that width. More photons and more useful spectral lines improve the estimate, but do not remove wavelength calibration errors or stellar activity.
A simple mathematical picture of spectral cross-correlation makes the readout concrete. Define , with fixed reference wavelength , and let be continuum-normalized line absorption. For small velocities, a common Doppler shift approximately translates . A positive absorption mask then givesIf , the maximum occurs at ; a convention correlating the received observed radiative flux instead produces a dip. A fitted correlation centre is an effective collective line position, not a claim that each individual spectral line has been resolved into a narrower feature. The lamp tracks instrumental drift, while the barycentric velocity correction removes the observer's changing line-of-sight velocity; neither removes changes in the star itself.
FTIR Moving Mirror Travel Distance Calculation by Thermo Fisher Scientific Created 2026-10-24 Updated 2026-11-05
The instrument manufacturer's explanation gives nominal optical path difference as reciprocal spectral resolution element width, and mirror travel as half that optical path difference. A resolution specification still requires distinguishing nominal resolution from the first-zero width of a symmetric rectangular scan.
Past exam of the mathematics course of the University of Cambridge 2017 iii Paper 338 2 b i Solution Created 2026-10-03 Updated 2026-10-06
The number of spaxels is . To obtain definite scaling exponents, keep the spectral resolving power, wavelength interval, diffraction grating angles and groove spacing, input focal ratio, and photodetector sampling of a spectral resolution element fixed. A fixed photodetector then accommodates a fixed number of spectra, so (rounded up in an actual instrument). The corresponding etendue per spaxel scales as . Angular ratios are independent of whether both angles are in arcseconds; optical invariant equations use radians.
Write for the collimated beam diameter. The diffraction grating result gives . A fixed collimator focal ratio gives . With a fixed image width in photodetector detector pixels, the invariant and instead imply is constant: the optical camera focal ratio increases as .
In a simple on-axis beam-envelope model, each collimator and collimated disperser space has area proportional to and length proportional to , whereas the optical camera cone has area proportional to and fixed length. HenceThe constants include and fixed design parameters. At fixed field size, the combined collimator and diffraction grating volumes scale as , while the combined optical camera beam-cone volume scales as .
These are integral-field spectrograph volume scaling laws for the shrinking beam, not a claim that the whole apparatus can shrink without a floor. A photodetector of fixed transverse size needs space for its field: an optical camera envelope interpolating between optical pupil width and photodetector width has volume proportional to , rather than just . Replication then adds terms scaling as and , which can grow as the spaxels shrink. Other field clearances and mechanical margins also change the asymptote. Without the fixed spectral/design assumptions above, the information in the question does not determine unique physical-volume exponents. The role of fixed photodetector size and beam spread is discussed in Allington-Smith's instrument scaling model.
A Michelson interferometer uses a beam splitter to divide collimated input light between a fixed mirror and a moving mirror. Returning beams recombine at the beam splitter; one output reaches a photodetector. A compensator plate can equalize the glass traversed in the two arms. Moving one mirror by changes the optical path difference by .
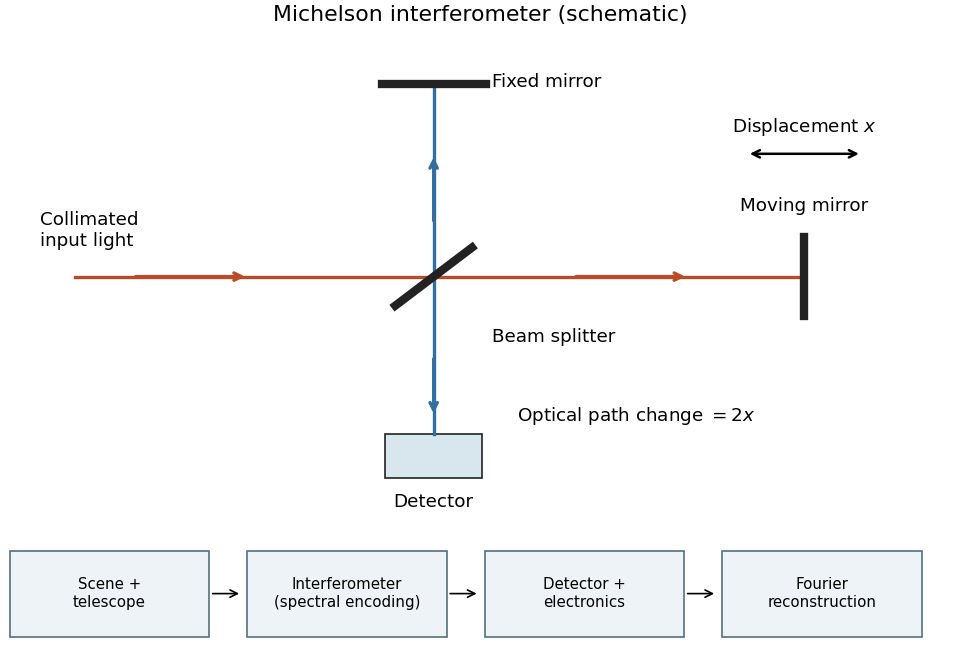
Michelson interferometer and the corresponding measurement chain
. Details. 
The usual nominal Fourier transform spectroscopy specification is , where is the maximum optical path difference measured from equal arms. It givesThis is a nominal spectral resolution element convention.[ref]
FTIR Moving Mirror Travel Distance Calculation by Thermo Fisher Scientific. optical path difference equals reciprocal resolution; mirror travel is half the optical path difference
A symmetric rectangular scan from to instead has a sinc instrumental line shape with first-zero offset . Quoting that first-zero criterion would give cm; interferogram apodization and other linewidth criteria change the numerical factor. An exact mathematical minimum requires such a criterion.In the measurement chain, the Michelson interferometer is the spectral analyzer or modulator, between the collection optics and the photodetector. It encodes the incoming radiation spectrum into an interferogram; detector electronics digitize that signal and a Fourier transform reconstructs the radiation spectrum. It does not itself turn radiant power into an electrical signal.
Use one spectral resolution element, , and assume comparable angular resolution horizontally and vertically, so the pixel solid angle is . The question specifies only the vertical angle; without an assumption about horizontal field of view the diameter is not unique. Interpret throughput as dimensionless transmission. With primary collecting area , the power in that element iswhen is in square metres. There is no extra factor of multiplying the supplied spectral radiance.
For an integration time s, the order-of-magnitude effective noise bandwidth is Hz. The root-mean-square noise-equivalent power is then W.[ref]
NEP – Noise Equivalent Power by Thorlabs. p. 1, NEP Definition; p. 2, equations (2)–(3): minimum power and averaging time
A signal-to-noise ratio of 10 requires W, and thereforeAn ideal rectangular average of a one-sided white noise spectral density has , giving cm instead. A circular field with diameter changes the diameter by another order-unity factor. These convention choices all require an aperture substantially larger than the mm diffraction estimate, so signal collection is the stronger constraint. The estimate treats the quoted NEP as applicable to the reconstructed channel; a detailed Fourier transform spectroscopy design would also specify scan weighting, background and how interferogram noise propagates into that channel. Raman spectroscopy 2026-10-18
Raman spectroscopy measures shifted scattering of light to infer internal energy spacings and the molecular response that makes them visible. In a modern illustrative arrangement, narrowband laser illumination replaces the historical arc, an optical filter rejects the strong excitation line, and a spectrograph resolves the weak shifted spectral lines. The illumination, rejection and spectral dispersion are separate jobs. Increasing rejection can conceal small Raman shifts close to the excitation line.
A proposed measurement should record the excitation wavelength, a dark signal, a blank container and the liquid, then compare calibrated line positions and integrated signals under the same collection conditions. Measure optical filter transmission and detector response before using the Thermal Raman line ratio for temperature. Repeat at lower incident power to look for heating or altered sample response. These are suggested checks, not an assertion that the 1928 apparatus implemented modern calibration procedures.
Its appeal is the conversion of internal molecular energy differences into visible spectral lines: changing the excitation can move the whole pattern while preserving characteristic Raman shifts. Combined with vibrational infrared activity, Raman vibrational activity supplies complementary information about molecular vibration. A line pattern can constrain a material's identity or environment, but overlapping bands, fluorescence backgrounds and the finite spectral resolution element prevent an unqualified identification from one peak alone.
Spectral resolution element Created 2026-10-06 Updated 2026-10-14
A spectral resolution element is a spectral interval at the adopted instrumental resolution. At spectral resolving power , its width is . The number of photodetector detector pixels sampling it is distinct from .