
The stored energy is , and the load draws . HenceThis is an ideal energy-budget estimate using 365.25 days per year. It assumes the stated energy is usable at this load, constant current and voltage, and negligible self-discharge, ageing and reserve capacity. No biological operating model is required.
The discharge reaction is . It transfers two electrons and has per reaction as written. The reversible open-circuit voltage isThe supplied free energy is already at approximately the requested temperature, so an additional temperature factor is unnecessary. Actual activities or discharge polarization could alter the terminal voltage.
Adsorbed or grafted polymers stabilize a colloid through steric stabilization when coverage is high and the solvent keeps the chains extended. Charged chains can add electrostatic repulsion, giving electrosteric stabilization.
They can destabilize it through polymer bridging flocculation when a chain adsorbs onto two particles, especially at incomplete coverage; through depletion force when nonadsorbing polymer is excluded from the gap and the surrounding solution's osmotic pressure pushes particles together; or through collapse of an adsorbed layer in a poor solvent. Polymer identity, molecular size, solvent quality, adsorption and concentration determine which mechanism dominates.
Use steric stabilization: attach or strongly adsorb a dense layer of polymer chains or compatible ligands, with tails well solvated by the nonpolar liquid. Overlap of these layers costs osmotic and conformational free energy and prevents particle cores reaching the strongly attractive contact region. The anchoring groups must bind the particle while the exposed chains prefer the solvent; sufficient coverage and a good solvent are essential. Nonpolar media do not make charging impossible, but electrostatic stabilization there requires an appropriate ion-generation and charge-stabilization mechanism, rather than assuming aqueous dissociation behaviour.
In the usual high-surface-potential Schulze-Hardy rule approximation, , where is the magnitude of the counterion valence. Consequently,Multivalent counterions screen surface charge much more effectively and strongly lower the electrostatic barrier. The sixth-power estimate includes the way the critical ionic strength and screening condition change with valence; merely scaling the ordinary Debye length at fixed salt concentration would not derive it. Specific adsorption, charge regulation or ion correlations can produce substantial deviations.[ref]
Schulze-Hardy rule in the IUPAC Gold Book. Counterion-valence sensitivity of the critical coagulation concentration
The critical coagulation concentration is the electrolyte concentration at which rapid, approximately diffusion-limited colloidal coagulation begins: the electrostatic barrier has become ineffective and nearly every sufficiently close encounter sticks. It is an operational threshold for the specified colloid and electrolyte, not a universal concentration or a guarantee of a mathematically exact zero barrier in every system.
DLVO theory adds short-range attractive Van der Waals forces to repulsive overlap of the electric double layer. Increasing salt concentration raises the ionic strength and shortens the Debye length, screening the repulsion. The repulsive barrier falls, so thermal collisions can carry particles into the primary attractive minimum and cause colloidal coagulation. An intermediate shallow secondary minimum can instead produce weak, potentially reversible association.
The figure's assignments are a: low salt; b: intermediate salt; c: high salt. Curve a has the largest protective barrier, b a lower barrier and secondary minimum, and c no effective repulsive barrier. This explanation assumes the surface charging chemistry does not independently reverse or radically change the surface potential.
The arrangement is diode sputter deposition: the Au target, a, is attached to the upper cathode assembly c; positive Ar ions bombard it and sputter Au onto the wafer. The lower wafer-holder electrode b is the anode in the simple two-electrode arrangement shown.
Unlike evaporation, sputtering needs enough inert gas to sustain a discharge. Over a low-pressure operating interval, raising Ar pressure can increase ionization and ion current and hence the sputtering rate at comparable applied voltage. This is not a universal monotonic law: at higher pressure, scattering and thermalization of sputtered Au reduce the fraction reaching the wafer; at fixed regulated power, target voltage and current also adjust. A pressure increase can initially increase the rate, but excessive pressure lowers transport efficiency.
Use thermal evaporation or electron-beam evaporation: evaporated Au travels approximately ballistically to the Si wafer. For line-of-sight deposition, the gas mean free pathshould greatly exceed the source-wafer distance . Increasing the chamber's useful transport length therefore requires a proportionately lower pressure to retain the same , for fixed gas and temperature. There is no universal pressure requirement determined by chamber volume alone.
A distant compact source gives a more uniform angular flux across the wafer, but the deposition rate falls roughly as . For an ideal cosine-emitting point source and a parallel wafer, the relative thickness at lateral radius is approximately . Mitigate the trade-off with wafer rotation and planetary motion, multiple or extended sources, shaped masks and suitable source/wafer geometry. Rotation averages azimuthal variation; ordinary rotation alone does not remove a purely radial thickness gradient. A thin Ti or Cr adhesion layer may be needed for robust Au adhesion to oxidized Si.
Projection lithography images a mask through reduction optics; its resolution scales approximately as . It offers parallel exposure, high throughput and accurate repeat patterning, but small features demand short wavelengths, large numerical aperture, costly optics and high-quality masks, with a shrinking depth of focus.
Electron beam lithography directly writes a programmable pattern using a focused electron beam. Its much shorter wavelength and small probe permit nanometre-scale features without an optical mask, making it attractive for research prototypes, low-volume devices and mask fabrication. Its limitations are serial writing time, charging of insulating substrates, beam drift, field stitching and forward/backscattering proximity effects in electron-beam lithography. Electron wavelength alone does not set the resist resolution. E-beam is often preferable for a few very small custom structures; projection remains preferable for high-volume repeated manufacture.
With the proximity-resolution convention , the maximum mask-wafer gap isFor and , at . If the g-line is used instead, at . The wavelength must be specified; the question's preceding choice of two lamp lines does not select a unique number. This estimate neglects extra loss of resolution from finite resist thickness, mask imperfections and angular illumination spread.
A high-pressure Mercury arc lamp is a conventional source for proximity photolithography. An electric discharge excites Mercury vapour; radiative transitions produce strong spectral lines, selected by filters and delivered through collimating optics. Common lines are (i-line) and (g-line). The finite mask-wafer gap gives near-field Fresnel diffraction, rather than the far-field approximation. Diffracted light spreads into nominally dark regions, limiting the minimum printable feature.
The resolved graphitic fringes indicate high-resolution phase contrast in a multi-walled carbon nanotube. Interference of transmitted and diffracted electron waves produces lattice fringes; their darkness is controlled by defocus, thickness and the contrast transfer function, so a dark fringe is not an unqualified map of individual carbon atoms. The weakly scattering central channel is lighter than the multilayer walls. Curved, roughly parallel fringes at its sides identify concentric graphitic shells; the dense fringes at the lower edge arise from overlapping graphitic material or another tube, not necessarily the wall count of the central tube.
Using the printed scale bar, the central tube has an outer diameter of roughly – and an inner channel of roughly –, depending on the cross-section selected away from the overlap. Several wall fringes are resolved on each side, with separations of order , consistent with graphitic interlayer spacing. These are approximate image measurements, not a determination of chirality, chemical purity or an exact shell count. The image alone cannot establish those quantities.
For bright-field transmission electron microscopy, place the objective aperture in the back focal plane around the transmitted beam, excluding most diffracted beams. Adjust the intermediate lens to image the objective's real-space image plane; projector lenses enlarge that image onto the screen or camera. Regions removing electrons from the admitted beam tend to be darker, although phase contrast can also contribute.
For selected-area electron diffraction, put the selected-area aperture in the objective image plane to choose a specimen region. Remove or open the objective aperture and change the intermediate-lens excitation to image the objective's back focal plane onto the camera. The projector then magnifies the diffraction pattern, rather than the specimen image. Thus the two apertures act in different conjugate planes.
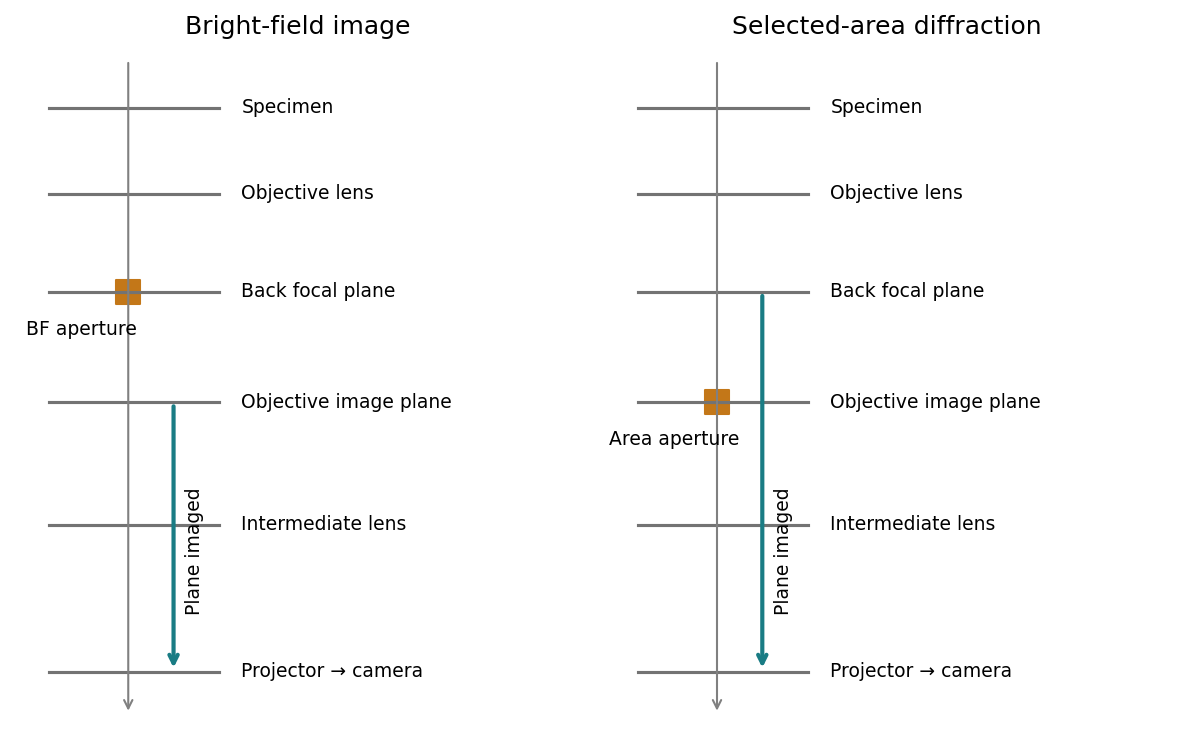
[ref]
Selected-area diffraction by JEOL. Area-selection aperture in the objective image plane and conjugate diffraction-plane imaging
Treat the magnetic electron lens as a paraxial thin lens. A point in the specimen sends rays through different lens positions; the lens brings these to a conjugate point in the image plane, with and transverse magnification . Conversely, waves leaving different specimen points at the same angle are focused to the same point in the back focal plane. This plane therefore contains the electron diffraction pattern, with radius for small scattering angle . The specimen is just beyond the front focal plane, giving a magnified real image farther downstream.
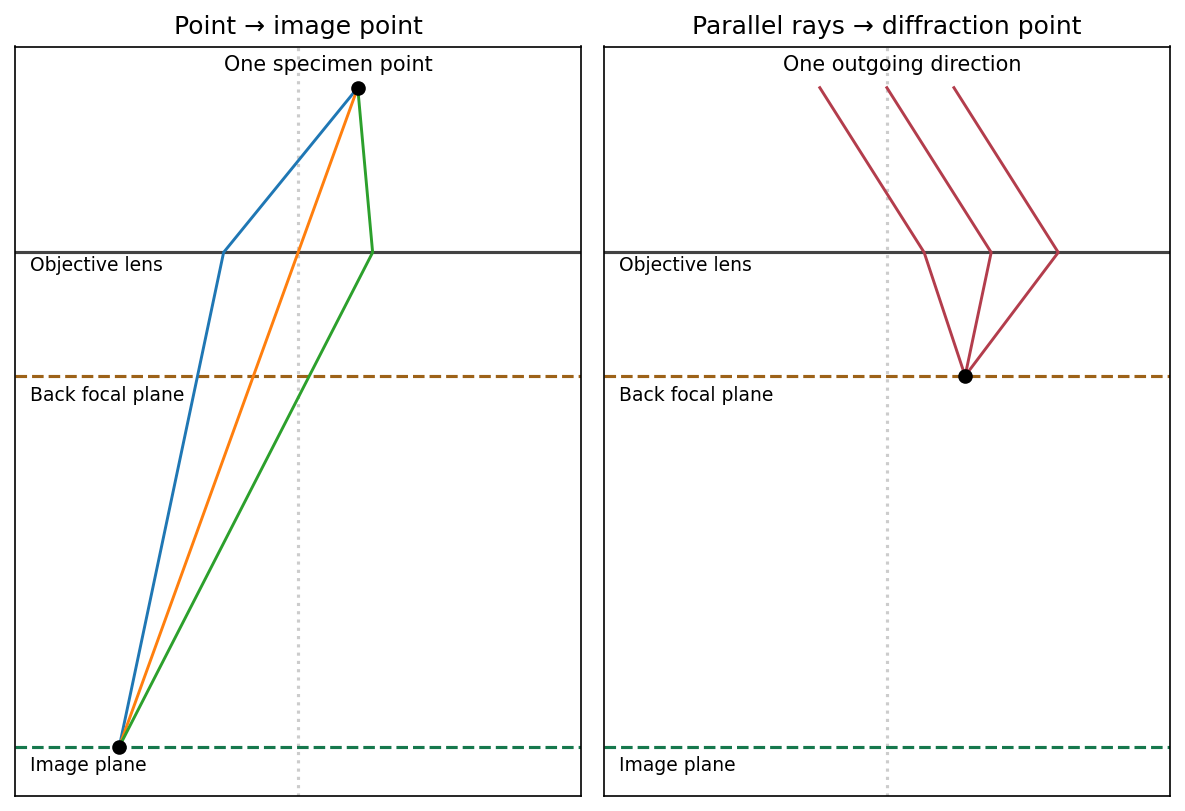
The sketch assumes a thin specimen, coherent approximately parallel illumination, small angles and an ideal lens without aberrations. Quantitative diffraction intensities may require dynamical scattering; the ray sketch only establishes the plane conjugacies.[ref]
Objective lens by JEOL. Objective image formation
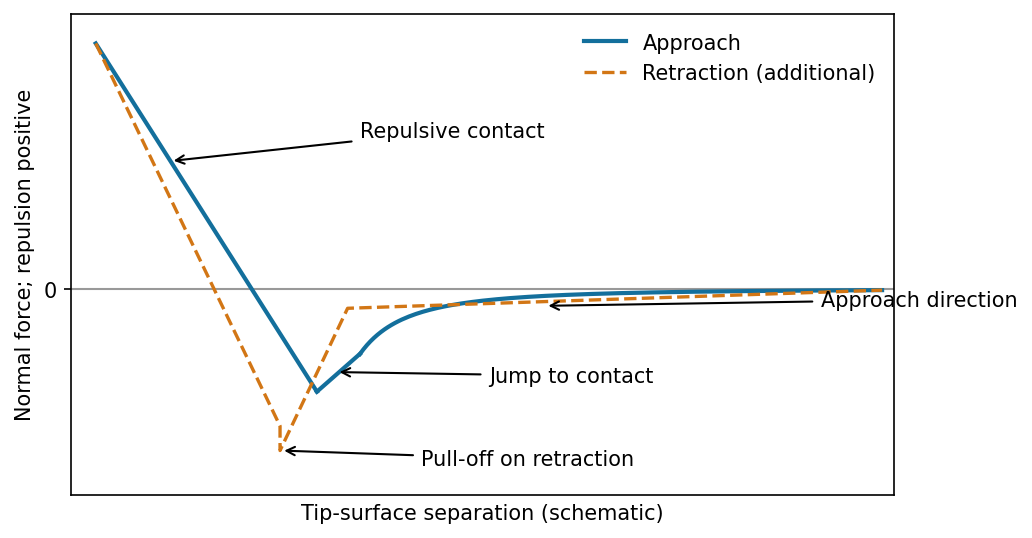
The atomic force microscope measures the cantilever deflection , converted to normal force by after calibration. On approach, the force is initially almost zero, then attractive; a sufficiently steep attractive force gradient causes jump-to-contact. After contact, further approach bends the cantilever and indents the sample, giving a rising repulsive branch. With tip-surface separation increasing to the right, approach proceeds from right to left. The instability occurs when the magnitude of the attractive force gradient exceeds the cantilever stiffness. The contact-branch slope depends on both cantilever and sample compliance.


There are unlisted articles, also show them or only show them.