
Both starting arrangements converge toward the same chemically ordered alloy, exhibiting chemical ordering in alloys. This supports a lower free energy for the ordered unlike-metal neighbour pattern than for the segregated core-shell or disordered precursor at the final temperature. In a simple nearest-neighbour model, ordering is favoured whenwith consistent bond-energy conventions. Bulk mixing and ordering then compensate the loss of configurational entropy on cooling. Annealing alone does not supply numerical bond or surface energies, and elastic mismatch or adsorbed ligands can also matter.
The final morphology does not show a thick single-metal skin: the surface-energy difference is not large enough to overwhelm the bulk preference for ordering throughout the particle. Some atomic-scale surface enrichment is compatible with the drawing, so exact equality of the two surface free energies is not established.
If B has a much lower surface free energy, Surface segregation of B and an A-rich interior become favourable. A nearly continuous B shell is likely if enough B is present and the surface-energy gain exceeds the cost of disrupting favourable A-B bonds; otherwise only partial enrichment occurs.
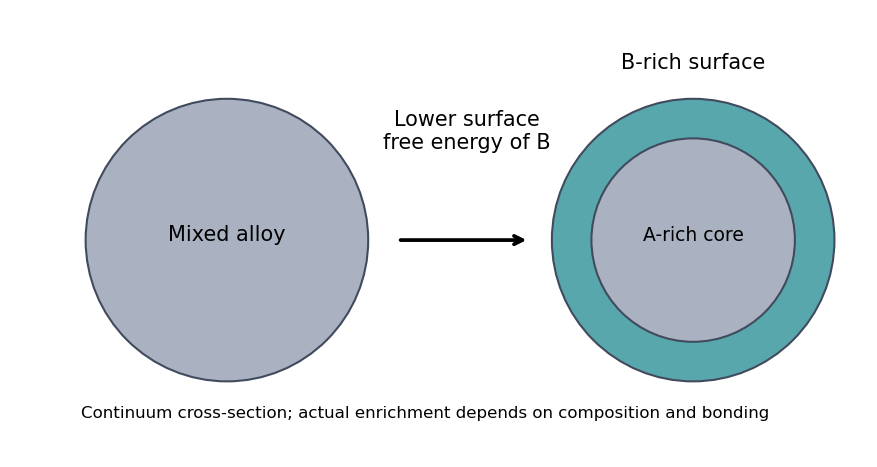
An illustrative surface-energy preference enriches the outermost layers without fixing a universal shell thickness
. Source. Details. 
For the upper core-shell precursor, first reduce a precursor of metal A to make seeds; then introduce and reduce a precursor of B under conditions favouring heterogeneous deposition on those seeds rather than independent nucleation. Control added quantity, reduction rate and surface ligands to build a shell.
For the lower disordered-alloy precursor, reduce both metal precursors together so both metals enter the growing particles. Match their effective reduction rates by precursor chemistry, temperature, complexation or controlled feeding; otherwise sequential reduction can produce segregation instead of co-incorporation. Quenching or sufficiently mild growth can retain a disordered alloy before the later anneal. These routes need not initially produce equilibrium atomic arrangements.[ref]
Bimetallic Nanocrystals by Kyle D. Gilroy and others. Liquid-phase synthesis of core-shell and alloy architectures
A faceted, approximately equiaxed crystal is indicated. A truncated octahedron bounded by low-energy and facets is a plausible three-dimensional shape for an fcc metal particle; the hexagonal section alone does not uniquely distinguish it from other faceted polyhedra.
The Wulff construction minimizes at fixed particle volume. Place a plane with normal a distance from a common centre and take the inner envelope. Low-surface-energy orientations survive as large facets. Annealing permits diffusion toward this equilibrium morphology, provided the time is sufficient. For a supported or strained alloy, substrate adhesion and elastic energy modify this simple free-particle construction.
From the illuminated side downward, the p-type gallium arsenide cap provides a low-resistance route to the front metal contact. It should remain beneath the contact grid but be removed from the optical aperture to reduce parasitic absorption. The wider-band gap p-type aluminium gallium arsenide window transmits much of the useful light and reduces front-surface recombination of carriers in the adjacent absorber. The optical-window and reduced-recombination rationale has a primary experimental basis in early heteroface devices.[ref]
High-efficiency Ga1-xAlxAs-GaAs solar cells by Jerry M. Woodall and H. J. Hovel. Applied Physics Letters 21 (1972), p. 379, transparency and surface-recombination rationale; p. 380, contacts and antireflection coating
The p-type gallium arsenide emitter and n-type gallium arsenide base form the p-n junction. Absorbed photons generate electrons and electron holes; diffusion and the junction's electric field direct them toward the appropriate contacts. The n-type aluminium gallium arsenide back-surface-field layer provides a barrier to minority holes moving toward the substrate and reduces rear recombination. The n-type gallium arsenide substrate supports the epitaxial layers and conducts majority carriers to the rear contact.
The front metal must collect current with limited shading and the back metal provides the return contact. Interpreting the patterned hatched region as the optical antireflection coating, it reduces reflected light over the exposed window. Carrier selectivity, low recombination, low series resistance and low shading must work together; the equilibrium junction field alone is not a source of electrical energy.
There is a verified inconsistency in the printed data: the original PDF says , whereas the relativistic de Broglie wavelength at is approximately :Use consistent length units, , and distinguish literal arithmetic from a physically consistent estimate. The familiar approximate Scherzer defocus is , or about with . Slightly different optimum-phase conventions use in place of , giving about ; both are underfocus by a few tens of nanometres. The manufacturer's tabulated values confirm that scale.[ref]
Scherzer focus by JEOL. glossary, underfocus convention and accelerating-voltage/spherical-aberration table
Using the question's additional numerical relation exactly as supplied, with , givesFor the physically appropriate rounded wavelength this is . The CTF itself gives an independent check: its first nonzero zero satisfies , so implies . The plotted condition is therefore a little less underfocused than the usual Scherzer setting and has a first-zero spacing near . The nominal and approximate optimization formula should not be treated as exactly reproducing every plotted parameter.
If the printed is retained literally, the approximate Scherzer formula instead gives , the supplied relation gives , and the plotted first zero requires . These do not describe a consistent microscope. The physically consistent comparison is approximately to optimum underfocus versus from the plot; the wavelength correction is explicit.
For a weak phase object, the contrast transfer function gives the signed transfer of an object's spatial Fourier components into intensity contrast. In a common convention,where is a cyclic spatial frequency, the defocus, the spherical aberration coefficient, and a coherence envelope. A zero suppresses that frequency; crossing a zero reverses contrast. The overall sign depends on the image convention, but the zeros do not. Single-image division by cannot recover information exactly at its zeros. The microscope manufacturer's discussion explicitly connects the first zero with interpretable resolution and the higher-frequency sign changes.[ref]
Phase-contrast transfer function, PCTF by JEOL. glossary, first-zero and envelope-function discussion
The plotted first nontrivial zero is at approximately . Hence the smallest spacing in the first uninterrupted contrast band is about . This axis is cycles per length, not an angular wave number requiring a factor of . Smaller spacings can contribute in later bands, but their contrast has reversed and requires appropriate interpretation or multiple-defocus reconstruction.
This is a conventional transmitted-beam bright-field transmission electron microscopy image containing high-resolution electron phase contrast and visible lattice fringes, rather than an element-specific chemical map. Relative to the scale bar, the smaller particle has an outer projected diameter of roughly . It is approximately rounded and contains a denser outer rim with several lighter internal regions separated by material. A porous or internally hollow particle is a plausible morphological interpretation; the image is not a simple featureless solid sphere.
Greater projected thickness generally removes more intensity from the transmitted beam, producing darker mass–thickness contrast. Different crystallite orientations also scatter intensity differently and give diffraction contrast. Local lattice fringes reveal crystalline material and changes of fringe orientation indicate more than one coherent domain. Bright/dark edge fringes also contain defocus-dependent Fresnel contrast; their width is not a direct shell-thickness measurement. Neither an exact alumina polymorph nor three-dimensional closed porosity can be uniquely established from this projection alone. Use calibrated fringe spacings and electron diffraction for phase identification, tilt-series imaging for void geometry, and a through-focus or dose series to test contrast artefacts.
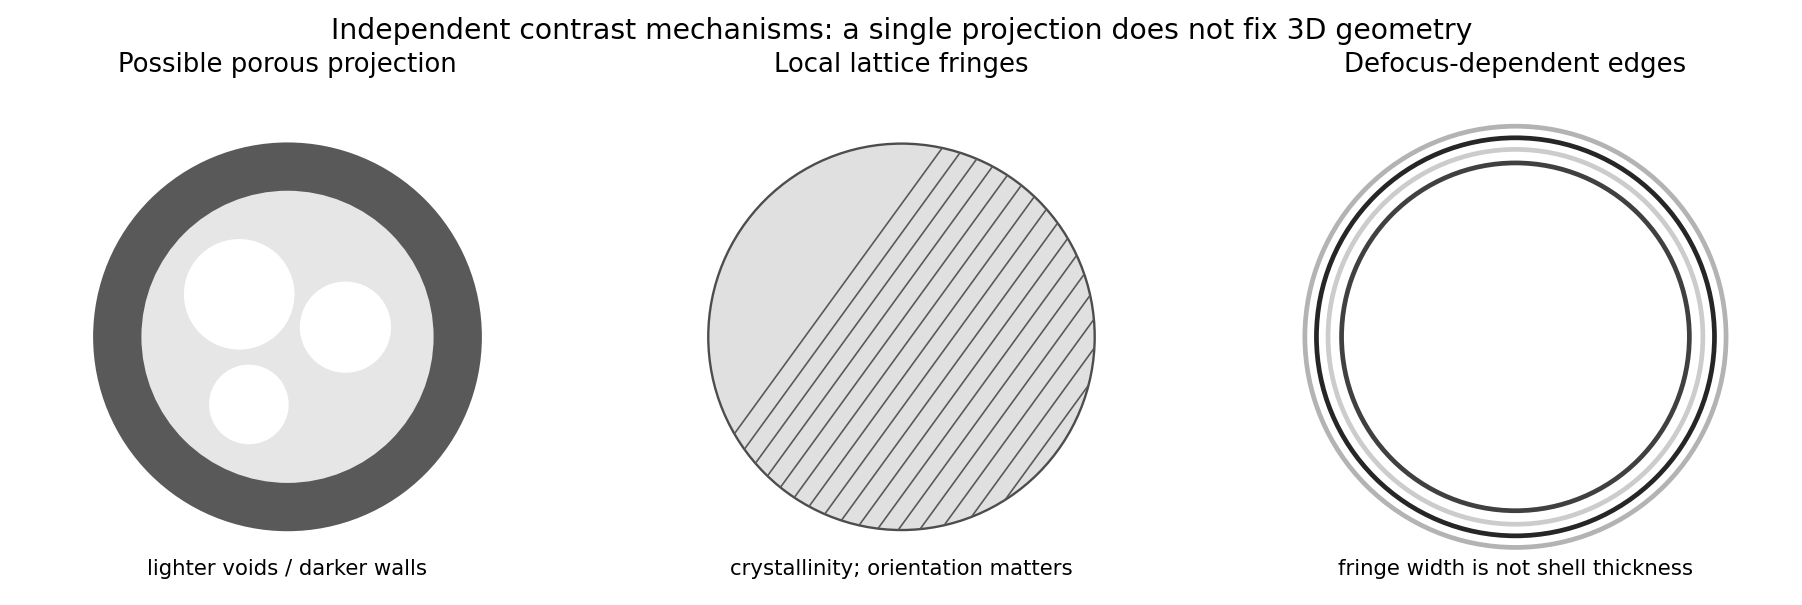
Original generic schematic separating projected porosity, crystallite orientation and edge-contrast interpretations
. Details. 
Disperse a very small amount of the dry powder in a clean volatile solvent compatible with aluminium oxide, use brief gentle sonication to separate loose agglomerates, and place a dilute drop on a holey carbon-coated transmission electron microscopy grid. Wick away excess liquid and dry thoroughly. Look first at low magnification and select isolated particles or thin edges over holes, rather than an electron-opaque pile. Record a solvent-only grid to identify contamination and compare several independently prepared areas.
This is quick and preserves individual particles without mechanical thinning. However, spray pyrolysis can make hollow or porous particles that may fracture during sonication; sedimentation and drying can select sizes and aggregate particles. aluminium oxide is insulating, so charging or beam-induced changes can complicate images, and the carbon support can overlap weak contrast. Vary dose and dwell time to test stability. A projected image of one selected thin particle is not an unbiased three-dimensional size or porosity distribution of the whole powder.
A wireless sensor node combines a sensor, signal conditioning and conversion, a processor, a radio and a power subsystem. It can use a battery, a wired supply where practical, or local harvesting such as light, vibration or a thermal gradient, usually with a storage capacitor, supercapacitor or rechargeable battery to bridge interruptions. Harvested power must meet the time-averaged demand and storage must supply peak radio current.
Reduce power by duty cycling the sensor, processor and radio; use a low-leakage sleep mode and switch off unused peripherals. Buffer and batch data, transmit fewer unnecessary bits, use event-triggered acquisition when it meets the application, and reduce retries with a reliable link and an appropriate transmit-power level. Include wake-up, sensing, processing and communication energy in the budget: reducing payload alone may not reduce a radio dominated by startup overhead.
The secondary pyroelectric effect is the change of polarization density produced when thermal strain acts through piezoelectricity. It is additional to the primary change at fixed strain. A linear constitutive description along the polar axis iswhere are piezoelectric stress coefficients and the freely developing thermal strains per kelvin. Thermal-expansion mismatch with a support or a deliberately chosen compliant structure can change the secondary contribution. It enhances the total response only if its sign reinforces the primary response; mechanical boundary conditions and thermal cycling must be characterized rather than assuming every restraint is beneficial.
Preventing axial expansion removes the free axial-strain contribution, but does not automatically eliminate every secondary contribution. In a one-dimensional idealization with only coupling and perfect axial clamping, that strain-mediated term vanishes. A real rod may still expand transversely, and nonzero or can change through those strains. In a stress-based constitutive equation, the same restraint appears as thermal stress and a piezoelectric term; do not add it a second time to a coefficient already specified for the constrained condition. Full suppression of all relevant thermal strains leaves the primary coefficient at fixed strain. The answer therefore depends on which degrees of freedom are constrained, not simply on the word “nanorod”.
For electrode area , the change in spontaneous polarization density supplies a charge scale , while the film's capacitance is . The voltage magnitude is therefore . More explicitly, for an initially compensated film with no change in free electrode charge, . Taking from the lower electrode to the upper one gives .The measurable magnitude is , with polarity reversed by reversing the poling direction or the temperature change. This is an ideal open-circuit estimate: leakage, the measuring instrument's input capacitance and finite charge-relaxation time can reduce or reshape the observed voltage.
A thermoelectric generator uses the Seebeck effect and needs a spatial temperature gradient: a couple develops between hot and cold junctions. It can deliver continuous power under a steady thermal gradient and has no moving parts, but requires sustained heat flow and adequate hot- and cold-side thermal contacts. Thermal conduction, internal electrical resistance and the material's thermoelectric figure of merit limit conversion.
A pyroelectric generator responds to a time-dependent spontaneous electric polarization. Under approximately uniform heating or cooling, when the electrical boundary condition allows charge flow. It can harvest temporal thermal fluctuations without a persistent spatial gradient. However, at a constant uniform temperature its ordinary pyroelectric current stops; practical extraction needs cycling, low-leakage electronics and a suitable load. A large open-circuit voltage is not evidence of a large available average power. Temperature-driven nanowire measurements provide a primary experimental example of this distinction.[ref]
At unchanged intrinsic catalyst kinetics, increasing the electrochemically accessible true area by multiplies exchange current per geometric area by . Equivalently, the local current density at a fixed total geometric current falls by . Each Tafel equation activation loss decreases by :Thus and , an increase of , or about . Power does not increase a hundredfold, because the voltage improvement is logarithmic and the specified geometric current is unchanged. This assumes both electrodes gain accessible active area, the original exchange currents use the original area basis, and the porous structure does not introduce additional transport or Ohmic losses.
The reversible voltage follows from the two-electron hydrogen reaction:At the specified geometric current density, the magnitude of each activation loss follows its Tafel equation, :Both losses reduce the delivered fuel cell voltage. Therefore and . The very small oxygen exchange current is responsible for most of the activation loss. The calculation uses current densities on a common area basis, unit water activity and the stated gas conditions, and neglects the losses the problem excludes.
In a galvanic cell, a spontaneous oxidation-reduction reaction supplies electrical work: for discharge, the anode is negative, and the cathode positive. A discharging electric battery and a hydrogen–oxygen fuel cell are two practical examples. The first stores its reactants internally; the second is supplied continuously with fuel and oxidant.
An electrolytic cell consumes externally supplied electrical work to drive electrode reactions or material transfer under an applied potential. Its anode is positive and cathode negative. water electrolysis for hydrogen production and metal electroplating are two practical examples. oxidation always occurs at the anode and reduction at the cathode in both cell types; the electrode signs change. The electrolyte conducts ions, while electrons flow through the external circuit. A rechargeable battery can operate in either regime depending on whether it is discharging or being charged.
There are unlisted articles, also show them or only show them.