Topics (203k) Articles (205k) Users (302) Discussions (237) Comments (383) Files (715) New article

The term "North American earthquake stubs" doesn't refer to a widely recognized concept or specific terminology in geology or seismology. However, it may relate to a few different contexts: 1. **Seismology and Geological Studies**: In the study of earthquakes, a "stub" might refer to initial data or research that is not fully developed or published. It could pertain to preliminary reports or summaries of seismic activity in North America that need further elaboration.
"European earthquake stubs" likely refers to short or incomplete entries related to earthquakes in Europe on platforms like Wikipedia, where stubs are articles or entries that are too short to provide comprehensive coverage of a topic. These stubs may need additional information, details, references, and citations to expand them into full articles.
"Asian earthquake stubs" typically refers to short articles or entries related to earthquakes in Asia on platforms like Wikipedia. Stubs are incomplete articles that require expansion, additional information, or citations. They serve as a starting point for further development and improvement by contributors or editors.
Origin is a data analysis and graphing software primarily used in scientific and engineering fields. Developed by OriginLab Corporation, it provides a powerful environment for data exploration, analysis, and visualization. Here are some key features and aspects of Origin: 1. **Data Analysis**: Origin offers a wide range of analytical tools, including basic statistical functions, curve fitting, peak analysis, and more advanced modeling capabilities. Users can analyze data sets, apply various statistical methods, and perform complex computations.
Ocean Data View (ODV) is a software tool designed for the analysis and visualization of oceanographic data. It provides researchers and scientists with the capability to manage, explore, and interpret large datasets related to the ocean environment, such as temperature, salinity, nutrient levels, and other physical and chemical properties.
NetCDF, which stands for Network Common Data Form, is a set of software libraries and data formats used for array-oriented scientific data. It is widely utilized in the geosciences, climatology, meteorology, oceanography, and other fields where large datasets are common. The primary characteristics of NetCDF include: 1. **Self-describing Format**: NetCDF files contain metadata that describes the data they hold, making it easier for users to understand the contents and structure.
NASA WorldWind is an open-source virtual globe technology developed by NASA. It allows users to interactively explore and visualize geographical information in a three-dimensional environment. WorldWind provides a framework for developers to create their own applications that leverage the vast array of geospatial data available on Earth. Key features of NASA WorldWind include: 1. **3D Visualization**: Users can view the Earth and its terrain in three dimensions, allowing for a more realistic representation of geographic features.
Marble is a virtual globe and world atlas software that allows users to explore and navigate geographical information and features. It functions as an open-source project and is part of the KDE project, which is a community that develops free and open-source software. Key features of Marble include: 1. **360-degree Globe View**: Users can view the Earth as a three-dimensional globe, allowing them to rotate, zoom, and explore different regions.
A Local Data Manager typically refers to a system or application that handles the storage, organization, and management of data within a localized environment, such as on a single device or within a specific location (like a local network). The term can apply to various contexts, including software development, database management, and data analytics.
The Integrated Data Viewer (IDV) is a software tool developed by the Unidata Program Center, typically used in the realm of atmospheric science and meteorology. It is designed to visualize and explore geospatial data, particularly datasets related to weather and climate. Key features of the Integrated Data Viewer include: 1. **Data Visualization**: IDV can display a wide variety of geospatial data formats, allowing users to visualize data on maps or in three-dimensional space.
IDL, or Interactive Data Language, is a programming language primarily used for data analysis, visualization, and visualization of scientific data. Developed in the 1970s by David Stern at the Army Research Laboratory, IDL has been widely used in various fields, especially in astronomy, medical imaging, and remote sensing.
HDF Explorer is a software tool designed for viewing and manipulating HDF (Hierarchical Data Format) files, particularly HDF4 and HDF5 formats. It provides a graphical user interface (GUI) that allows users to explore the structure of HDF files, view datasets, attributes, and metadata, and manipulate data stored within these files.
Gri is a graphical language designed for creating high-quality scientific graphics, primarily used for plotting data in a visual manner. It provides a straightforward way to create a variety of plots, including line graphs, bar charts, histograms, and more, while allowing users to customize various aspects of their graphics, such as axes, labels, and legends. Gri typically operates in a command-line environment where users can specify the configuration of their plots through a series of commands.
GrADS, which stands for the Grid Analysis and Display System, is a software tool primarily used for the analysis and visualization of earth science data. Developed by the University of Chicago, it is widely utilized in fields like meteorology, climatology, oceanography, and atmospheric sciences. Key features of GrADS include: 1. **Data Analysis**: GrADS allows users to perform various statistical analyses and operations on multi-dimensional grid data, such as calculating averages, anomalies, trends, and more.
Generic Mapping Tools (GMT) is a collection of command-line tools designed for the manipulation and visualization of geographic and Cartesian data. It is widely used in fields such as geophysics, oceanography, and environmental science for tasks that involve plotting maps and creating visual representations of data sets. GMT is particularly popular for its ability to handle large data sets and produce high-quality graphics.
Ferret is a data visualization and analysis tool primarily used in the fields of oceanography and geophysical sciences. It is designed to handle large datasets, particularly those involving gridded data such as temperature, salinity, and other oceanographic parameters. Ferret provides a flexible and powerful platform for users to manipulate, analyze, and visualize their data effectively.
DIVA software can refer to various applications or systems depending on the context, but one of the most common uses of the term relates to DIVA (Digital Interactive Video Assessment) software, which is often used for educational purposes, especially in fields like performing arts and education. DIVA software enables users to create, manage, and evaluate video-based assessments, allowing educators and students to interactively engage with video content.
A climate change scenario is a systematic representation of potential future climate conditions based on various assumptions about social, economic, and environmental developments. These scenarios are used to project how climate variables, such as temperature, precipitation, and greenhouse gas (GHG) emissions, might change over time due to different influencing factors, including human activities and natural processes.
Bing Maps Platform is a set of mapping and location services provided by Microsoft that allows developers to integrate mapping, geolocation, and spatial functionalities into their applications. It offers a variety of APIs and tools that enable users to access detailed maps, geocoding, routing, traffic information, and more. Here are some key features of the Bing Maps Platform: 1. **Mapping Services**: Offers high-quality, interactive maps that can be embedded in web and mobile applications.
Pinned article: Introduction to the OurBigBook Project
Welcome to the OurBigBook Project! Our goal is to create the perfect publishing platform for STEM subjects, and get university-level students to write the best free STEM tutorials ever.
Everyone is welcome to create an account and play with the site: ourbigbook.com/go/register. We belive that students themselves can write amazing tutorials, but teachers are welcome too. You can write about anything you want, it doesn't have to be STEM or even educational. Silly test content is very welcome and you won't be penalized in any way. Just keep it legal!
Intro to OurBigBook
. Source. We have two killer features:
- topics: topics group articles by different users with the same title, e.g. here is the topic for the "Fundamental Theorem of Calculus" ourbigbook.com/go/topic/fundamental-theorem-of-calculusArticles of different users are sorted by upvote within each article page. This feature is a bit like:
- a Wikipedia where each user can have their own version of each article
- a Q&A website like Stack Overflow, where multiple people can give their views on a given topic, and the best ones are sorted by upvote. Except you don't need to wait for someone to ask first, and any topic goes, no matter how narrow or broad
This feature makes it possible for readers to find better explanations of any topic created by other writers. And it allows writers to create an explanation in a place that readers might actually find it.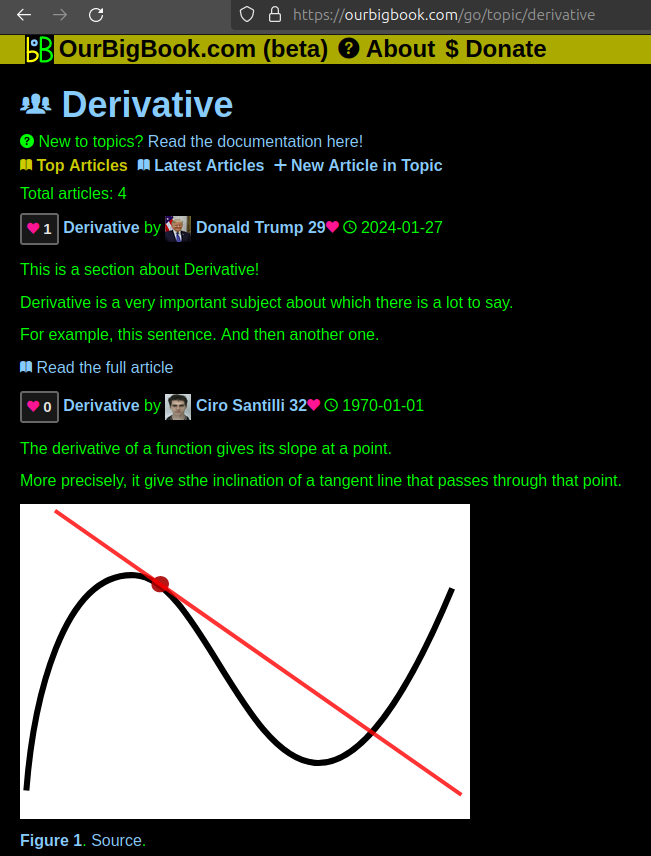
Figure 1. Screenshot of the "Derivative" topic page. View it live at: ourbigbook.com/go/topic/derivativeVideo 2. OurBigBook Web topics demo. Source. - local editing: you can store all your personal knowledge base content locally in a plaintext markup format that can be edited locally and published either:This way you can be sure that even if OurBigBook.com were to go down one day (which we have no plans to do as it is quite cheap to host!), your content will still be perfectly readable as a static site.
- to OurBigBook.com to get awesome multi-user features like topics and likes
- as HTML files to a static website, which you can host yourself for free on many external providers like GitHub Pages, and remain in full control
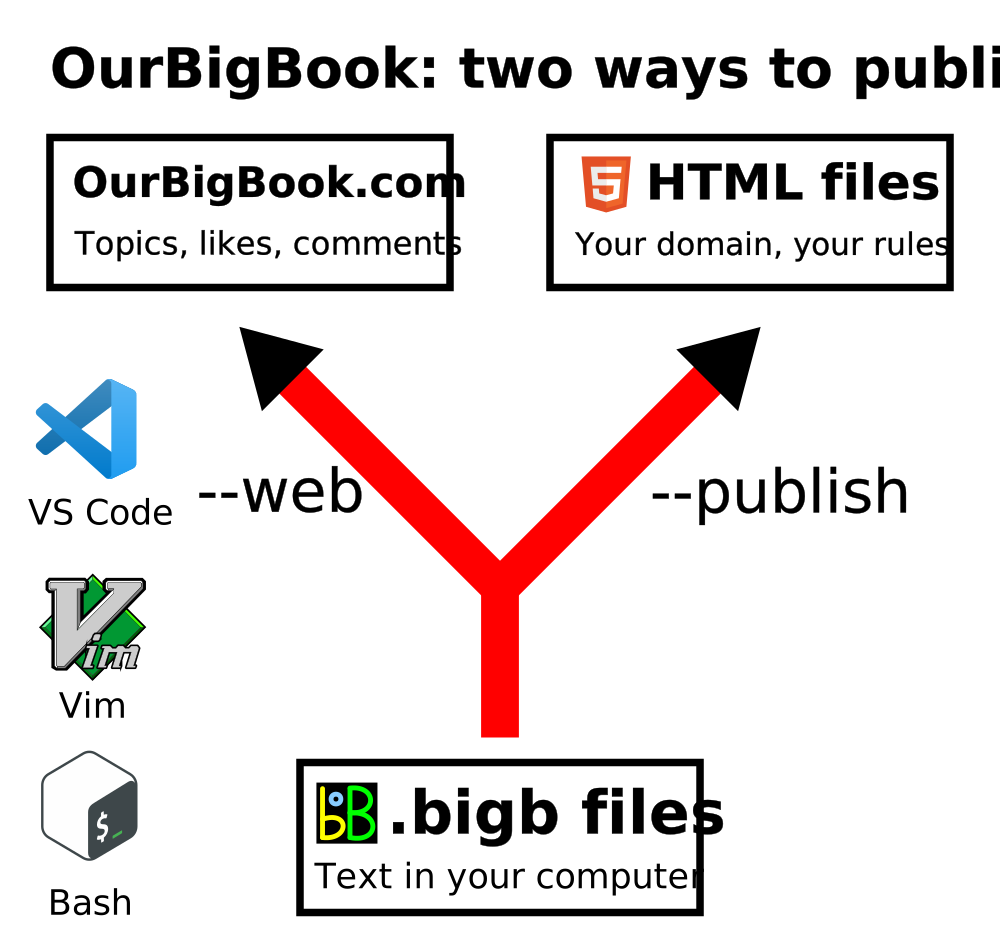
Figure 2. You can publish local OurBigBook lightweight markup files to either OurBigBook.com or as a static website.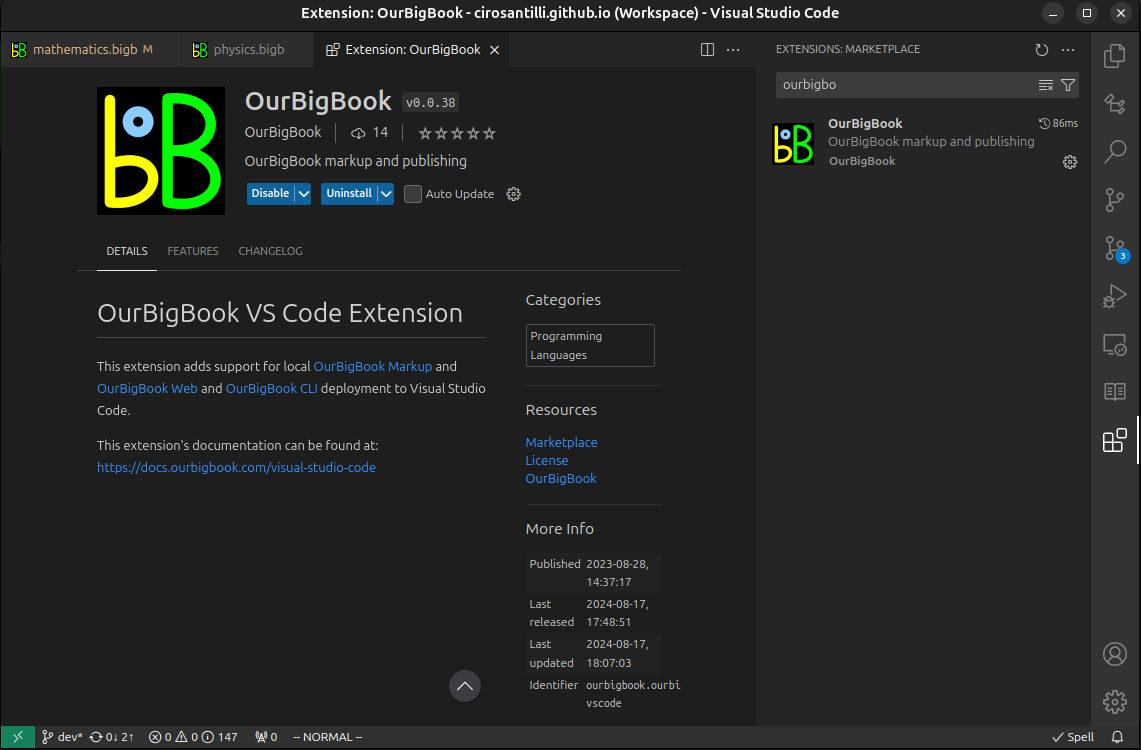
Figure 3. Visual Studio Code extension installation.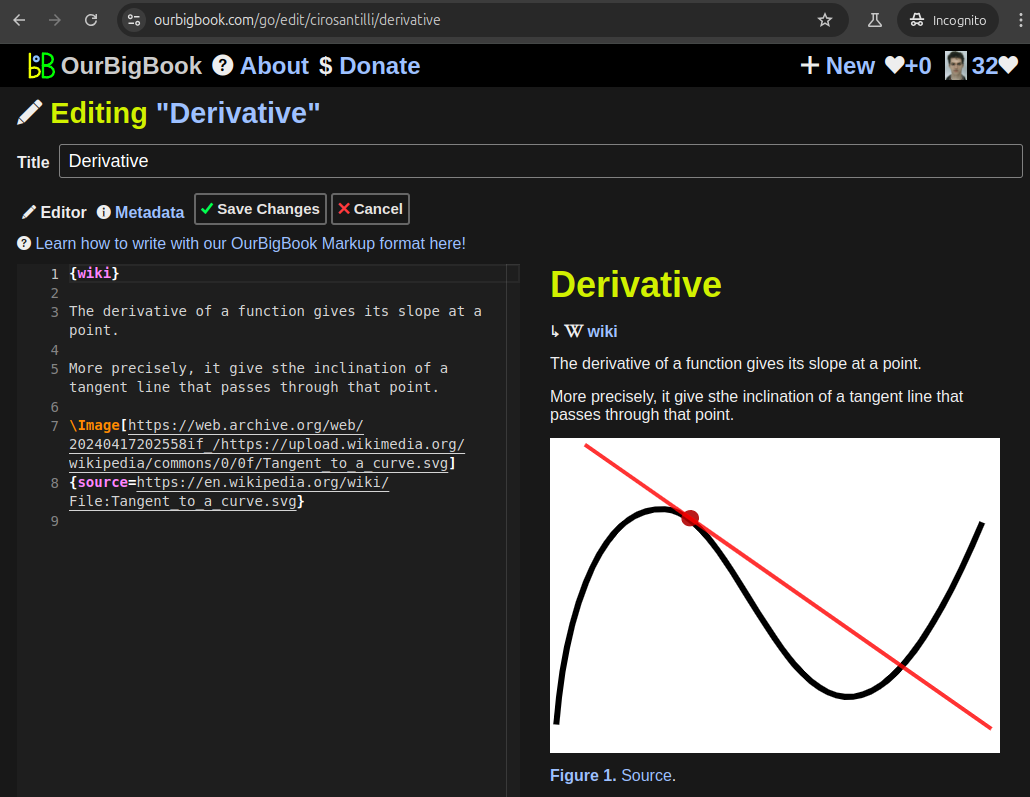
Figure 5. . You can also edit articles on the Web editor without installing anything locally. Video 3. Edit locally and publish demo. Source. This shows editing OurBigBook Markup and publishing it using the Visual Studio Code extension. 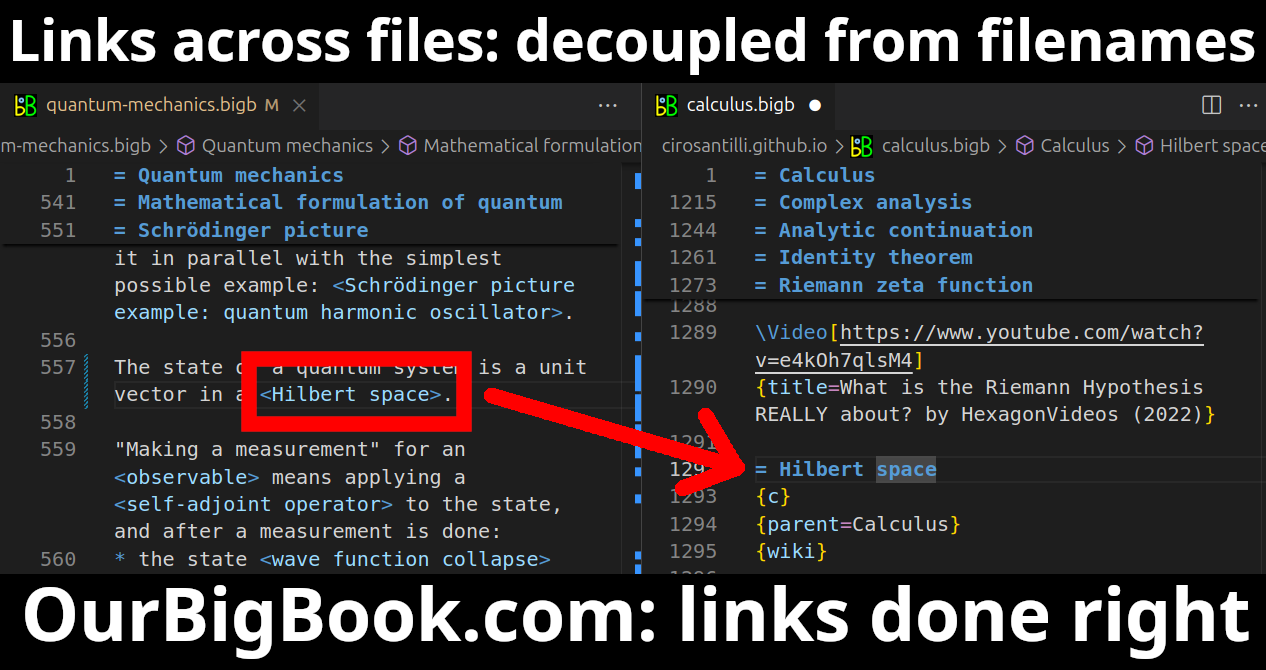
- Infinitely deep tables of contents:
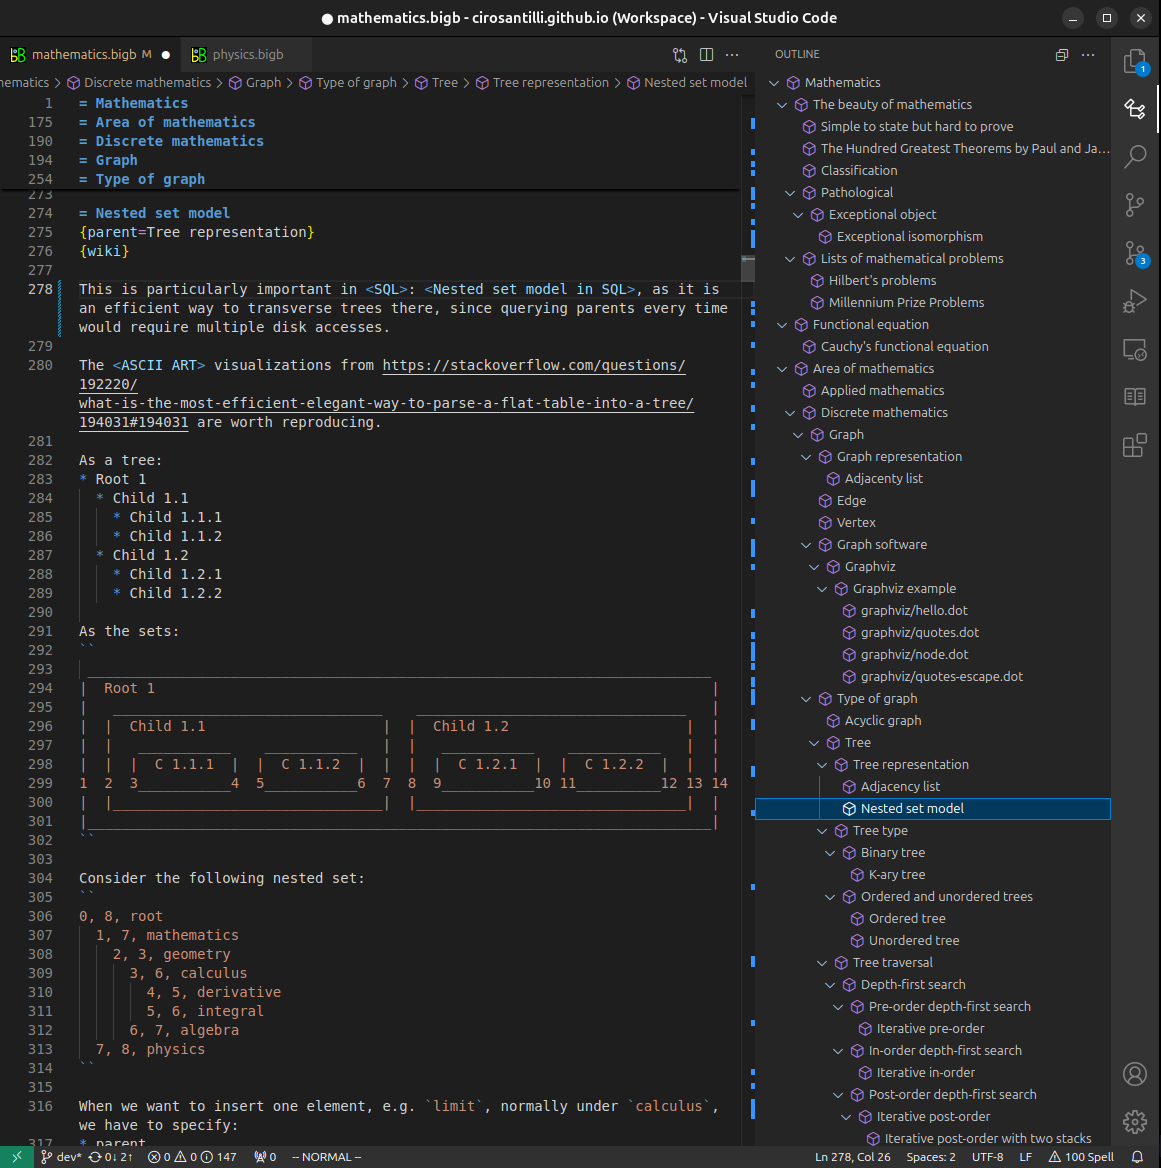
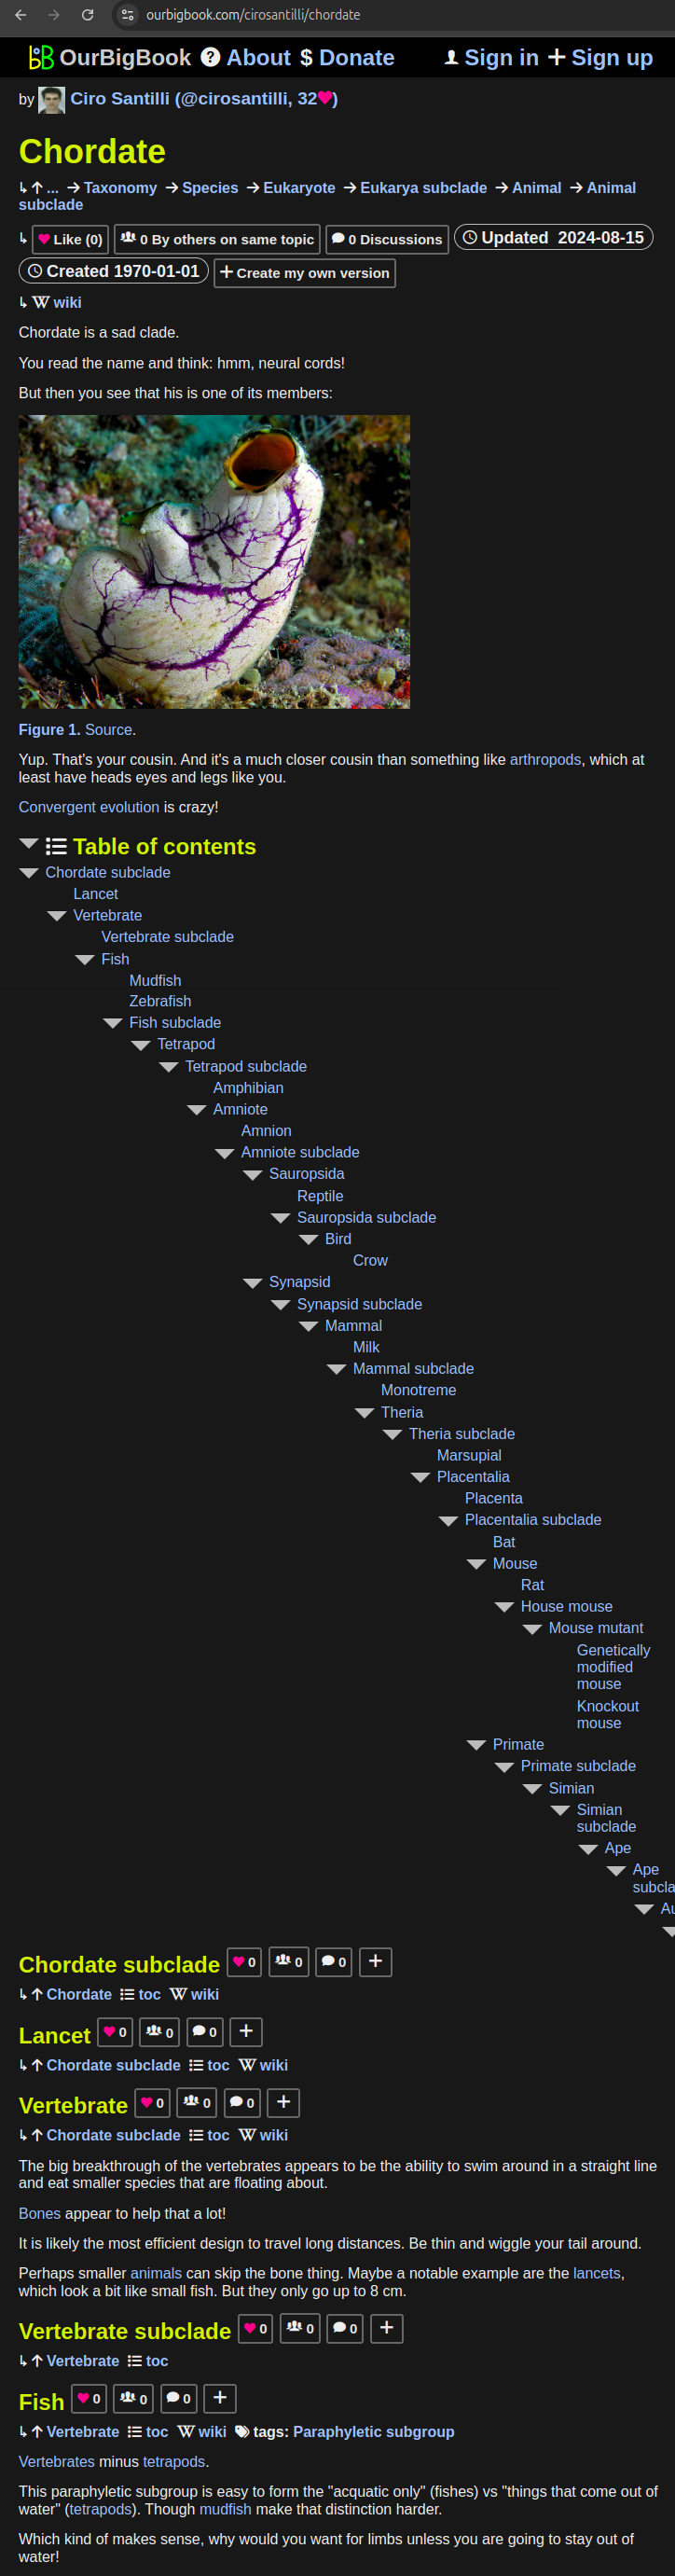
All our software is open source and hosted at: github.com/ourbigbook/ourbigbook
Further documentation can be found at: docs.ourbigbook.com
Feel free to reach our to us for any help or suggestions: docs.ourbigbook.com/#contact