Solutions to all parts of the held paper, including the four inline Roman parts of 2(c). Source PDF: Oxford, A15274H1, 9 June 2025. Numbered headings retain the source numbering; question statements are omitted.
The annual, zonal-mean absorbed sunlight falls from the tropics towards the poles much more strongly than outgoing thermal radiation. Thus Earth's top-of-atmosphere radiation budget has a tropical surplus and a polar deficit, with changes of sign around latitude in a basic sketch. The curves below are illustrative, rather than measured data; their area-weighted global means agree.
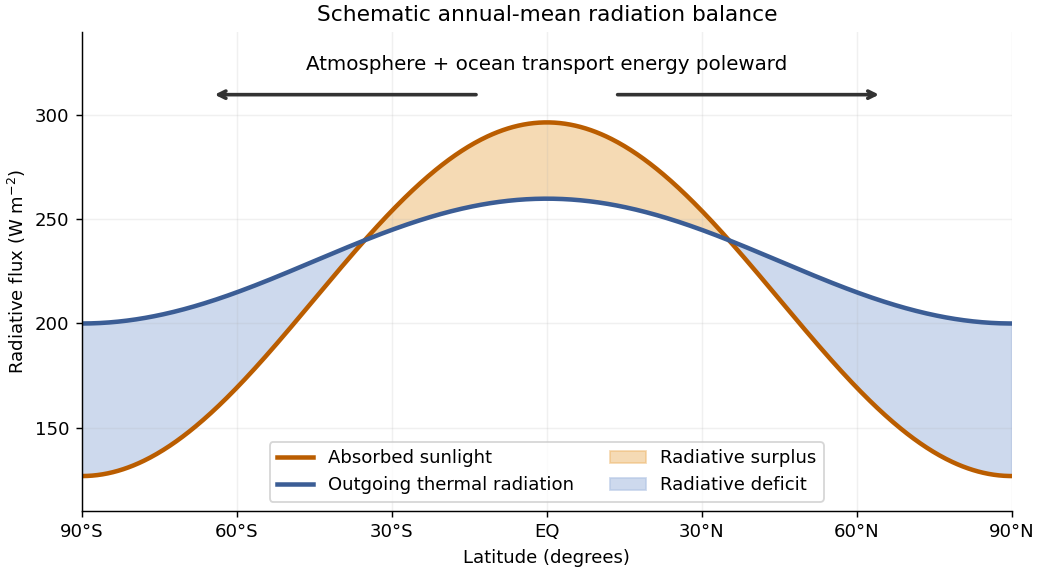

In a statistically stationary climate, local conservation of energy requires the surplus to be exported. If is the net downward radiative heat flux and the northward total power carried across the latitude circle, thenHere is Earth's radius. The terrestrial atmosphere and ocean circulation carry this energy poleward by moving warm and cold fluid, including atmospheric transport of latent heat. Without this transport the assumed steady radiation budget could not persist: the tropics would warm and polar regions cool until the budget changed. The tropical atmospheric contribution includes the Hadley cell: rising warm air near the equator, poleward flow aloft, subtropical descent, and an equatorward lower return.
For a parcel moving without an axial torque, conservation of angular momentum applies in an inertial frame. The specific axial angular momentum at latitude is“Initially at rest” means relative to the rotating surface at the equator, so . Neglecting atmospheric height compared with givesWith and , the eastward velocity at isThis is the ideal angular-momentum-conserving upper branch of the Hadley cell. Real jet streams exchange angular momentum through eddies and friction, so this estimate is not an observational claim about the actual wind speed.
Take eastward, northward and upward, and let be the eastward geostrophic wind. With Coriolis parameter independent of , geostrophic balance, hydrostatic balance, and the ideal gas law giveHere is the specific gas constant for dry air. Taking a vertical derivative of the first equation and interchanging mixed partial derivatives givesIt matters that is not constant in the pressure gradient force. Substitutingcancels the two terms proportional to and yields the height-coordinate thermal wind relationIf , this reduces toThe discarded term has relative scale when . Taking , and a atmospheric lapse rate of gives about . Thus this height-coordinate formula is a useful estimate, with potentially tens-of-percent compressibility-related correction through the vertical temperature gradient; it is not an exact consequence of the two balances. If the temperature gradient vanishes vertically, the displayed approximation is exact within those balances.
The hydrostatic approximation is very good on the broad, shallow atmospheric scales considered. The geostrophic balance is normally justified by a small Rossby number and fails as a general approximation near the equator. At , . With the ideal wind and a -- horizontal scale, --: quantitative accuracy is limited for this especially strong ideal jet. Small vertical aspect ratio alone does not ensure geostrophic balance, although a straight, steady zonal flow can satisfy it even when this scale estimate of the Rossby number is not small.
For the requested estimate, suppose the upper jet stream is above a weak surface wind, has temperature , and spans a meridional width . Integrating the approximate thermal wind relation in scale form givesThe northward temperature gradient is negative because the eastward wind strengthens upward. A -- jet width gives roughly --. No unique numerical difference follows without specifying the jet width, height and representative temperature; these are explicitly estimated quantities.
Write the velocity field as , . The uniform background has zero relative vorticity, and the perturbation has . Keeping only terms linear in the perturbations givesThe incompressibility condition permits a streamfunction with , , hence . Thus the Linear Rossby-wave equation here isChoose a plane wave , with . Substitution givesand therefore the local Rossby-wave dispersion relation in a zonal jetThe term is the background Doppler shift; the intrinsic phase velocity is westward. A real physical wave can always be represented using the conjugate wavevector if necessary to choose .
The relevant ground-frame zonal phase velocity and group velocity areTime increases downward in the source diagram. The individual phase contours lean towards increasing longitude as time increases, so their phase velocity is eastward. The envelope moves eastward faster: successive crests grow at the downstream edge and decay upstream. This illustrates Rossby-wave downstream development.
For the intended purely zonal wave packet, , andConsequently, with and the positive-frequency choice ,There is a small interpretation qualification: if “zonally propagating” specified only the plotted direction while allowing an unknown nonzero meridional wavenumber, eastward phase velocity alone would imply , not the stronger bound on alone. In this uniform model a strictly zonal group velocity with does imply , which supplies the intended interpretation.
For a zonal background , its relative vorticity is . The meridional absolute vorticity gradient is thereforeAt ,A localized jet stream of velocity scale and width hasFor -- this is about -- times the planetary contribution, so wind curvature cannot generally be neglected. The coefficient in this scaling depends on the chosen jet profile and width convention.
Linearizing the vorticity equation now gives the Rossby-wave equation for a sheared zonal currentFor a qualitative estimate at the jet core, freeze the local coefficients. At a smooth maximum , so : the restoring absolute vorticity gradient is stronger. The local Rossby-wave dispersion relation in a zonal jet gives, for the same local and zonal wavenumber with ,soThe envelope in the diagram would advance eastward faster, while individual phase contours would advance more slowly eastward, become stationary if , or move westward if . The separation between envelope and phase speeds increases. On a plot with time downward, compare horizontal displacement at fixed time: the envelope moves farther right, while a given phase moves less far right, or left after reversal. If the frequency changes sign for a fixed signed , conjugate the mode to restore the convention ; the physical propagation is unchanged.
This conclusion concerns the concave-down jet core. On a flank with the correction has the opposite sign; the value at the edge of the Hadley cell alone does not specify the curvature everywhere. Indeed the angular-momentum-conserving profile in 1(a) is a rising inner branch, not a complete smooth jet maximum. A global sheared-current normal mode requires its meridional structure and boundary conditions; the local calculation is the qualitative estimate requested.
Define the salinity contrast , positive when the warm box is saltier. The linear equation of state gives the cold-minus-warm density contrast and signed volume fluxHere represents warm upper water travelling poleward and cold deep water returning equatorward. The in this question is the haline density coefficient, unrelated to the planetary vorticity gradient in Question 1. The imposed heating and cooling are taken to maintain .
For the positive circulation shown in the source diagram, the exact stationary salt budget of the cold box isThe precipitation adds no salt. Replacing the salinity multiplying the small compensating volume flux by a reference gives . When circulation reverses, the upstream box for the exchange reverses too: the homogenizing exchange is , not . In the same reference-salinity approximation the two stationary salt budgets reduce toFor example, when and , the exact cold-box balance is , giving and the same leading approximation.
Substitute into the density-driven volume flux and multiply by :Both and have the units of volume flux, so every term has units of squared volume flux. The absolute value expresses the fact that transport in either direction reduces the salinity contrast, while the density contrast sets its direction.
The requested equation is thus the reference-salinity, or virtual salt flux, version of the two-box overturning model. If the finite compensating flow is retained exactly with unequal , one has the appropriate upstream salinity on the right-hand side instead of exactly . The approximation assumes and . Also, for , cannot be a steady solution: the imposed freshwater transport would build an uncompensated salinity contrast.
Using the constants as printed, with volume flux measured in Sverdrups, givesIn particular the two small expansion coefficients should not be silently replaced by different oceanographic values.
For a positive steady volume flux, the equation in 2(a) is . For a negative steady volume flux, it is , with only its negative root admissible. Therefore for the branches areThe upper positive branch is stable, the lower positive branch is unstable, and the reversed branch is stable under the usual salt budget dynamics with fixed . Thus there is bistability below the positive-branch fold. At the fold the two positive equilibria merge with a zero restoring rate; the point is not an ordinary asymptotically stable interior point of either branch. The negative algebraic root of the positive- quadratic, or positive root of the negative- quadratic, must never be added as extra solutions.
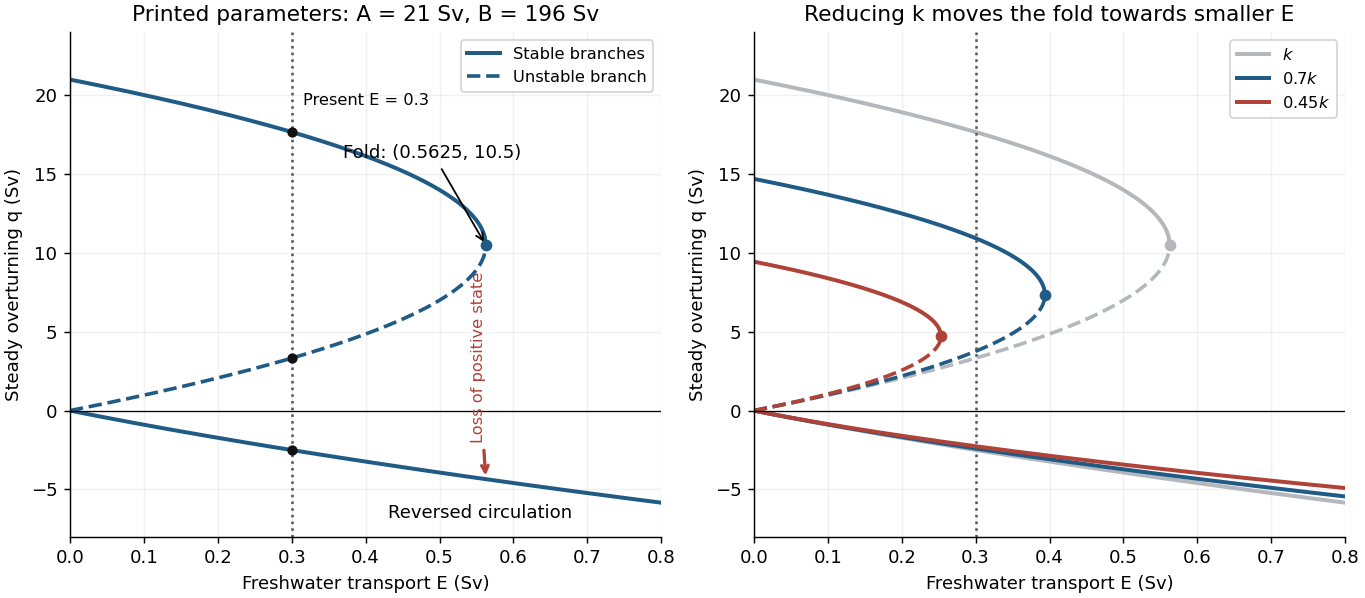
Steady overturning branches, their stability, and the effect of reducing the density-to-transport coefficient
. Details. 
At , the three steady volume fluxes areThe present thermally dominated, northward-upper-flow Atlantic meridional overturning circulation corresponds to . These algebraic data alone also allow a stable reversed state, so selecting the present branch uses the stated circulation direction. On the large positive branch, the predicted salinity contrast is , consistent with the reference-salinity approximation. The weaker branches give larger contrasts, approximately and , so the approximation is less accurate there.
The saddle-node bifurcation occurs atFor , only the reversed steady volume flux remains. At there are still two distinct values, the double positive root and the negative root; “single-valued” holds strictly above this threshold.
Slowly increasing from the present value causes the stable positive volume flux to weaken. Its salinity contrast then increases because salt exchange is weaker, reducing the cold-box density advantage further: this is the salt-advection feedback. At the fold the positive steady state disappears, producing an abrupt transition to the reversed branch in the quasistatic limit. At the same that branch hasFor a finite slow ramp there can be a small dynamical delay near the fold. In this model subsequently reducing while keeping it positive follows the stable reversed branch instead of automatically restoring the positive branch, an example of hysteresis. The two small branches approach as . At this is an equal-density, no-exchange equilibrium with , whereas the positive branch tends to with . One must use the original density relation at this endpoint, rather than divide by .
The reversal is thermally opposed but salinity driven: freshwater makes the cold box sufficiently fresh that the warm, salty box becomes denser. A real weakening would reduce the northward ocean heat flux and alter regional climate and ocean ventilation. The fold and full reversal here describe the ideal two-box overturning model; its numerical threshold is not a forecast for the real ocean, whose other controls appear in 2(c).
Northern high-latitude cooling removes heat from surface water and raises its density. If the surface water becomes denser than the water below, convection mixes it downward and forms dense water that can be exported in the deep southward branch of the Atlantic meridional overturning circulation. This water-mass transformation helps maintain the contrast represented by in 2(a). Freshening can oppose it by reducing density and increasing stable stratification. Local convection and the basin-integrated sinking volume flux are related but are not the same process: export and the return path also depend on the large-scale dynamics.
Dense water formed in marginal seas spills over sills and descends the continental slope as a marginal-sea overflow. Strong shear flow generates turbulent mixing and entrainment of surrounding, lighter water. The descending current's volume flux grows while its density anomaly is diluted, modifying the depth at which it joins the deep circulation and the temperature and salinity of the exported water. Thus the deep volume flux can substantially exceed the source overflow volume flux; it cannot be inferred from northern surface cooling alone.[ref]
https://www2.whoi.edu/staff/lpratt/wp-content/uploads/sites/120/2019/07/PrattSec2.11_11823.pdf. Anatomy of an overflow, section 2.11: observed downstream entrainment and dilution of the Faroe Bank Channel overflow
Southern Ocean westerly wind stress drives northward surface Ekman transport in the Southern Hemisphere. Its divergence and the circumpolar geometry allow deep water to rise towards the surface along tilted isopycnals, providing an important return route for the deep branch of the Atlantic meridional overturning circulation. Surface heat fluxes and freshwater fluxes then transform the upwelled water before it enters shallower return pathways. The winds supply mechanical energy; the overturning cannot be represented entirely by a local northern density difference. Eddy-induced overturning opposes part of the wind-driven contribution, so the net water-mass transformation and transport need not increase in direct proportion to the wind stress.[ref]
https://www.awi.de/en/science/climate-sciences/physical-oceanography/main-research-focus/southern-ocean-overturning-circulation.html. Alfred Wegener Institute, Southern Ocean overturning circulation: wind-driven upwelling and its opposition by mesoscale eddies
Deep currents and tides moving across rough topography, including the Mid-Atlantic Ridge, generate internal waves. Their breaking produces turbulent mixing across isopycnals, called diapycnal mixing. This transfers buoyancy between deep and overlying waters, transforms dense water into lighter water, and contributes to the upward return needed to close the overturning. The required mechanical energy ultimately comes from winds and tides; roughness is a mechanism for converting this input into mixing, rather than an independent source of energy. Mixing is spatially concentrated, and local vertical motion depends on the divergence of the turbulent buoyancy flux, so enhanced mixing does not imply uniform local upwelling everywhere over a ridge.[ref]
https://www.whoi.edu/cms/files/vmix_38943.pdf. The Impact of Abyssal Mixing Parameterizations in an Ocean General Circulation Model, abstract and introduction: tidal internal-wave generation over rough topography and its role in overturning
With the same prescribed , , and , replacing by changes both transport coefficients:Hence the positive steady volume fluxes becomeand the negative steady volume flux isThe bifurcation diagram undergoes a particularly simple rescaling:Thus it contracts horizontally and vertically by the same factor. Its branch stability and saddle-node bifurcation structure persist, but the range of freshwater forcing that admits the stable positive circulation shrinks. At a fixed subcritical , the upper stable positive branch weakens, the lower unstable positive branch moves upward, and the reversed branch decreases in magnitude. These changes reduce the separation of the positive equilibria and the margin against an overturning transition. The right panel of the figure in 2(b) shows this for and .
For the present , a positive steady state exists only ifAt equality the positive branches merge at ; below it only the reversed steady state remains. If a discovery merely revises our estimate of , it revises the inferred branch strengths and threshold, rather than itself causing an instantaneous physical transition. If the real effective were to decrease slowly through the critical value while stayed fixed, this model predicts loss of the positive steady circulation and transition to the reversed branch. Uncertainty in therefore translates directly into uncertainty in the model's freshwater threshold and its inferred proximity to a transition.
Articles by others on the same topic
There are currently no matching articles.