A colloidal grain in a liquid is large enough to see with a microscope, yet small enough for thermal motion to compete with its tendency to settle. In the Perrin sedimentation experiment, the equilibrium number density falls with height: a visible miniature atmosphere. Counting grains at different heights measures an energy scale; tracking their Brownian motion measures a transport rate. Connecting both to the same Avogadro constant makes the experiment a quantitative test of kinetic theory. The Wiener measure describes an idealized path law; these measurements instead test a physical model and its material parameters.
Jean Baptiste Perrin's 1909 memoir traces his sedimentation experiments to May 1908. It reports relative counts , , , at heights , , , , and compares radius estimates from Stokes settling velocity, counted grain mass, and rows of touching grains.[ref]
Mouvement brownien et réalité moléculaire by Jean Baptiste Perrin. 1909 memoir, §§15, 20–22; scan pp. 28, 41–49
The 1926 lecture describes resin precipitated from alcohol into water, washed and fractionated by centrifugation to obtain nearly monodisperse gamboge or mastic grains. Diameter and density were measured separately. A sealed slide-and-cover-glass chamber prevented evaporation; a vertical microscope resolved roughly layers through a roughly depth. Refocusing and photographing compared layer populations after equilibrium; changing temperature reversibly changed the distribution.[ref]
Discontinuous Structure of Matter by Jean Baptiste Perrin. Nobel Lectures, Physics 1922–1941; Discontinuous structure of matter, 11 December 1926, pp. 148–150
In Les Atomes (1913), Jean Baptiste Perrin restricts the eyepiece view to fewer than five or six grains and alternates observations between heights. Focus displacement requires a refractive index correction to recover actual layer separation. Horizontal positions were marked with a camera lucida, usually every , and distances calibrated with a micrometer; the polygon joins sampled positions rather than recording the intervening trajectory.[ref]
https://fr.wikisource.org/wiki/Les_Atomes/III. Les Atomes, chapter III, §§61–64
[ref]https://fr.wikisource.org/wiki/Les_Atomes/IV. Les Atomes, chapter IV, §§70–75
Take identical rigid spheres of radius , particle density and displaced liquid density , at uniform absolute temperature . Let increase upwards from a reference layer and write . The buoyancy correction gives the effective gravitational massThe actual grain mass is ; the displaced liquid subtracts from the effective gravitational mass. In a dilute, noninteracting particle suspension, the Boltzmann distribution therefore givesHere is number density and is the Boltzmann constant. Equivalently, the dilute osmotic pressure supports the grains above it: . Dividing by and integrating yields the same exponential function. No dynamic viscosity appears in this equilibrium argument. If , the population instead increases upwards; at equal densities this gravitational model predicts uniform .
A microscope counts a finite optical slab, not an infinitesimal plane. For equal viewed area and slab thickness , an ideal uniform detection window centred at givesThus equal optical volumes preserve the exponential function count ratio exactly, even for finite , provided the windows lie wholly inside the accessible chamber and have the same detection response. Unequal depth response or overlapping a boundary can corrupt this inference. Repeated observations estimate the mean count; closely spaced visits need not be independent because grains remain in view.
For an original chosen model, set , , , and . These are illustrative inputs, not Jean Baptiste Perrin's measurements. Using givesIf equal observation effort gives expected count in the reference layer, the expected counts , and higher are approximately , and . Fractions describe expected values over observations, not fractional grains. Using the actual grain mass instead of its buoyancy-corrected value would make the inferred Avogadro constant six times too small for these chosen densities.
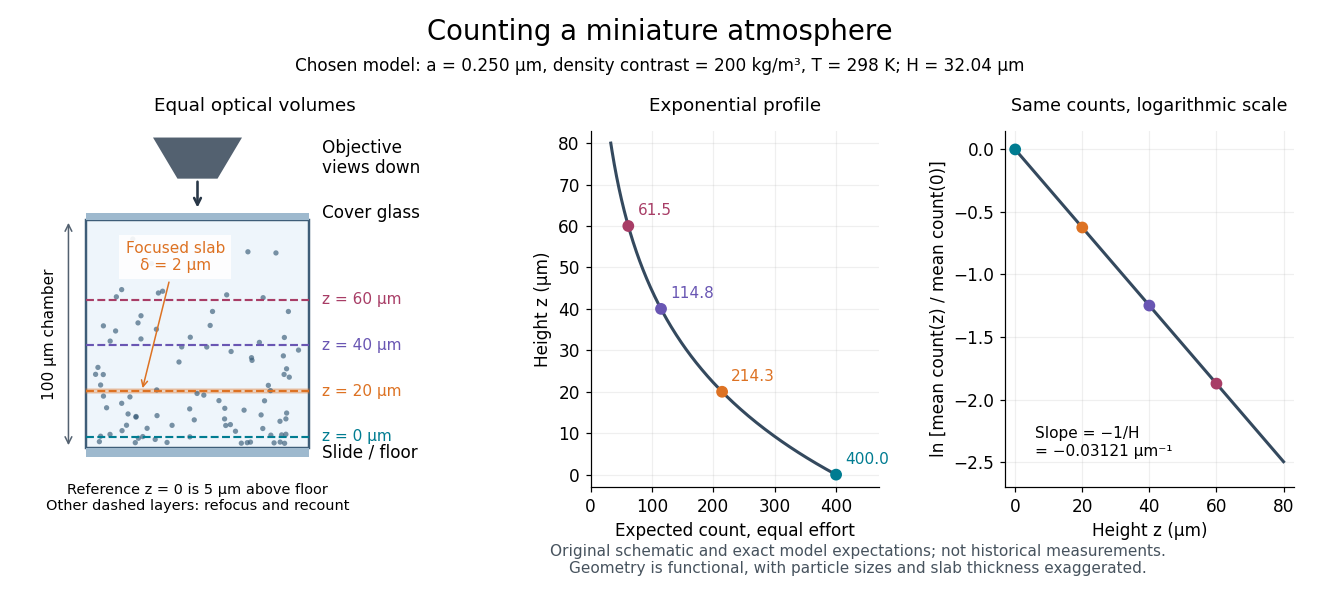

For two observed layers , define the positive logarithmic count slopeSince , where is the molar gas constant, the sedimentation scale height givesSeveral heights check whether one slope fits the whole profile. A mixture of grain radii generally gives a sum of exponential functions, with the larger grains depleted faster aloft; one apparent radius need not describe every height.
An independent readout uses horizontal displacements at lag , avoiding the vertical gravitational drift. Define the one-coordinate mean squared displacement . In a stationary liquid without horizontal advection, translational diffusion predictsA camera sees two horizontal coordinates, so its squared radial displacement has twice the one-coordinate mean. Neither observable is path length or instantaneous velocity. The bulk Stokes–Einstein relation, with dynamic viscosity , then gives
The 1926 lecture compares displacement-based and equilibrium determinations of the Avogadro constant.[ref]
Discontinuous Structure of Matter by Jean Baptiste Perrin. Nobel Lectures, Physics 1922–1941; Discontinuous structure of matter, pp. 152–154
Rotational diffusion supplies a further observable when an identifiable grain orientation can be followed; centre positions alone cannot measure it.
For the chosen model above and , the bulk prediction is . At , and the planar value is . Reconstructing from these stipulated model outputs returns by construction; this arithmetic consistency check is not experimental confirmation. Historical force comes from comparing separately measured profiles and displacements using independently checked material parameters.
The diffusive flux and gravitational particle flux provide another useful connection. With constant drag coefficient , zero vertical net flux readswhere is the downward settling velocity magnitude. With , the chosen model gives . The equilibrium profile forgets how rapidly it was established, while displacement measurements retain that rate information.
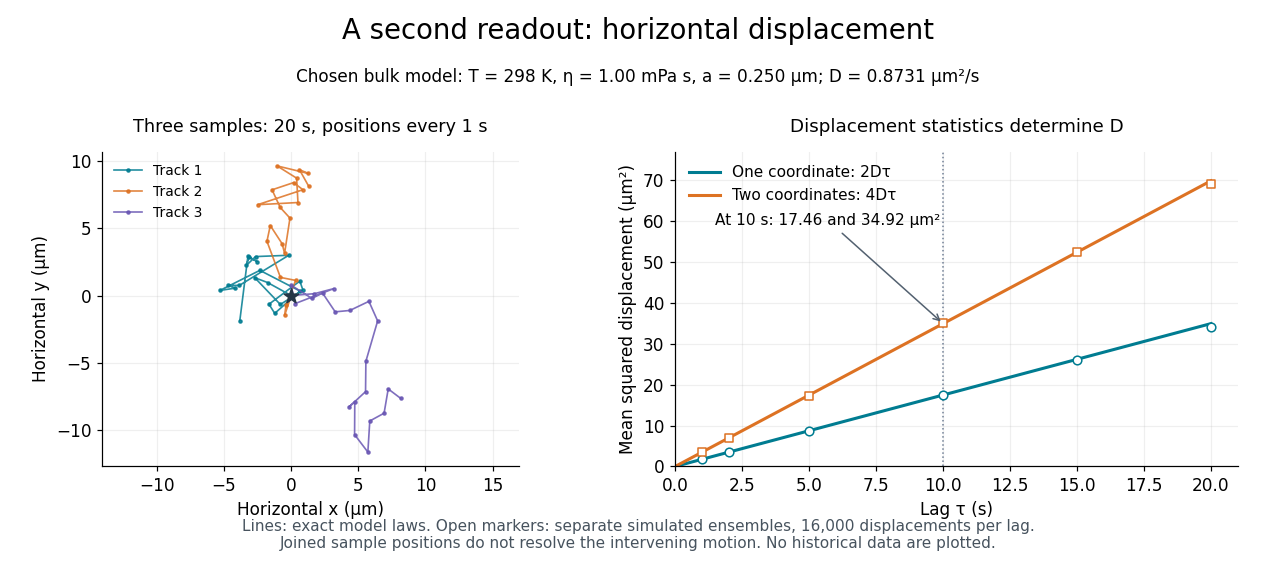
Independent horizontal displacement readout for the chosen Brownian model
. Three simulated planar tracks illustrate sampled endpoints. The other panel compares exact one-coordinate and planar mean squared displacement laws with separate simulated ensembles at each lag. These model observations do not reuse the height counts and are not historical measurements. All use . Details.
At fixed measured count slope, , whereas at fixed measured diffusion coefficient, . First-order propagation of uncertainty follows by taking logarithmic derivatives:For independent small errors, the radius contributes to the relative variance of , compared with for . Shared radius and temperature calibrations make the two estimates correlated; their agreement is therefore not two wholly independent determinations. As a finite-error example, overestimating by multiplies the respective answers by and .
This explains the importance of the radius cross-checks in the 1909 memoir: testing the Stokes drag law through an independent radius estimate helps prevent circular inference.[ref]
Mouvement brownien et réalité moléculaire by Jean Baptiste Perrin. 1909 memoir, §§20–21, scan pp. 41–46
Convection must also be excluded: a residual horizontal speed adds to an uncentred mean squared displacement, making a linear fit misleading.Buoyancy changes the effective gravitational mass; a nearby no-slip wall changes the hydrodynamic resistance matrix and therefore the diffusion coefficient. These are distinct corrections. Write the horizontal resistance as , with representing wall hindrance at a specified height. Applying the Stokes–Einstein relation with that resistance givesif one mistakenly uses the bulk resistance in the inversion. A chosen would overestimate by ; this is a sensitivity example, not a correction measured in Jean Baptiste Perrin's apparatus. Normal and parallel coefficients of the hydrodynamic resistance matrix need not coincide. Stokes settling velocity near a wall can likewise bias a radius inferred using an unbounded-fluid formula.
For a passive dilute particle suspension at uniform temperature, a change of mobility alone does not change the Boltzmann distribution. In the absence of additional wall forces the correct local vertical flux is , so zero flux still gives the same sedimentation scale height. Walls can nevertheless invalidate that simple inference through adsorption, additional interaction energies, or sampling of inaccessible grain-centre positions. Optical position errors and exposure averaging also affect displacement readout; varying distance from the wall, observation lag and optical depth tests different possible errors.
Articles by others on the same topic
There are currently no matching articles.