Topics (384k) Articles (398k) Users (410) Discussions (242) Comments (383) Files (13k) New article

A stretchy mathematical operator can adapt its extent to the surrounding mathematical layout. In MathML Core, an
mo element's stretchy property participates in this decision. A mathematical delimiter around a tall typeset fraction is a familiar example. Actual stretching also requires an applicable constraint and suitable computer font data.[ref]For an original example, use
<math xmlns="http://www.w3.org/1998/Math/MathML"><mrow><mo stretchy="true" minsize="2em" maxsize="3em">(</mo><mfrac><mi>x</mi><mn>2</mn></mfrac><mo stretchy="true" minsize="2em" maxsize="3em">)</mo></mrow></math>. The row places two mathematical delimiters around a typeset fraction with numerator and denominator 2.Suppose the positive block-axis target totals, already expressed at a common scale, are , and em. The stated size bounds adjust them to , and em, respectively. This is the target-size constraint step, not a prediction of exact rendered ink heights. The complete algorithm also handles ascent/descent and symmetry about the Math axis.[ref]
MathML Core by World Wide Web Consortium. §3.2.4.3: minsize/maxsize normalization and target-size adjustment
Suitable mathematical glyph variants or mathematical glyph assemblies can supply the extended form. Setting
stretchy="false" changes the operator's instruction without changing the fraction's two operands. Layout properties and font constructions therefore belong in a controlled comparison; enlarging every outline uniformly is not the definition of stretching.A three-valued logic uses three truth values together with specified logical connectives and a rule for which values count as designated truth. The truth-value set alone does not determine the logic. A third value can represent incomplete information, but its intended interpretation and inference rules must also be supplied.
For a concrete strong-Kleene semantics, take , , and define negation by , conjunction by and disjunction by . Then and , while . If only is designated, the law of excluded middle is not valid for every valuation in this semantics.
Another three-valued semantics can use implication . It makes , whereas defining implication as would give . This explicit difference shows why one cannot reason from the number of values without specifying the connective tables and designated values.
The latent period is the interval from infection until the infected host becomes infectious. The incubation period instead ends at symptom onset. Neither interval is defined by the time of a diagnostic test.[ref]
Household Transmission Investigation (HHTI) template protocol for respiratory pathogens with pandemic potential by World Health Organization. Section 1.3, printed p. 8 and Figure 1: latent, incubation and generation intervals
For an illustrative infection beginning on day zero, infectiousness beginning on day two and symptoms beginning on day five give a two-day latent period and five-day incubation period. The host can transmit during the intervening three days despite not yet having symptoms. Changing these relative timings changes which observation-based interventions can interrupt transmission.
In an SEIR model, the exposed compartment contains infected hosts who are not yet infectious. A transition term gives independent exponentially distributed latent durations of mean . A fixed latent duration is a different model: all hosts infected together enter the infectious compartment after the same delay. Equal means therefore do not make the two latency assumptions dynamically equivalent.
An internal-standard-normalized matrix factor divides the mass spectrometry matrix factor of an analyte by that of an internal standard:Here M and0 denote matched matrix and neat-reference responses, with equal corresponding amounts and appropriate blank correction. The number asks whether matrix-dependent response changes cancel in the analyte-to-standard ratio. It does not assert that neither signal is suppressed.
For two invented matrices, let analyte factors be and standard factors also . Both normalized factors are1. With standard factors instead, the normalized factors become . Normalizing by a poorly matched standard can increase variation rather than remove it. The original method study distinguishes matrix-response magnitude and variability across sources.[ref]
Strategies for the assessment of matrix effect in quantitative bioanalytical methods based on HPLC-MS/MS by B. K. Matuszewski and others. Abstract, absolute/relative matrix effects and response/recovery distinction.
The cancellation can be expressed algebraically. Suppose and , with small residual deviations. ThenA common multiplier cancels exactly, while different residual effects remain. To first order, their variance is . Correlation therefore matters; two individually variable signals can yield a stable ratio when they vary together.
This post-preparation comparison does not by itself establish matched extraction recovery. If analyte and standard matrix factors are equal but their recoveries are and1, the internal-standard-normalized process efficiency is still . State when the standard was added and which response comparison was normalized. An internal standard is useful through demonstrated shared behavior, not through its label alone.
Mass spectrometry process efficiency compares the response obtained after the entire stated preparation with the response from the same nominal analyte amount in a specified neat reference. It combines preparation loss and matrix-dependent response under the comparison conditions. It is therefore not simply the fraction of molecules physically retained.
Let be neat-reference peak area, the area from an extracted blank matrix spiked after preparation, and the area when the same nominal amount is spiked before preparation. With matched final volumes, injections and blank correction,The factors are mass spectrometry matrix factor and an estimate of extraction recovery. The decomposition separates quantities that the original method study evaluated independently.[ref]
Strategies for the assessment of matrix effect in quantitative bioanalytical methods based on HPLC-MS/MS by B. K. Matuszewski and others. Abstract, experimental distinction between matrix response and true recovery.
For invented areas , , , the matrix factor is , recovery , and process efficiency . The same process efficiency could arise from matrix factor and recovery . Equal overall response therefore does not identify the cause of reduced signal or which preparation change would help.
Response enhancement makes the terminology especially important. A stipulated matrix factor and recovery give process efficiency , or120%. This does not require extraction to create more analyte; the measured response per retained amount is larger than in the reference. Conversely, low process efficiency can be highly reproducible while still reducing useful signal.
Keep the comparison basis explicit. Residual analyte in a nominal blank, unequal preparation volumes, nonlinear response or detector signal clipping can invalidate the simple ratios. Apparent compensation between enhancement and loss can hide two substantial effects behind an overall ratio near one.
Total ion current normalization rescales a mass spectrum using its total included ion signal. For nonnegative, equally spaced spectral samples , a common implementation computes and reports when . The normalized values then sum to one. Multiplication by a common reference total gives another convention with the same relative ratios. The name refers to the summed spectral signal; a stored intensity need not itself be expressed in amperes.
This gives exact invariance to a common positive multiplier: replacing every by leaves every unchanged. It does not establish that every experimental disturbance acts through such a multiplier. The mass-to-charge ratio range, excluded peaks and treatment of background determine which signal contributes to the total ion current used for normalization.
A worked example exposes the effect of an unrelated dominant peak. Start with three recorded intensities , giving normalized values . If only the third intensity doubles, the spectrum becomes and the first normalized value falls to . The first feature's raw signal has not changed. Its normalized value has decreased because the denominator now contains more of a different feature. A spectrum of all zeros has no defined unit-sum normalization; assigning it an arbitrary denominator conceals missing information.
In MALDI tissue images, locally abundant peaks produced this kind of misleading attenuation, motivating comparisons with median- and noise-based normalization.[ref]
Normalization in MALDI-TOF imaging datasets of proteins: practical considerations by Sören-Oliver Deininger and others. “A pledge for normalization”, mouse-pancreas results and Figure 4: dominant insulin peaks and apparent attenuation of other signals.
Total ion current normalization can remove common intensity scaling, but ion suppression affecting only selected compounds violates that simple model. Report both the normalization rule and what the normalized image is intended to compare.Mass spectrometer detector saturation occurs when the recorded response ceases to increase proportionally with the incoming ion signal because part of the detection or acquisition chain reaches a limit. The affected stage matters: finite amplification response, overlapping events and digital range limits need not have the same correction.
A simple original detector signal clipping model iswhere is the ideal linear signal. If two peaks would have intensities 10 and 20 but , the recorded ratio becomes instead of . Every ideal signal at least 12 maps to the same ceiling, so the clipped value alone cannot determine the original intensity. Increasing nominal detector gain need not restore proportionality.
A 2022 mass spectrometry study treated saturated isotope signals using a different kind of information. It inferred intensity from an unsaturated member of a peptide's isotope pattern and a model of the expected ratios.[ref]
Simplifying MS1 and MS2 spectra to achieve lower mass error, more dynamic range, and higher peptide identification confidence on the Bruker timsTOF Pro by Daryl Wilding-McBride and others. Isotope-intensity inference; Figures 7–10
Such reconstruction supplies a model-based estimate, not a direct recovery from the clipped channel alone. It depends on the validity of the isotope-pattern model and the availability of suitable unsaturated measurements.Check linearity using appropriate reference signals or reduced sample delivery before treating peak heights or areas as proportional amounts. A flat-topped peak can motivate this check, but the shape alone does not locate the faulty stage or justify transferring another instrument's numerical threshold.
A quadrupole mass analyzer is a mass analyzer that selects ions through stability of motion in combined static and alternating quadrupole electric fields. Selected mass-to-charge ratios follow bounded transverse trajectories through the analyzer; others grow unstable and fail to reach its exit.[ref]
For an idealized model, define the electric potentialHere is a geometric scale and follow this stated potential convention. An ion with electric charge and mass then obeysAt a given instant the field focuses one transverse direction and defocuses the other. Alternation can nevertheless yield bounded motion in both directions. Rescaling time reduces these equations to forms of the Mathieu equation; a quadrupole stability diagram summarizes the relevant bounded-motion regions.
The equations also show why the filter selects a ratio. Doubling both and leaves the ideal equations unchanged. With fixed geometry, the dimensionless coefficients scale as and . Doubling the drive angular frequency while keeping the potentials fixed divides both coefficients by four; multiplying both potentials by four restores them in this model.
A stable mathematical trajectory is only part of instrument performance. Initial ion positions and velocities, finite flight length, field imperfections and detector response also influence transmission and measured mass resolving power. The ideal potential is an explicit model, not a guarantee about a particular instrument.
Net mass is the mass attributed to the material of interest after excluding the container or other specified tare mass. For a container-and-contents measurement, the ideal bookkeeping relation iswhere is the gross mass of the complete load and is the mass excluded as tare. State which parts of the load belong to each quantity.[ref]
For an own weighing example, a container and its contents give a mass estimate of , while the corresponding empty container gives . Assuming comparable conditions and no change in the container, the contents' estimated net mass isAn instrument's tare operation can instead establish the container reading as its reference before displaying a net indication for the added contents. The recommendation distinguishes this operation from subtracting a stored preset tare value.[ref]
The physical apparatus is a weighing scale: it determines mass using gravity under its measurement model. The fact that weighing terminology sometimes says weight value does not turn the result in kilograms into a force in newtons.[ref]
Non-automatic weighing instruments, Part 1. T.1.1, weighing instrument and mass/weight-value terminology, printed p5
Subtraction also exposes how errors enter. In a simple additive model, let the two estimated masses be and . ThenA stable common additive offset cancels when ; unequal errors do not. For example, overestimating the tare by while leaving the gross estimate unchanged underestimates net mass by the same amount.
Real measurements additionally involve resolution, drift, measurement uncertainty and the definition of the load. The exact algebraic relation between ideal quantities is not a promise that independently rounded display readings always reproduce the same final digit. Record the relevant tare and measurement conditions along with the net result, rather than treating net mass as a new kind of matter independent of how the excluded mass was defined.
Gross mass is the mass of the complete specified load, including its contents and the packaging counted as tare mass. For that same boundary,The gross indication in OIML's weighing terminology is obtained with neither a tare device nor a preset tare device operating, after an initial zero indication.[ref] A full crate's gross mass consequently differs from an individual jar's gross mass, because the specified loads differ.
Consider four jars, each containing of material and having an empty-container tare mass of . An outer crate adds . For the complete load, the net mass of the contents, composite tare mass, and gross mass are respectivelyThese are chosen bookkeeping values, assuming the listed components exhaust the load and each component is counted once.
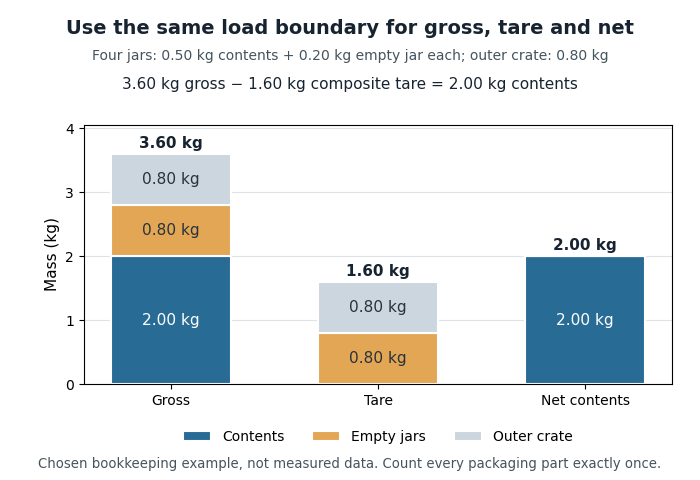
Gross, composite tare and net mass of four jars in one outer crate
. Original chosen example: 2.00 kg of contents, 0.80 kg of empty jars and 0.80 kg of outer crate. The colored parts represent disjoint portions of the complete load. Details.Subtracting the full composite tare mass from the complete gross mass gives of contents. If the jars' has already been removed from an intermediate total, subtracting the same full composite tare mass again gives . The missing is precisely the duplicated deduction. Use one load boundary and subtract each packaging component once.
The gross mass also remains relevant to maximum weighing capacity when a subtractive tare device reduces the available net-load range.[ref] For an illustrative instrument modeled with a gross-load limit, a container leaves for contents. At that limit the complete load still has gross mass , even though the tared display reports only its contents.
For a stationary ideal weighing scale, the normal contact force associated with a complete load is related to its gravitational weight. A displayed net mass is a processed indication of that load; it is not the full supported mass. Changes in the gravitational field, measurement calibration, or the load boundary must therefore be distinguished when interpreting a reading.
Tare mass is the specified container or packaging mass excluded when reporting net mass. It is also called tare weight in weighing terminology. The intended boundary matters: a jar alone and that jar with its lid have different tare masses. A tare device adjusts a weighing scale's indication with a load present, whereas a zero-setting device establishes zero with the load receptor unloaded.[ref]
A simple demonstration separates the reading from the physical load. Choose an empty container of mass and an ideal weighing scale that initially reads zero. After the container is placed on the load receptor, operate the tare device. Its displayed value becomes zero while the container's mass remains . In a uniform gravitational field with chosen magnitude , its gravitational weight is stillThe supporting force remains present after the display adjustment.
In an ideal unit-gain measurement model, the tared indication for a complete load of mass is . Adding of contents gives gross mass and indication . Removing the complete load while retaining that reference gives indication . The negative indication expresses the difference from the stored reference; the removed container still has positive mass.
A preset tare device instead uses an introduced preset tare value, which can be recalled or entered without weighing each individual empty container.[ref] For the same chosen load, using a preset of gives calculated net mass : the contents are overestimated by 20 g. A persistently low preset produces a systematic error even with otherwise exact readings.
Composite tare mass includes several excluded components, such as all the jars and an outer crate. The gross mass example shows how to account for these components once each. The symbol here denotes a mass; the terminology's use of the word weight does not change the quantity's unit from a kilogram to a unit of force.
Pinned article: Introduction to the OurBigBook Project
Welcome to the OurBigBook Project! Our goal is to create the perfect publishing platform for STEM subjects, and get university-level students to write the best free STEM tutorials ever.
Everyone is welcome to create an account and play with the site: ourbigbook.com/go/register. We belive that students themselves can write amazing tutorials, but teachers are welcome too. You can write about anything you want, it doesn't have to be STEM or even educational. Silly test content is very welcome and you won't be penalized in any way. Just keep it legal!
Intro to OurBigBook
. Source. We have two killer features:
- topics: topics group articles by different users with the same title, e.g. here is the topic for the "Fundamental Theorem of Calculus" ourbigbook.com/go/topic/fundamental-theorem-of-calculusArticles of different users are sorted by upvote within each article page. This feature is a bit like:
- a Wikipedia where each user can have their own version of each article
- a Q&A website like Stack Overflow, where multiple people can give their views on a given topic, and the best ones are sorted by upvote. Except you don't need to wait for someone to ask first, and any topic goes, no matter how narrow or broad
This feature makes it possible for readers to find better explanations of any topic created by other writers. And it allows writers to create an explanation in a place that readers might actually find it.
Figure 1. Screenshot of the "Derivative" topic page. View it live at: ourbigbook.com/go/topic/derivativeVideo 2. OurBigBook Web topics demo. Source. - local editing: you can store all your personal knowledge base content locally in a plaintext markup format that can be edited locally and published either:This way you can be sure that even if OurBigBook.com were to go down one day (which we have no plans to do as it is quite cheap to host!), your content will still be perfectly readable as a static site.
- to OurBigBook.com to get awesome multi-user features like topics and likes
- as HTML files to a static website, which you can host yourself for free on many external providers like GitHub Pages, and remain in full control

Figure 2. You can publish local OurBigBook lightweight markup files to either OurBigBook.com or as a static website.
Figure 3. Visual Studio Code extension installation.
Figure 5. . You can also edit articles on the Web editor without installing anything locally. Video 3. Edit locally and publish demo. Source. This shows editing OurBigBook Markup and publishing it using the Visual Studio Code extension. 
- Infinitely deep tables of contents:



All our software is open source and hosted at: github.com/ourbigbook/ourbigbook
Further documentation can be found at: docs.ourbigbook.com
Feel free to reach our to us for any help or suggestions: docs.ourbigbook.com/#contact